INTRODUCTION
Food industries are mainly challenged by consumerʼs demand in quality, safety and minimally processed products that do not contain chemical preservatives and maintain health benefits. These encourage the use of dietary fiber (DF) as functional food (nutraceuticals).1 Functional foods play a special role to satisfy hunger, provide the necessary nutrients, and prevent nutrition related diseases.
Dietary fiber compounds composed of non-digestible carbohydrate by endogenous enzymes and a mixture of plant carbohydrate polymers.2 The physical properties of DF in food determine the physiologic effects and potential health benefits.3 Such as, influence on glucose and fat absorption and bowel function.4
The difference in pattern of diabetes varies in countries due to economic status and forecasted to be present in 2030 according to International Diabetes Federation (IDF).5,6 Hence, this paper has shown the significant advantage of improving white breads with soluble DF (pectin) through providing an important information on a) using of agricultural sources for therapeutic and to alleviate nutrient related health problems, b) aware the value of waste disposal of agricultural or fiber sources, such as bran or peel of fruits; c) increasing the advantage of using soluble dietary fiber SDF (pectin) as raw materials in food industries.7,8
METHODS
Potential crude fiber sources were screened from cereals and fruits. Analysis of TDF, IDF and SDF were done using methods no. of AOAC 985.29 and 993.19.9
Pectin, SDF, extracted from sources was based on the method of Sadasivam and Manickam.10 Quantitative determination of pectin content was done using ultravioletvisible (UV-V) spectrophotometer (λ=520 nm) for the reaction of galacturonic acid with carbazole in presence of sulfuric acid.
Samples of improved products, baked bread, were prepared6 at 3rd level by proportionate wheat flour to baobab (adansonia) and/or avocado pulps accordingly [ADB1/AVB1 (97:3); ADB2/AVB2 (94:6); ADB3/AVB3 (88:12); Control (100:0)]. The proximate values were analyzed for the above samples using methods for determination of content for crude fat (Soxhlet method), crude protein (Kjeldahl method), moisture, total ash, crude fibers using method no. of AOAC 4.5.01, 979.09, 925.05, 941.12 and 920.169 respectively and total carbohydrate by difference method.
Estimation of in vitro kinetic of starch digestion was done using the method of Goni.11 The rate of starch digestion was expressed as the percentage of total starch hydrolyzed at difference of 30 minutes in time intervals. The areas under curves (AUC) for hydrolysis of all products were calculated for the release of glucose concentration against time. The HI was calculated as the relation between the AUC for a food and the AUC for a reference food, white bread, expressed as a percentage.
Sensory evaluation was performed in 12-18 hours after baking in evaluating color, texture, taste, odor and overall acceptability of the bread samples.6
RESULTS AND DISCUSSION
Compositions of crude fibre were screened from cereals (teff white (TW), barely without bran white (BWB), wheat whole white (WWW), wheat whole black (WWB) barely whole white (BWW)) and fruits (avocado pulp (AVP), baobab pulp (ADP)) as a source (Table 1). However, baobab pulp (Adansonia Digitata) was found higher in crude fiber content than avocado and cereals, avocado was selected among others in consideration to the economic feasibility and accessibility.
Table 1: Screening of cereals and fruits for crude fibers content in wet and dry base Significance differences (p<0.05) are indicated with superscripts a,b,c.
|
Sample Type
|
%Moisture |
%Fiber in Wet Base |
%Crude Fiber in Dry Base |
Reference Moisture |
Reference Crude Fiber
|
|
TW
|
10.78±0.02
|
2.62±0.21a |
2.93±0.42a |
10.90 |
2.00
|
|
BWBW
|
10.27±0.29
|
2.72±0.40a |
3.03±0.02a |
9.10 |
2.20
|
|
WWW
|
10.95±0.06
|
3.08±0.74a |
3.46±0.02a |
9.50 |
2.30
|
|
WWB
|
10.91±0.03
|
4.85±0.02a |
5.44±0.03a |
11.30 |
3.00
|
|
BWW
|
11.27±0.17
|
3.97±1.47a, b |
4.47±0.69a,b |
7.70 |
2.00
|
|
AVP
|
4.83±0.05
|
5.16±0.69b |
5.42±0.01b |
8.12 |
3.10
|
|
ADP
|
8.73±0.22
|
8.53±1.47c |
9.35±0.18c |
10.4±0.1 |
16.2±0.09
|
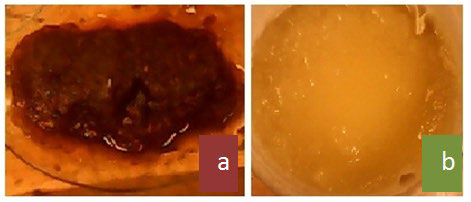
The yield of extracted pectin from baobab pulp (a) and avocado pulp (b) (Figure 1) were found 20.94±2.42% and 3.01±1.41% respectively on dry base. The reported baobab pectin yield was obtained more than 10%.12
Figure 1: Extracted pectin from (a) Baobab pulp, (b) Avocado pulp.
The yield (%) of dietary fibres TDF, IDF, SDF (p<0.05) for avocado and baobab pulp (Table 2) suggested baobab has been considered as a potential source for pectin.
Table 2: Dietary fiber composition of raw materials, avocado and baobab.
Significance differences (p<0.05) are indicated by superscripts a, b.
|
%Yields
|
AVR |
ADR
|
|
TDF
|
13.09±0.80%a |
33.29±2.58%b
|
|
IDF
|
5.38±0.16%a |
12.95±2.17%b
|
|
SDF
|
7.71±0.96%a |
20.34±4.75%b
|
The nutrient compositions, which indicate the food quality, was indicated by its proximate composition (Table 3). The improved bread with avocado (AVB) indicated higher energy value due its fat content however it reduced the carbohydrate composition lesser by improved bread by baobab (ADB).
Table 3: Proximate value in dry base [g/100 g] for wheat flour, raw fruits and improved breads.
Values are mean±SE; superscripts a,b,c indicate significantly different at (p<0.05) for triplicate determinations
|
Sample Code (WFR:AD)
|
%Moisture |
Ash |
Protein |
Fat |
Crude Fiber
|
Carbohydrate
|
Energy (KCal/gm)
|
|
ADB1
|
6.59±1.27b |
5.63±0.79 b |
9.84±0.50 c |
5.54±0.80 a |
7.98±0.49 b
|
64.41±0.98 b
|
346.87±4.3C7
|
|
ADB2
|
7.48±0.37 b |
6.93±0.28 c |
10.09±0.67 c |
6.44±1.26 a |
8.37±0.89 b
|
60.70±0.98 b
|
341.10±5.98
|
|
ADB3
|
8.42±0.29 c |
8.55±0.19d |
12.56±0.78 d |
6.41±0.90 a |
9.38±0.05 b
|
54.67±0.24 a
|
326.64±4.06
|
|
AVB1
|
4.97±0.07 a |
3.23±0.82 a |
3.65±0.19 b |
9.41±1.15 a |
5.27±0.89 a
|
73.46±1.56 b
|
393.C19±5.78 |
|
AVB2
|
5.84±0.08 b |
3.52±0.25 a |
4.30±0.20 c |
13.63±0.82 b |
7.04±0.04 a
|
65.68±0.29 b
|
402.59±3.11
|
|
AVB3
|
6.03±0.54 b |
3.68±0.42 a |
4.30±0.22 c |
16.41±1.30 c |
5.85±0.70 a
|
63.73±1.74 b
|
419.76±6.51
|
|
WBD
|
6.26±0.32 b |
2.80±0.15 a |
9.71±0.65 c |
4.92±0.43 a |
6.10±1.51 a
|
70.19±0.40 c |
363.94±2.69
|
|
ADR
|
7.41±0.90 a |
8.98±0.61 b |
5.39±0.45 d |
1.94±0.25 a |
14.30±1.26 b
|
61.98±1.02 b
|
286.92±2.71
|
|
AVR
|
13.19±0.33 b |
3.01±0.45 a |
2.50±0.28 a |
18.72±0.34 b |
5.95±0.51 a
|
56.62±0.08 a
|
405.03±1.50
|
|
WFR
|
12.68±0.22 b |
2.05±0.46 a |
10.47±0.65 c |
2.51±0.51 a |
8.70±0.71a
|
63.58±0.37c
|
318.81±2.89
|
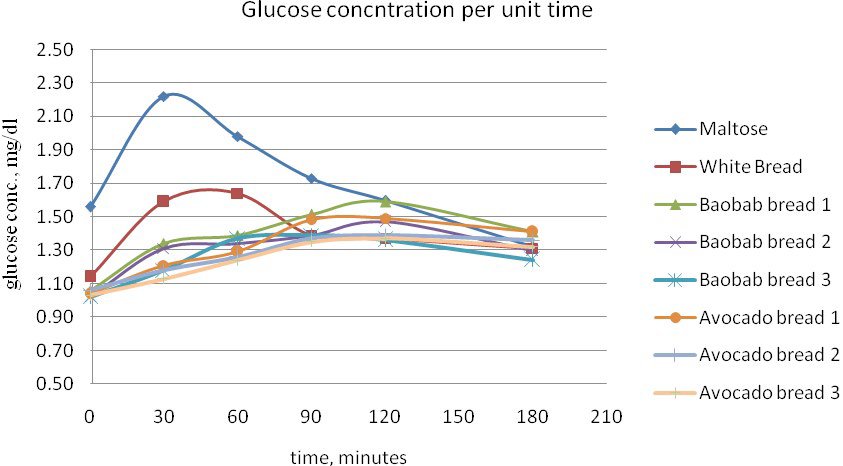
The intensity of releasing glucose concentration was calculated from the calibration curve using Beer’s law.11 The samples are prepared from improved white bread (product) proportionally on the basis of pectin potential at 3 levels.
The kinetic response (release) of glucose concentration (Figure 2) was found in decreasing the intensity from maltose (reference control) to AVB type 3 with increasing time. As a result, the improved products indicate the delay in hydrolysis time for which accounts for water retaining capacity. The HI was calculated as the relation between the AUC for a food and the AUC for a reference food, white bread, expressed as a percentage (Table 4). HI is a good predictor of glycemic response. Thus, the predicted GI was estimated using GI=39:71+(0.549*HI).13
Table 4: Hydrolysis index and predicted GI for the samples and controls
Mean±SE, superscript letters a to h indicates significantly different at (p<0.05)
|
Type
|
HI |
GI
|
|
Maltose
|
100.00±0.33a |
94.61±0.33a
|
|
White Bread
|
78.57±0.37b |
82.84±0.37b |
| Baobab bread 1 |
74.54±0.21c |
80.63±0.21c
|
|
Baobab bread 2
|
70.86±0.31d |
78.61±0.31d |
| Baobab bread 3 |
68.57±0.29e |
77.36±0.29e
|
|
Avocado bread 1
|
70.66±0.30f |
78.50±0.30f |
| Avocado bread 2 |
68.42±0.29g |
77.27±0.29g
|
|
Avocado bread 3
|
66.72±0.28h |
76.34±0.28h
|
Figure 2: Kinetic response of improved products.
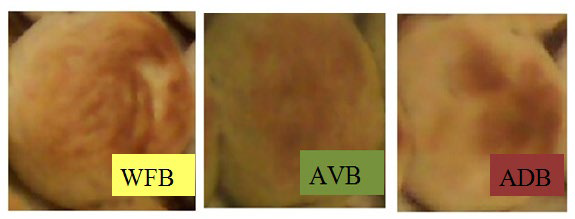
These findings for estimation of in vitro analysis was compared with the report from Daou et al, Goni et al and Lee et al.11,14,15 The physical properties (structure, particle size, porosity and density) and chemical composition have an important effect on the soluble fractions due the water holding capacity of dietary fibres. As reported by Lecumberri et al,16 soluble fibres like pectin have a high hydration capacity, holding water and swelling to form viscous solutions (Figure 3). Thus, it adsorbs and retains other substances like glucose, minerals, no polar molecules (i.e. fats, bile acids), etc.
Figure 3: White bread (WFB), avocado improved bread (AVB), baobab improved bread (ADB).
The sensory analysis for products were described by semi-trained analysts by whom the data was analyzed in SPSS20 for different attributes. The result was indicated (Table 5) for the 3 products.
Table 5: Overall acceptance of the sensory attributes between products.
Mean±SE, superscript letters a,b,c indicates significantly different at (p<0.05). Keys: 1=like extremely, 2=like very much, 3=like moderately, 4=neither like nor dislike, 5=dislike moderately, 6=dislike very much, 7=dislike extremely.
|
Attributes
|
Bread type
|
|
ADB
|
AVB |
WB
|
|
Color
|
2.18±0.93a |
2.88±.1.46a |
1.60±0.71 b |
| Texture |
2.50±0.85a |
2.65±.1.17a |
2.15±0.92b
|
|
Flavor
|
3.15±.1.37 a |
2.40±.1.11 b |
2.00±0.88 c |
| Taste |
3.10±1.30 a |
2.60±.1.06 b |
2.25±0.84c
|
The degree of likeness for color and texture, there is no significant difference (p>0.05) between ADB and AVB, while WB indicates significantly different (p<0.05) from ADB and AVB. Declining the magnitudes of the degree of likeness for flavor and taste, all products (ADB, AVB and WB) have shown that there were significant differences among them. This may be from the habituated nature or alteration of users from normal circumstance unenhanced (unimproved) dietary fiber and this probably required longtime adaptation. The texture for AVB is significantly different from WB while insignificantly different from ADB. Probably, this may be from the moisture content of avocado and baobab and due to the water absorption or holding capacity of the product.
CONCLUSION
The study has argued for a hypothesis that improved white bread has no effect on estimation of GI. For this reason, analysis for estimation of hydrolysis, GI and sensory attribute was carried out for improved white bread with dietary fibre.
- As a result, the prediction for low GI in enhanced white bread was significantly differing from white bread. Hence, the present study is concluded as: The components of dietary fibre composition of selected avocado and baobab fruits pulp were found as an advantage to be integrated in a white bread.
- The potential composition of functional fibre (pectin) component in fruits indicates its physiological metabolic benefit as a nutraceuticals model.
- The dietary fibre (functional fibre) enhanced white bread suggested an apparent delay in releasing glucose concentration during hydrolysis and effects in slowing down the carbohydrate absorption in the management of blood glucose level.
- The overall acceptability for the improved white bread was liked moderately while for white bread was liked very much, however an adaptation to typical product natures interferes.
RECOMMENDATION
- Metabolic effect of enhancing dietary fiber in human subject has not been studied and an in vivo glycemic index or blood glucose level shall be conducted for future study.
- Purification and characterization of the soluble dietary component, physico-chemical characteristics and other most related parameters like available or resistance starch were not included in the study. Hence, the measurements of such parameters are suggested.
- Consumers shall use dietary fiber enhanced foods for the management of blood glucose.
- The findings of this study can be used as base line information or an indicator to food processors and related users.
ACKNOWLEDGMENT
AAU-Center for Food Science and Nutrition, Megazyme Co. Ltd (Dr. Barry) – Ierland, Eng. Wudeneh, Dr. Endale, Dr. Yehune, Dr. Kaleab/Dr. Ashagrie/Dr. Dawd
CONFLICTS OF INTEREST
The authors declare that they have no conflicts of interest.