INTRODUCTION
Cardiovascular disease (CVD) is the leading cause of death both in the U.S. and worldwide.1,2 Short-term health effects of air pollution on CVD have been studied over the years.3,4,5 Several plausible biological mechanisms connecting air pollution and CVD events have been proposed: pollutants can increase the risk of arrhythmia, increase systemic inflammation and oxidative stress, and increase the plaque vulnerability, and thus, trigger CVD events.3,6 Based on this evidence, the U.S. Environmental Protection Agency (U.S. EPA) has implemented dozens of air quality related policies and regulations over the past few decades to reduce air pollution levels in the U.S.7,8 Thus, the levels of PM2.5, NO2 and SO2 have decreased dramatically.9 We are seeking to answer if these lower levels of air pollutants are associated with a lower risk of CVD emergency room events over time. Krall et al10 reported in 2018 on a five city study of 12 pollutants for the period 2002-2008 for cardiovascular and respiratory emergency room visits (ERV). They found positive and significant effects of NO2 for CVD events.10 Shi and colleagues focused on the low concentration of PM2.5 exposure (≤10 μg/m3 and CVD mortality); however, an effect of PM2.5 on lag 0 and lag 1 for mortality was still observed.11
In a real-world setting, individuals are not exposed to one pollutant at a time, as multiple forms of air pollution co-exist in the environment. For the papers with multi-pollutants, authors often are only able to access and investigate two-pollutant models, e.g. PM2.5 and O3, i.e. the effect of one pollutant adjusted for the other,12,13,14,15,16 while, very few have studied an additional two gaseous criteria pollutants: NO2 and SO2. These two pollutants were also related to CVD outcomes in population based studies,17,18,19,20 and possibly through the oxidative stress pathway. In this paper, we are interested in the effect of multiple pollutants on CVD ERV. Moreover, we want to test whether the effect of one pollutant exists after adjusting for other pollutants
In recent years, an increasing number of studies have used modeled data for exposure assessment in epidemiologic studies.11,21 Most of this literature utilizes aerosol optical depth (AOD) as the modeling method to address the spatiotemporal exposure of PM2.5 among the population, since AOD can only model the exposure level of particles.21 While taking into account gaseous pollutants, surface level spatiotemporal modeling is required.22,23 A paper using spatiotemporal modeling of both PM2.5 and ozone exposure revealed a higher variation of the exposure among the study population, and a stronger association between O3 and asthma hospitalization and emergency room visits in adults and children.22,23 Furthermore, spatiotemporal modeling can be adopted in the case-crossover design.
In this paper, we examined the acute association between four spatiotemporal modeled criteria air pollutants (PM2.5, O3, NO2 and SO2) and CVD emergency room visits in Allegheny County from 1999-2011 using a case-crossover study design.
METHODS
Emergency Room Visits: Data Collection
We requested ERV data information on both emergency room discharge and emergency room admissions between January 1, 1999 to December 31, 2011, inclusive, from the hospitals of the two local healthcare networks. These two healthcare networks manage the majority of the hospitals and emergency departments in allegheny county (AC). Primary discharge diagnoses based on the first 3 digit of International Classification of Diseases-9 (ICD-9) code of 390-459 were used to identify all the CVD cases. The requested dataset contained the following variables: hospital, pseudo identification number (ID), admit date, discharge date, age, sex, race, Zone Improvement Plan (ZIP) code of residence, county of residence, primary and secondary discharge diagnosis (ICD-9 code), discharge disposition (discharged or admitted to in-patient). The study population was restricted to those ≥40-years within AC. We excluded the cases of the same patient readmitted to emergency room within 30-days with the same diagnosis,24 because these readmitted cases may be due to symptoms related to the earlier event. Besides all CVD events, we also looked at the CVD subgroups. These subgroups are heart failure (HF, ICD-9: 428), ischemic heart disease (IHD, ICD-9:410-414 and 429), acute myocardial infarction (AMI, ICD-9: 410), arrhythmia (AR, ICD-9: 426-427), stroke (ICD-9: 430-438), peripheral vascular disease (PVD, ICD-9: 440- 448).25 This study is approved by the Institutional Review Board (IRB) of the University of Pittsburgh and all of the participant hospitals.
Exposure Modeling
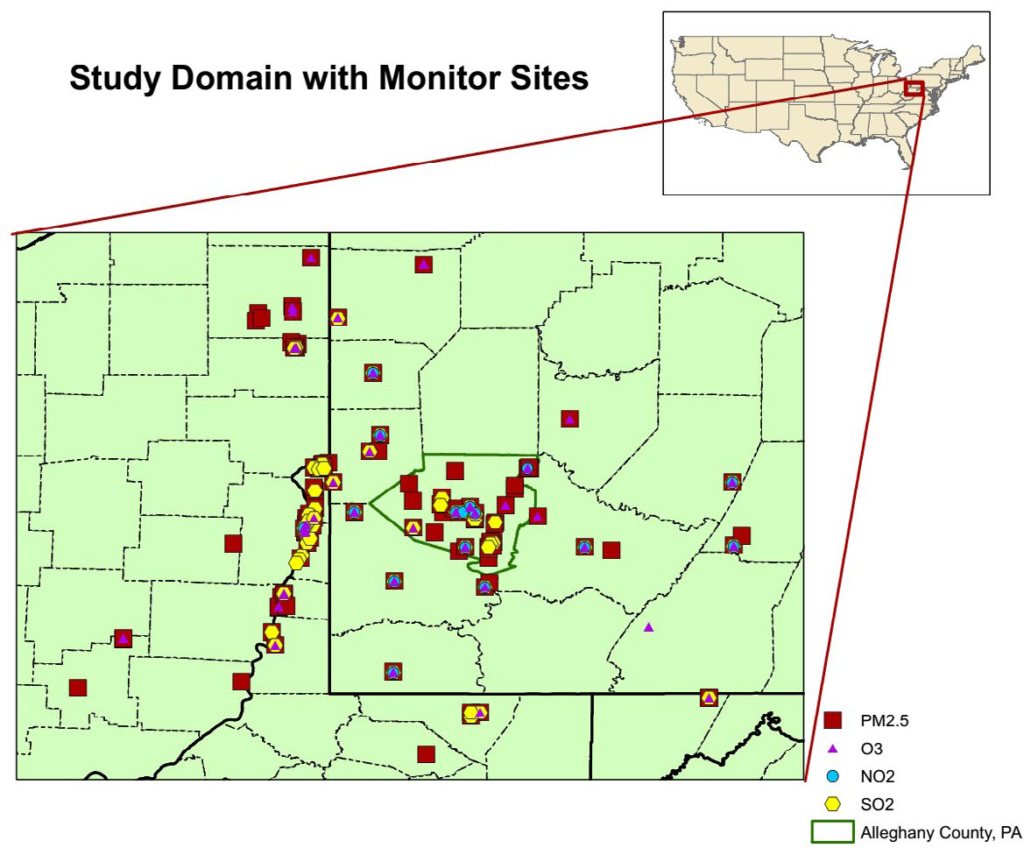
Daily concentrations of fine particulate matter (PM2.5 mass), ozone (O3 maximum 8-hour average), sulfur dioxide (SO2), and nitrogen dioxide (NO2) from monitoring networks operated by the United States Environmental Protection Agency (US EPA) and six other organizations in AC and 34 surrounding counties were used in the exposure modeling. These observations were modeled using space-time co-kriging with satellite remote sensing of aerosol optical depth and land use regression to produce daily estimates of exposure to PM2.5 for each of the 97 ZIP codes in AC. PM2.5 mass concentrations were calibrated before the exposure estimates were constructed. The details for the calibration are detailed in many studies.26 Space-time kriging and land use regression were used to construct daily exposure estimates for O3, SO2, and NO2 for each ZIP code. Daily exposure estimates by ZIP code for PM2.5 mass concentrations used an enhanced form of land use regression (LUR) and space-time co-kriging with satellite remote sensing of aerosol optical depth. Daily exposure estimates by ZIP code for O3 maximum 8 hr., SO2, NO2 concentrations used a similar approach using space-time kriging. See Figure 1 for study domain and monitor sites in southwestern Pennsylvania, Ohio and West Virginia.
Figure 1. Study Domain with Monitor Sites: South Western Pennsylvania and Surround Area Including Ohio and WV
Statistical Models
The referent days were selected as the same day of the week and ± one and two-weeks of the CVD case admitted day. Thus, there are four referent days per case. Conditional logistic regression with distributed lags of lag 0-lag 3 was applied to estimate per interquartile range (IQR) increase of the air pollutant associated with the odds ratio of the CVD ERV for all CVD and CVD subgroups.27 Because previous studies showed that short lags were related to CVD outcomes, we chose not to include additional lags in the model.25,28,29,30 The main analyses were based on using a multi-pollutant model which included all four air pollutants and were adjusted for the mean temperature. We also stratified the analyses by age 10-year age groups, sex, race, disposition, season and early (1999- 2005) and late (2006-2011) of study period. Statistical analysis system (SAS) software version 9.3 was used for the statistical analyses (SAS Institute Inc., Cary, NC, USA).
RESULTS
Over the 13-years, there were a total of 181,789 Emergency Department (ED) visits within AC that were identified (Table 1). The number of cases included 18.1% who were African American (AA), which is higher compared to the population of 12.9% of AA in AC. There were about 57.3% of cases >70-years-old and more than 30% of cases were >80-years-old.
Table 1. Study Population Characteristics by Cardiovascular Subgroups
Table 2 summarizes the spatiotemporal exposure level of pollutants by cases on the same day. The mean PM2.5 exposure was 14.2 μg/m3, with the maximum value at 57.4 μg/m3; the mean O3 exposure was 37.9 ppb, with the highest value at 137.8 ppb. The maximum values of NO2 and SO2 over the study period were relatively low. The correlations between the pollutants were low to moderate (Table 3). This indicated no significant multi-collinearity among the pollutants. Over the time period of the study, there was a long-term trend of pollutant level decrease for PM2.5 at 0.35 μg/m3 per year, NO2 at 0.36 ppb per year, and SO2 at 0.46 ppb per year, but there was no significant change of O3 exposure level over this study period.
| Table 2. Spatio-Temporal Air Pollution Estimates on the Concurrent Event Date |
|
Cases (N=181789)
|
Mean |
Standard Deviation |
Minimum |
Maximum |
IQR |
| PM2.5 (µg/m3) |
14.17 |
7.20 |
2.77 |
57.44 |
8.41
|
|
O3 (ppb)
|
37.91 |
17.67 |
-7.11 |
137.84 |
25.52 |
| NO2 (ppb) |
12.10 |
5.94 |
0.17 |
55.75 |
7.47
|
|
SO2 (ppb)
|
7.42 |
3.71 |
1.38 |
44.21 |
4.48 |
| Temperature (°C) |
11.20 |
9.86 |
-17.50 |
29.67 |
16.67
|
| Table 3. Spearman Correlation Coefficients Across Exposure Metrics at Concurrent Case Day |
|
|
PM2.5 |
O3 |
NO2 |
SO2 |
Tmean |
| PM2.5 |
1.000 |
|
|
|
|
|
O3
|
0.313 |
1.000 |
|
|
|
| NO2 |
0.442 |
-0.218 |
1.000 |
|
|
|
SO2
|
0.490 |
-0.116 |
6 0.607 |
1.000 |
|
| Tmean |
0.402 |
0.714 |
-0.195 |
-0.163 |
1.000
|
Entire Population
In the primary analyses of all visits for the total period of 1999- 2011, O3 on lag Day 2 was associated with an increase in acute myocardial infarction emergency room visits (AMI ERV). Per IQR increase of O3 exposure (25.52 ppb), there was 6.6% (95% CI: 0.8%-12.7%) increase in the odds of an AMI ERV. We also found that an IQR increase of PM2.5 on lag Day 1 was associated with a 10.7% (95% CI: 1.6% – 20.5%) increase in the odds of a PVD ERV; and, an IQR increase of NO2 on lag 0 was related to 7.6% (95% CI: 0.3%-15.5%) increase in odds of PVD ERV. Comparing early years (1999-2005) to later years (2006-2011); ozone for the early period and later period was related to increased risk of AMI, (lag 0, 1.067% (95% CI, 1.007-1.129) and in the later years, Lag 2, 1.109%, (1.01-1.21)) respectively (Figure 2).
Figure 2. Multi-Pollutant Model of Criteria Pollutants and CVD Emergency Room Visits in Allegheny County, 1999-2011
We noted that PM2.5 at lag 1 and lag 2 was related to increased risk of AMI, as well as SO2 at lag 2 among the Black patients of the ED visits (not shown). As previously stated, the data collected directly from ERV can also capture patients discharged on the same day. The proportion in this category contains a slightly higher proportion of those who were AA (22%). Among these patients, we found that with an IQR increase of SO2 on the previous day, there was a 7.9% increase (95% CI: 2.1%-14.1%) in ERV due to stroke; and with an IQR increase of PM2.5 on the previous day, there was a 21.6% increase (95% CI: 4.0%-42.2%) in the PVD ERV. The confidence intervals for these two observations were large however.
Temperature Effects
When stratified by season, (Figures 3-6) we also presented the temperature effect in each model. As this study was using a case crossover design, we cannot add in season as a spline in the overall model, and temperature varied largely by season. Therefore, we presented the effect of mean temperature only in this stratification analyses. In the spring, we found that at lag 0, per IQR, higher mean temperature was related to All CVD increased risk of ERV, (OR=1.12, 95% CI: 1.06-1.19), IHD (OR=1.15, 95% CI: 1.00-1.32) and AMI (OR=1.23, 95% CI: 1.02-1.49). In the fall, we observed a similar association between mean temperature and these outcomes with a slightly higher effect size; in addition, we also found that the same day IQR increase of temperature also contribute to 24.6% (95% CI: 6.4%-46.0%) higher stroke emergency room visit. We also noted the effect of NO2, SO2 on some outcomes in the warm period of the year, but the effect of PM2.5 was revealed in the summer and winter. The O3 was not significantly related to any of the outcomes in the summer, but in other seasons.
Figure 3. Multi-Pollutant Model of Criteria Pollutants and CVD Emergency Room Visits in the spring in Allegheny County, 1999-2011
Figure 4. Multi-Pollutant Model of Criteria Pollutants and CVD Emergency Room Visits in the Summer in Allegheny County, 1999-2011
Figure 5. Multi-Pollutant Model of Criteria Pollutants and CVD Emergency Room Visits in the Fall in Allegheny County, 1999-2011
Figure 6. Multi-Pollutant Model of Criteria Pollutants and CVD Emergency Room Visits in the Winter in Allegheny County, 1999-2011
Figure 7. Multi-Pollutant Model of Criteria Pollutants and CVD Emergency Room Visits in Allegheny County, 1999-2005
Figure 8. Multi-Pollutant Model of Criteria Pollutants and CVD Emergency Room Visits in Allegheny County, 2006-2011
Early versus Later Period of Years
During years 1999-2005, the same day exposure NO2 and O3 was significantly associated with All CVD, IHD and AMI; while during 2006-2011, an effect of NO2 and O3 on IHD and AMI was also noted, but at a longer lag, (lag 2 or lag 3) (Figures 7 and 8). We additionally found that PM2.5 at lag 1 (OR=1.21, 95% CI: 1.06-1.39) and SO2 at lag 0 (OR=1.18, 95% CI: 1.06-1.32) was related to PVD at the later period. However, the magnitude of the point estimates between the exposure and outcomes was not very much different.
DISCUSSION AND CONCLUSION
In this paper, we assessed the short-term effects of multiple pollutants (PM2.5, O3, NO2 and SO2) on emergency room visits for CVD in AC, PA over the years 1999-2011. We noted that overall, the addition of the four criteria air pollutants provided a fuller picture of their effects on various population subgroups. This may reflect differences in their exposure and or specific vulnerabilities. In the whole population, we found that O3 was related to AMI at lag 2, and PM2.5 at lag 1 and NO2 at lag 0 was related to PVD.
Similar effects were noted with both time periods reflecting an effect of ozone and the risk of AMI. Ozone had not changed over time in the Pittsburgh region. Nitrogen dioxide proved to be a significant risk factor and exposure related to an overall CVD risk of 1.02 in the early time period and PM2.5 and SO2 was related to the risk of PVD in the later time period. PM2.5 appeared to affect the black population for AMI for the total time period.
In the overall analyses, we found an effect of O3 on AMI. This effect existed among whites, and in the early study period (1999-2005), and was more profound in the late study period (2006-2011) and spring. The findings from the literature on O3 and AMI morbidity confirms our findings related to ozone and CVD morbidity. In a fourteen-city study in Spain, each 10-ppb increase of O3 exposure at lags 2-3 was related to 0.7% (95% CI: 0.3%- 1.0%) higher CVD hospitalization.31 A study based on the AMI registry in Southwest of France also established an association between O3 at lag 0 and lag 1 and AMI mortality and morbidity.32 Conversely, Wang et al33 did not observe an effect of O3 on AMI hospital admission in Alberta, Canada, with a much lower O3 level compared to the U.S. O3 is a secondary photochemical pollutant, which means the formation of O3 relied on the precursors of NOx , volatile organics, and ultraviolet strength.34 O3 is a secondary photochemical pollutant, which means the formation of O3 relied on the precursors and ultraviolet strength. O3, as well as NO2 and SO2, are oxidizing agents, so that they add oxidative stress to the body system; and therefore can harm human health.35,36 Thus, there are plausible mechanisms to connect O3 and CVD outcomes.
There are very few studies that examined the association between air pollutants and PVD. Dominici et al found that 10 μg/ m3 PM2.5 at lag 0 was related to a 2.11% 95% CI: 0.79%-3.40%) higher PVD hospitalization using Medicare claims data within a national sample of the U.S. for 1999-2002.37 The study of the same area and same time period also found a larger effect size related to PVD mortality.16 Dabass et al16 found that an increase of 10 μg/m3 PM2.5 at lag 5 contributed to 7.6% increase in (95% CI: 0.05%-15.7%) PVD mortality. On the other hand, we noted that per IQR increase of PM2.5 at lag 1 resulted in a 10.7% (95% CI: 1.6%-20.5%) increase in odds of PVD emergency room visit. The sample size for PVD is much smaller than that seen for AMI, IHD or CVD making this finding somewhat more problematic and demonstrating very large confidence limits. Unfortunately, there was no published literature trying to establish a relationship between NO2 and PVD. As an oxidative agent, NO2 can plausibly contribute to PVD events.38
When examining the association between air pollution and CVD ERV by race, we found that among white men and women, there was an association of O3 at lag 2 and increased risk of AMI, and additionally we noted that NO2 at lag 3 was related to HF and AMI; while among African American men and women, PM2.5 and SO2 contributed to AMI. The different observations among the two racial groups may indicate disparities in residential characteristics, residential locations (living close to emission sources) and or a potentially different effect by race.
In the early and late periods of the study, each of the pollutants continued to demonstrate increases in risk associated with IQR increases in exposure reflecting that there remains a linear no threshold dose of these pollutants. We did not find a significant decrease in the association of air pollution and health outcomes. This may in part be due to the fact that ozone did not decrease over time; whereas the other three pollutants had an almost 25% reduction in levels. In the early period, we found that same day O3 was related to IHD and AMI, and the same day NO2 was associated to all CVD and IHD. While in the late period, we observed that the effects of pollutants occurred at a longer lag. O3 at lag 2 was now related to AMI and the effect size was larger (10.1% vs. 6.6% at early period at lag 0); and NO2 at lag 3 was not related to IHD and AMI, and the effect sizes were similar as the early period. We also observed the effect of PM2.5 at lag 1 and SO2 at lag 0 on PVD in the late period. Our findings of the short-term exposures over the early versus later study period showed very little difference for PM2.5 for most of the CVD outcomes (Figures 7 and 8). However, we noted a longer lag at the later period than the early period. We found the same-day effect of NO2 and O3 was significantly associated with All CVD, IHD and AMI; while in the late period years 2006-2011, the effect NO2 and O3 at lag 2 or lag 3 were observed. A systematic review and meta-analysis also found a potential threshold effect at 5.8 μg/m3 in the relationship of air pollution and heart failure.39 This threshold is based on the potential linear dose-response relationship of the literatures, but there was no study conducted in the area with exposure level that low, neither in our study. There may be a threshold for PM2.5 and CVD outcomes which has yet to be observed or a linear no threshold dose may prevail.
Although we matched with weekday and hypothesized that their behavior was the same on the same weekday, we do not have any evidence to confirm it. Another limitation is the potential multiple comparisons related to this paper. A test was considered statistically significant when the p<0.05, and no adjustment was made to this significance threshold.
The strengths of our study include the use of modeled data as our exposure assessment involving both gaseous as well as particulate matter. This can show a better variation of the exposure of the participants.23 Additionally, we used a multipollutant model with distributed lags, adjusting for other pollutants, and the effects across all the selected lags. We found an association between air pollution and CVD ERV which persisted in the stratification analyses, and in the later years with lower exposure levels. This study with over 180,000 acute events over a 13-year period, stresses that these four criteria air pollutants exert significant independent effects on cardiovascular risk that are not limited to PM2.5. Gaseous pollutants, O3, NO2, and SO2, modelled at a smaller resolution as local sources of exposure exert a significant influence over Cardiovascular and other health outcomes.
Limitations should include modeling air pollution data with limited monitoring locations. An additional limitation is that the primary modeling of air pollution data was done within AC with limited monitoring locations, as noted in Figure 1.
ACKNOWLEDGEMENT
This study was funded by the Electric Power Research Institute contracts EP-P29581/C13936 and EP-P46301/C19907. The feasibility study for PARIES was funded by the U.S. Department of Energy contract DE-PS26-04NT42066. Additional funding has been provided by the Allegheny County Health Department (Pittsburgh, Pennsylvania).
CONFLICTS OF INTEREST
The authors declare that they have no conflicts of interest.


