Pulmonary Research and Respiratory Medicine

Open journal

ISSN 2377-1658

The Impact of VAP Staff Education on VAP Morbidity and Mortality in Alexandria University

Elmenshawy AM , ElbadawyTH , Abu khaber H , Hafez SF , Fayed AM and Ibrahim EH*

Emad H. Ibrahim, MD, FCCP

Chest Department, Alexandria Faculty of Medicine, Alexandria University, Alkhartom Square, Alexandria, Egypt; Tel. +201228030936; Fax: +2034873076; E-mail: chestalex@gmail.com

INTRODUCTION 

Ventilator-associated Pneumonia (VAP) is peculiar from other Hospital Acquired Infections (HAIs) in several aspects. VAP has the highest prevalence, complex pathogenesis (and therefore multiple preventive procedures) and controversies in diagnosis and treatment which hindered accurate diagnosis and optimal therapy.1,2 In addition, the high prevalence of Multidrug Resistant Pathogens(MDRP) further complicates the VAP management and magnifies the morbidity and mortality impact of VAP. Therefore prevention is the most effective treatment.1 

Several evidence based interventions proved to reduce VAP which have been incorporated into guidelines by several organizations.3,4,5,6,7 Implementing evidence-based guidelines into consistent delivered care at bedside still remains a challenge.8 Staff education programs for single procedures9,10,11 or selected bundle of several interventions significantly reduced VAP rate in several studies.1224 Furthermore, staff education and involvement was recommended in several guidelines.3,5,25

The top management support and availability of supplies were considered crucial for a successful VAP program.2,26,27,28 After the initial failure of VAP reduction in two ICUs of Alexandria Main university hospital which was attributed to deficient supplies, lack of top management support and passive education.29 In addition to repeated failure to obtain funding or top management support for the VAP program, we conducted a study with the purpose to assess the efficiency (VAP rate) and efficacy (Mechanical ventilation morbidity and mortality) of VAP staff education without top management support and full availability of supplies. 

METHODS 

Prior to the initiation of the study, the approval of the Alexandria University Ethical Committee on the general plan of the study, and the detailed patient management plan was taken. An informed consent was obtained before enrolment in the study (before completing the 48 hour period of mechanical ventilation). 

Study location: This study was carried out in ICU1 and ICU3 of Critical Care Medicine department in Alexandria University affiliated Hospital, which is a major adult urban teaching, primary and tertiary care facility with 1900 beds, serving 3 governorates. Both ICU1 and ICU3 are 15 beds; medical/surgical with approximately 1269 and 610 admissions per year respectively.

Through FOCUS PDSA cycle (which is considered the primary engine of this study), we first found an opportunity in the failure of previous study to reduce VAP rate. Second, we organized a multidisciplinary team from critical care medicine, internal medicine, pulmonology, microbiology infection control and nursing. Third, we clarified the current process through reviewing outcomes and limitation of the previous study. Fourth, we understood the causes of process variation through reviewing local VAP studies with bacterial investigation of VAP pathogenesis, and the proposed solutions in sampling, suctioning, oral hygiene, draining circuit condensate, hand hygiene and patient transport according to available resources. Fifth, we Selected the process improve mentusing quasi-experimental study using before and after prospective cohorts with process and outcome indicators and cost-effectiveness data to evaluate the efficiency and efficacy of the VAP staff education and to be re-modelled with Plan Do Study Act cycle.(Study design)

This study was performed after initial failure of passive education from September 2007 till June 200929 (involving four lectures 20 minutes each in physician lounge room, scientific meetings and limited bedside teaching for the residents) without availability of enough supplies to reduce VAP rate. The current intervention program was designed to overcome the limitations of the previous study followed by post-intervention phase which was compared to the pre-intervention phase of the previous study with collection of more patient data retrospectively for VAP risk stratification.

Study period: The conceptual framework of study consisted of pre-intervention phase: from September 2007 till May 2008, intervention phase from July 2009 till August 2012 and post-intervention phase from September 2012 till May 2013.

The intervention phase was optimized by avoiding certain limitations from the previous study via1 providing supplementary supplies donated to the hospital to decrease the gap between the required and the available (such as alcohol and suction catheters, beds for semi-seating position, and cuff pressure manometers)2, providing lectures for nurses, together with bedside teaching3, implementing regular end tracheal cuff pressure adjustment and blind mini BAL (bronchoalveolar lavage)4, utilizing interactive lectures to physicians5, carrying out a hand hygiene then a VAP campaign which included two days workshop, skill stations, group discussions, VAP folder for self education, and a concentrated bedside teaching. 

Study population: This study was conducted on all patients requiring continuous Mechanical Ventilation (MV) for more than 48 hours who were admitted to both units during the study period. Patients with VAP which was not acquired in our units or those whom were transferred to other units before weaning from the ventilator were excluded. The screening for potential participants were performed at least every 48 hours as well follows up of participants for the development of VAP and final outcome.

All patients in the pre and post-intervention phases were evaluated for baseline and VAP risk stratification data (age, gender, primary diagnosis, severity of illness by Acute Physiological  ological and Chronic Health Evaluation II “APACHE II”, history of chronic respiratory illness and Glasgow Coma Scale “GCS”).They were followed up for the development of VAP by modified American College of Chest Physicians (ACCP) criteria for diagnosis of VAP: “New and persistent (≤72 h) radiological infiltrate with two or more of the following; Fever (increase in core temperature of > 1°C and a core temperature >38.3°C or <35.5°C), leucocytosis (25% increase in circulating leukocytes from baseline and a value >10,000 cells/ml.), purulent tracheal aspirate or sputum”30 until death, discharge out of ICU or transfer to another ICU.

VAP rate per 1000 ventilator days (primary outcome),31 ventilator/Device utilization ratio (DU),31 adherence to VAP preventive practices (expressed as percentage of positive observation during the scheduled ICU visits), culture results of VAP samples obtained by Bronchoscopic Broncho-Alveolar Lavage (BAL)32 or modified blind mini-BAL (by using saline filled catheter instead of protected catheter and guiding it into desired bronchus through neck positioning then performing a lavage),33 MV days and ICU Length of Stay (LoS), and outcome (secondary outcomes) were collected in the pre and post-intervention phases.34,35 VAP rate was tracked through control charts (U chart).36 

STATISTICAL ANALYSIS OF THE DATA37

Data was fed to the computer and analyzed using IBM SPSS software package version 2038 Qualitative data was described using number and percent. Quantitative data was described using mean and standard deviation for normally distributed data while abnormally distributed data was expressed using median, minimum and maximum. Comparison between different groups regarding categorical variables was tested using Chi-square test. The distributions of quantitative variables were tested for normality using Kolmogorov-Smirnov test, Shapiro-Wilk test and D’Agstino test, also Histogram and QQ plot were used for vision test. If it revealed normal data distribution, parametric tests were applied. If the data was abnormally distributed, non-parametric tests were used. For normally distributed data, comparison between two independent populations was done using independent t-test. For abnormally distributed data, comparison between two independent populations was done using Mann Whitney test. Significance test results were quoted as two-tailed probabilities. Significance of the obtained results was judged at the 5% level.

RESULTS

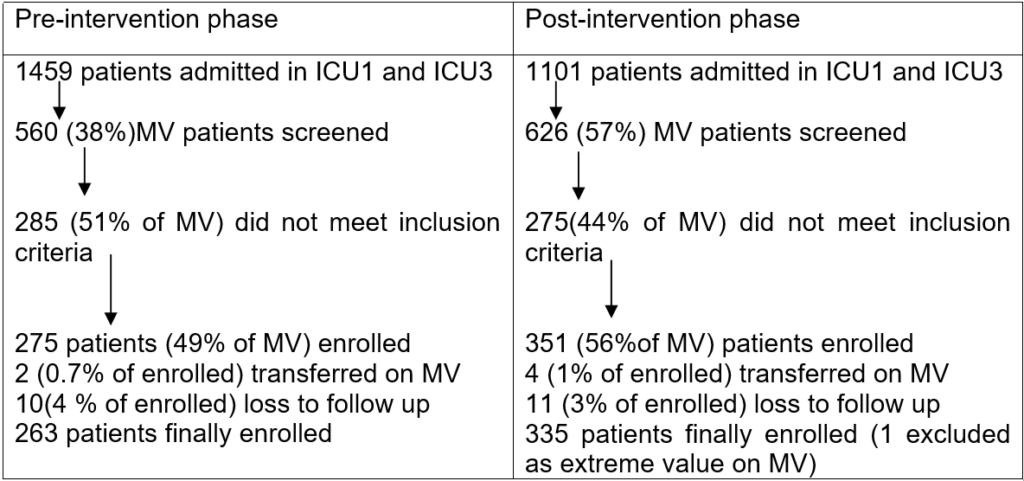
A total of 2560 patients were screened in both ICU1 and ICU3 (Figure1). After exclusion of non-MV patients, MV for =48 hours, and patients with VAP acquired in other units, 598 patients were enrolled in the pre and post-intervention phases. One patient in the ICU3 stayed on MV for 276 days till the end of the study who was excluded as an extreme value. The rates of loss to follow up were 4.4 and 4.3% in the pre and post-intervention phases respectively. The number and qualification of physicians caring for patients (5-6/unit/shift) did not differ between both groups. Similarly, the number of non-registered nurses in the morning and evening shifts did not differ between both groups (4-5/unit in the morning and 1-2 in the evening and night shift). Whereas, the number of registered nurses dropped to the half in the post-intervention phase in the evening and night shift (0-1). The residents who were involved in the formal teaching (lectures or workshop) represented 80-87% of all residents, whereas the nursing staff who was involved in workshops represented 90-95% of all nursing staff (registered and non-registered nurses) in both units.


Figure 1: Study population of the pre and post-intervention study group.

Study population of the pre and post-intervention study group


The demographic characteristics and VAP risk stratification data were similar between the pre and post-intervention groups except for the admission diagnosis which differed significantly in the post-intervention phase (decreased cardiac cases and increased surgical cases) (Table 1).


Table 1: Comparison between pre and post-intervention groups according to demographic characteristics, VAP risk stratification, primary and secondary outcomes
Pre-intervention
(n= 263)
Post-intervention
(n= 335)
p
Sex 141 (53.6%) 154 (46.0%)
Male 122 (46.4%) 181 (54.0%) #0.064
Female 48.0 (1.0 – 86.0) 52.0 (1.0 – 91.0) $0.099
Age
Diagnosis type 42 (16.0%)
Trauma 44 (16.7%) 53 (18.5%) #0.961
Cardiac 57 (21.7%) 20 (6.0%) #0.001*
Respiratory 7 (2.7%) 58 (17.3%) #0.179
Surgical 31 (11.8%) 27 (8.1%) #0.005*
Neurological 0 (19.0%) 52 (15.5%) #0.190
Medical 32 (12.2%) 91 (27.2%) #0.055
Toxicological 19.0 (4.0 – 42.0) 34 (10.1%) #0.434
APACHE score 50 (19.0%) 19.0 (7.0 – 38.0) $0.752
History of chronic respiratory illness 9.24 ± 2.94 63 (18.8%) #0.949
GCS 132 (50.2%) 9.41 ± 2.40 &0.467
Clinically defined VAP 34 (25.8%) 138 (41.2%) #0.028*
Early onset 98 (74.2) 21 (15.2%) #0.005*
Late onset 116 (44.1%) 117 (84.8) #0.554
Lab confirmed VAP 116 (34.6%) #0.018*
Number of VAP attack of MV pts 100 (75.8%)
Single (1 attack) 32 (24.2%) 107 (77.5%) #0.121
Multiple (≥2 attacks) 6.0 (2.0 – 67.0) 31 (22.5%) #0.249
MV days 9.0 (2.0 – 110.0) 6.0 (2.0 – 76.0) $0.119
ICU stay 8.0 (0.0 – 96.0) 9.0 (2.0 – 147.0) $0.185
AB days 8.0 (0.0 – 99.0) $0.089
Outcome 160 (60.8%)
Death 103 (39.2%) 183 (54.6%)
Discharge (n= 208) 152 (45.4%) #0.127
Distribution of organisms 47 (22.6%) (n= 272)
Gram positive 27 (13%) 54 (19.9%)
staphylococcus aureus 161 (77.4%) 40 (15%) #0.465
Gram negative 54 (26%) 218 (80.1%)
Klebsiellapneumonia 49 (23.6%) 47 (17%)
Pseudomonasaeroginosa 11 (2.9%) 55 (20%)
Acinetobacter  (n= 132) 74 (27%)
Mono versus poly-microbial 97 (73.5%)
VAP 35 (26.5%) (n= 151)
Mono-microbial 63 (41.7%)
Poly-microbial 88 (58.3%) #0.001*


Primary outcome: Among the 263 patients constituting the study sample in the pre-intervention phase, 132 patients fulfilled the criteria of clinically defined VAP using ACCP clinical criteria with an incidence of 50.2%. Out of the 132 clinically defined VAP cases, there were 116 laboratory (lab) confirmed VAP (4 were not sampled, 4 sterile samples, and 8 contaminated). The incidence of lab confirmed VAP was 44.1% (Table 1). The sensitivity of the lab to verify clinical diagnosis was 87.9%.

APACHE II: Acute Physiological and Chronic Health Evaluation II GCS: Glasgow Coma Scale Lab: Laboratory#: Chi square test $: Mann Whitney test &: Student t-test*: Statistically significant at p ≤ 0.05.               

Among the 335 patients constituting the study sample in the post intervention phase, 138 patients fulfilled the criteria of clinically defined VAP using ACCP clinical criteria with an incidence of 41.2%. Out of the 138 clinically defined VAP, 116 were lab confirmed VAP (4 were not sampled, 9 sterile

samples, 9 contaminated) with an incidence of 34.6% and a sensitivity of lab verification for clinical diagnosis was 84.1% (Table 1). Therefore, there was statistically significant decrease in the incidence of clinically defined VAP by 17.9 % (p = 0.028) and lab confirmed VAP by 21.5% (p= 0.018) in the post-intervention phase (Table 1). The incidence of early onset VAP decreased significantly (from 25.8 to 15.2% with p = 0.005), on the other hand the incidence of late onset, single and multiple VAP decreased insignificantly (p = 0.554, 0.121, and 0.249 respectively) in the post-intervention study group (Table 1).

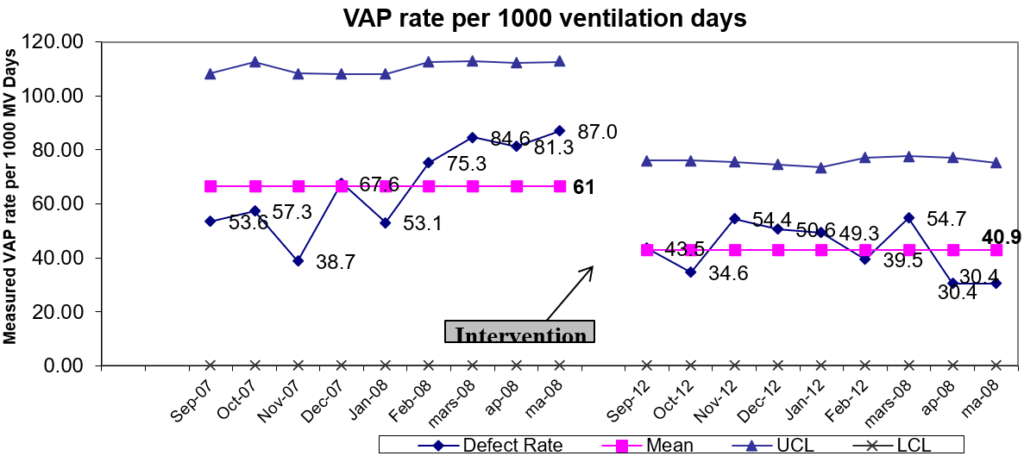
During the 9 month of the pre-intervention phase, a total of 179 VAP episodes occurred during a total of 2740 ventilator days, with a VAP rate of 66.5 per 1000 ventilator days. Following the intervention, a total of 200 VAP episodes occurred during a total of 4619 ventilator days, and VAP rate dropped significantly to 43 with a decrease of 35.3% and p value of 0.002(mean difference of 23.4 and confidence interval of 9.7-37.1),although the DU ratio increased significantly by 51.3% and p =0.001 (Figure 2 and Table 2).


Figure 2: Control chart of VAP Rate per 1000 ventilation days in the pre and post-intervention phases in ICU1 and 3

Control chart of VAP Rate per 1000 ventilation days in the pre and post-intervention phases in ICU1 and 3


Table 2: Comparison between the pre and post-intervention groups according to VAP rate and ventilation utilization ratio
Pre-intervention
(n= 9 months)
Post-intervention
(n= 9 months)
p
VAP rate pre 1000 ventilator days 66.49 ± 16.75 43.05 ± 9.79 0.002*
Ventilation utilization ratio 0.39 ± 0.04 0.59 ± 0.03 <0.001*
Data was expressed as Mean ± SD. for normally distributed data
Mean difference 95% Confidence interval of the difference
VAP rate pre 1000 ventilator days 23.44 9.73 – 37.15


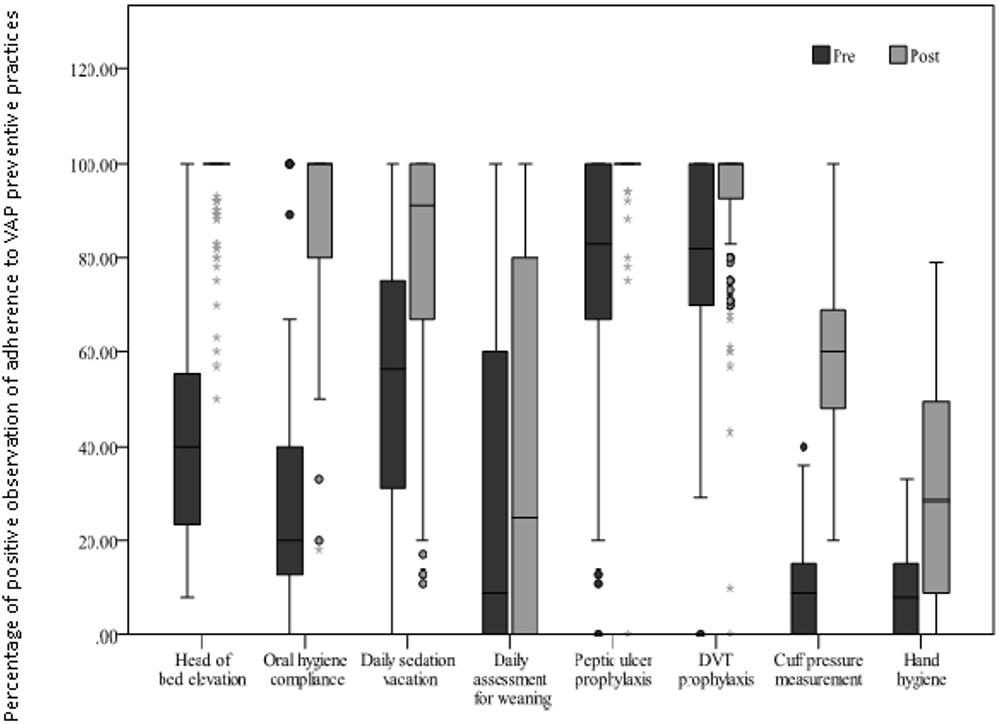
Short term outcome: There was a highly significant increase in the compliance or adherence to VAP preventive practices in the post-intervention study group as follows: head of bed elevation (from mean of 40 to 100%, p < 0.001), oral care (from mean of 20 to 100% , p < 0.001), daily sedation vacation (from mean of 56.5 to 91%, p <0.001), daily assessment of weaning (from mean of 9 to 25%, p =0.03), peptic ulcer prophylaxis (from mean of 83 to 100%, p < 0.001), DVT prophylaxis (from mean of 82 to 100%, p < 0.001), cuff pressure measurement (from mean of 9 to 60%, p <0.001), and hand hygiene (from mean of 8 to 28.5%, p =0.001) (Figure 3).


Figure 3: Comparison between the pre and post intervention phases according to compliance to VAP preventive practices (expressed as percentage of positive observation) in both ICUs

Comparison between the pre and post intervention phases according to compliance
to VAP preventive practices (expressed as percentage of positive observation) in both ICUs


Secondary Outcome: There was insignificant difference between the pre and post-intervention groups as regards duration of mechanical ventilation, ICU length of stay, antibiotic days, and mortality with p=0.119, 0.185, 0.089 and 0.127 respectively (Table 1).

MICROBIOLOGY AND SENSITIVITY PATTERN 

The distribution of organisms did not differ significantly between the pre and post-intervention groups with p value of 0.465, on the other hand the incidence of poly-microbial VAP increased significantly in the post-intervention phase with p value <0.001 (Table 1). The most common organisms in the pre-intervention phase were Klebsiella, Pseudomonas followed by Staphylococcus aureus, while in the post-intervention phase were Acinetobacter, Pseudomonas, Klebsiella followed by Staphylococcus aureus (Table 1).

The antibiotic sensitivity pattern of Klebsiella decreased significantly to impinem, piperacillin-tazobactam, cefoperazone-sulbactam, and amikacinin the post-intervention phase. Similarly, the sensitivity of Pseudomonas decreased significantly to carbapenems, β-lactam β-lactamase inhibitor combinations, third and fourth generation cephalosporins and aminoglycosides in the post-intervention phase. The Acinetobacter sensitivity decreased significantly to carbapenems, piperacillin-tazobactam and trimethoprim sulfamethoxazole in the post-intervention phase. On the other hand the Staphylococcus aureus sensitivity to vancomycin still remained the same (100%).

DISCUSSION

Several effective interventions are not always adopted despite evidence supporting their use,39,40 and this is not different when it comes to VAP prevention.41,42,43,44  Although guidelines have been used to promote consistency and reduce variation in clinical practice, the successful implementation of any guideline is by no means assured and is dependent upon many factors, including implementation strategies that need to be tailored to the local situation.8 Educational program has been utilized in VAP prevention in different aspects, mainly education for single procedures as hand hygiene,9 oral hygiene,10  sedation protocol11 or staff education for either Institute for Healthcare Improvement (IHI) bundle45 or its modification46,47 or other selected ventilator bundle which includes several interventions for VAP prevention.48,49,50 

The baseline characteristics and VAP risk stratification data (age, sex, APACHE II score, GCS, and history of chronic respiratory illness) were homogeneous between the pre and the post-intervention groups except for the admission diagnosis which differed significantly with a marked decrease of cardiac cases and increase of post-surgical cases in the post-intervention group. This was directly attributed to the diversion of most of acute coronary syndrome cases to new cardiac ICU during the intervention phase. The long lag between the pre and the post-intervention phases in the present study during which the circumstances related to admission in both units had changed, might contributed to these discrepancies in diagnosis type. However, neither the diagnosis type nor the place from which the patient was transferred (medical ward, scheduled surgical or emergency surgery) did increase risk of VAP in three studies.51,52,53 

The DU ratio (a measure of invasive practices in a unit which constitutes an extrinsic risk factor for VAP54 and a marker for severity of illness of patients31 was highly significantly increased in the post-intervention group by 51%. This might be explained by the increased number of ventilators in the post-intervention phase. In addition, the registered nurse/patient ratio dropped by 50% in the evening and night shifts in the post-intervention phase which might have reduced patient care. This might have contributed to the increased risk of VAP in the post-intervention group as a result of shortage of competent nursing staff55,56 and the highly significantly increased DU ratio. In spite of this, the VAP rate was decreased significantly by 35% as well as the clinically and laboratory confirmed VAP and the early onset VAP. On the other hand, the incidence of late onset, single and multiple VAP showed an insignificantly decrease.

Several educational program have reduced VAP rate such as Zack et al by 57%,17 Babcock et al by 38-61%,18 Apisarnthanarak et al by 59%,16 Salahuddin et al by 51%,57 Leblebicioglu et al by 46%,20 Bouadma et al by 43%,58 Blamoun et al by 100%,59 Berriel-Cass et al by 60%60 Lansford et al by 59.4%,61 and International Nosocomial Infection Control Consortium (INICC) multimodal program by 30.7-79% in several studies.21,23,62,63,64 The discrepancy between the adherence rate to VAP preventive practices and VAP rate reduction in those studies precluded any relation between the adherence to our VAP bundle and VAP rate reduction in this study. Similarly Zilberberg et al65 revealed that the major methodological flaws in the design, reporting, and results of the published studies precluded any conclusive statements about bundle compliance and VAP reduction. Similarly, Beattie et al66 failed to preclude any link between bundle compliance and development of VAP which they attributed to retrospective nature and small sample size of their study.

VAP bundle adherence, especially the overall adherence, is not the only determinants of the magnitude of VAP reductions. Other factors are important like working policy and procedures, nursing staffing, and equipment supply67 which might explain different effect in these studies. Another explanation is that these VAP prevention programs utilized different educational (and sometime quality tools) to implement different combination of VAP preventive practices, this might have explained the different effects between studies. This was also illustrated by Marra et al68 who tested the effects of different bundles introduced sequentially and had different results.

As in our earlier study that failed to reduce VAP rate, some educational studies also did not reduce VAP rate as Abbot et al14 and Bloos et al15 in spite of utilizing a variety of educational tools. Similarly Bingham et al,13 did not reduce VAP which they attributed to frequent changes in personnel and leadership in the organization. In addition Hawe et al,8 Papadimos et al,69 Bigham et al,70 and Cocanour et al,71 after failure of passive education to improve bundle compliance and VAP rate, active education significantly improved bundle compliance and VAP rate. This suggests that addition of procedural or quality tool to interactive education significantly improved program efficiency.69

Morris et al72 reduced clinically defined and laboratory confirmed VAP, while Rosenthal et al,64 Bouadma et al58 and Bigham et al70 reported a significantly decreased clinically defined VAP only. Babcock et al18 and Apisarnthanarak et al16 did not affect time of onset of VAP. It might be suggested that the high incidence of early onset of VAP in the pre-intervention phase (known to be caused by intubation related aspiration) was more feasible to correction by educational program which was higher than those studies. The success stories of VAP reduction are often reported from hospitals with high baseline VAP.73 On the other hand, Omrane et al74 found that early onset VAP significantly decreased and late onset VAP significantly increased by educational program but through incidence density (per 1000 ventilation days). To the best of our knowledge, only Bouadma et al58 reported decreased incidence of single and multiple VAP without statistical processing.

In this study, the secondary outcomes (ICU, MV and AB days and MV mortality) did not change significantly with staff education. Leblebicioglu et al,20 Rosenthal et al,62 Omrane et al74 Morris et al,72 and Bigham et al70 did not find significant difference in total MV days or hospital stay. Apisarnthanarak et al,16 Rosenthal et al,64 and Youngquist et al75 reported a significant decrease of hospital stay in the post-intervention phase. While, Abbot et al14 and Bloos et al15 reported a significant decrease of MV days despite unaffected ICU stay. Bouadma et al58 did not find difference in MV days inspite of significantly reduced ICU stay. Apisarnthanarak et al16 and Rosenthal et al64 Bouadma et al58 Bigham et al70 Marra et al68 reported no significant difference of mortality rate with educational program. Several educational programs did not evaluate outcomes other than VAP rate.17,18,20 Hawe et al8 and Morris et al72 found a trend to reduced unit and MV mortality. Morris et al72 found that antibiotic days did not change in all MV patients with VAP education.

The educational program did not affect the microbiology of organisms causing VAP (gram positive or negative) inspite of increased incidence of poly-microbial VAP. Similarly, educational program by leblebicioglu et al,20 Rosenthal et al,64 and Babcock et al did not affect the microbiology of infections, suggesting that intervention improved ventilator management and care rather than eliminating a particular nosocomial reservoir of infection.18 While Apisarnthanarak et al,16 Morris et al,72 and Bouadma et al58 reported only an outbreak of acinetobacter, decreased rates of methicillin-resistant Staphylococcus aureus acquisitions,and higher trend of staphylococcus aureus in the post-intervention study group respectively. Although the antibiotic sensitivity of most common organisms decreased to most relevant antibiotics in this study, Leblebicioglu et al20 Rosenthal et al64 reported non-significant change of antibiotic resistance to Acinetobacter, Pseudomonas and Staphylococcus aureus between the pre and post-intervention groups. This might be explained by the high rates of antibiotic abuse in our units. It might also be suggested that the reducing effect of VAP educational program on MV days and ICU stay might have been reversed by the highly significant increase of MDRP. However we did not evaluate other factors affecting MV days, ICU stay as other hospital acquired infections, ICU performance, and iatrogenic ICU complications (Table 3).


Table 3: Comparison of antibiotic sensitivity pattern of gram negative organisms implicated in VAP cases in the pre and post intervention groups in Critical Care Unit 1 and 3.
Antibiotics Klebsiella p Pseudomonas p Acinetobacter p
Pre (n= 54) Post (n= 47) Pre (n= 49) Post (n= 55) Pre (n= 3) Post (n= 74)
Meropenem 45 (83.3%) 35 (74.5%) 0.273 36 (73.5%) 14 (25.5%) <0.001* 2 (66.7%) 5 (6.8%) 0.021*
Impinem 47 (87.0%) 28 (59.6%) 0.002* 37 (75.5%) 10 (18.2%) <0.001* 3 (100.0%) 13 (17.6%) 0.008*
Tazobactam-piperacillin 48 (88.9%) 18 (38.3%) <0.001* 39 (79.6%) 17 (30.9%) <0.001* 1 (33.3%) 0 (0.0%) 0.039*
Cefoparazone-sulbactum 42 (77.8%) 7 (14.9%) <0.001* 33 (67.3%) 2 (3.6%) <0.001* 0 (0.0%) 0 (0.0%)
Cefotaxime 5 (9.3%) 2 (4.3%) 0.445 2 (4.1%) 0 (0.0%) 0.220 0 (0.0%) 0 (0.0%)
Ceftriaxone 4 (7.4%) 2 (4.3%) 0.683 3 (6.1%) 0 (0.0%) 0.101 0 (0.0%) 1 (1.4%) 1.000
Cefepim 17 (31.5%) 10 (21.3) 0.248 16 (32.7%) 6 (10.9%) 0.007* 0 (0.0%) 0 (0.0%)
Ceftazidim 7 (13.0%) 6 (12.8%) 0.976 10 (20.4%) 4 (7.3%) 0.049* 0 (0.0%) 1 (1.4%) 1.000
Amikacin 18 (33.3%) 27 (57.4%) 0.015* 20 (40.8%) 8 (14.5%) 0.003* 1 (33.3%) 2 (2.7%) 0.114
Gentamyicin 15 (27.8%) 19 (40.4%) 0.180 18 (36.7%) 6 (10.9%) 0.002* 1 (33.3%) 8 (10.8%) 0.315
TMP-SMX 8 (14.8%) 9 (19.1%) 0.561 0 (0.0%) 1 (1.8%) 1.000 2 (66.7%) 3 (4.1%) 0.010*
Levofloxacin 21 (38.9%) 21 (44.7%) 0.556 20 (40.8%) 4 (7.3%) <0.001* 1 (33.3%) 5 (6.8%) 0.219
Ciprofloxcin 14 (25.9%) 13 (27.7%) 0.844 11 (22.4%) 4 (7.3%) 0.028* 0 (0.0%) 4 (5.4%) 1.000
Ampicillin-sulbactam 3 (5.6%) 3 (6.4%) 1.000 4 (8.2%) 0 (0.0%) 0.049* 0 (0.0%) 0 (0.0%)
Amoxacillin-clavuanate 6 (11.1%) 8 (17.0%) 0.391 4 (8.2%) 0 (0.0%) 0.049* 0 (0.0%) 0 (0.0%)
Patients may have more than one organism in single VAP episode, so sum of organisms exceed the total number of VAP episodes
TMP-SMX: trimetho primsulfamethoxazol


The costs of educational program were estimated not to exceed 1000 $ (conference rooms renting, folder and booklet materials printing), and additional infection control supplies not exceeding 3000$. There were no additional salaries for personnel sharing in the education program. Assuming a continued infection rate of 66.5 (of the pre-intervention phase) during the post-intervention phase, 302 VAP episodes would be expected to occur in the 4619 ventilator days in both units. Several studies measured the cost of a single VAP episode as low as 4,947-5,800 and up to 40,000$.76,77,78 As our educational program prevented 102 episodes in post-intervention study group. The cost saving of this educational program was estimated to be at least 0.5 million dollars. Using the same calculation; Babcock et al18 prevented 98 episodes and consumed 592000$, and therefore had a cost-saving of 0.4 million dollars.

Similarly, Apisarnthanarak et al16 reported a 37-45% reduction of mean hospital (466$ vs. 293$ with P=0.001) and monthly antibiotic costs (4769$ vs. 2622$ with p=0.001) with VAP prevention program. Zilberberg et al79 concluded that the available data of VAP prevention program is still difficult for accurate cost-effectiveness studies because it relates to such important downstream outcomes of VAP prevention as the use of antibiotics and hospital length of stay.

Several reviews addressed the discrepancy between the results of VAP education as Jansson et al12 who suggested that it might be due to the wide range of definitions of VAP applied, lack of a universal method of outcome evaluation, variations in the implementation strategies (i.e. in the execution and frequency of education), ventilator bundle and various complementary interventions (reminders, feedback etc.) Moreover, the effects of extraneous factors or other potential sources of bias on their findings were inadequately reported resulting in both practical and methodological difficulty.12 

Klompas et al80 attributed the paradox of VAP intervention (either a single procedure like oral hygiene,81 semi-sitting position,82 silver coated tubes,83,84,85,86,87,88,89,90,91,92 continuous subglottic suction,1,93,94,95,96 or multiple procedures) to VAP misclassification; as it dramatically reduce VAP whereas most of them have no impact on clinical outcome (MV days, hospital stay, or mortality). As the sensitivity and specificity of microbiological diagnosis are only 50%-70% and 40%-95% respectively,97,98,99 This include non-infectious mimics of VAP with bacterial colonization which are easily affected by simple preventive measures.90 

These reviews also concluded that active implementation strategies (i.e. educational programs) were linked to significant improvements in the overall adherence to ventilator bundles and a significant decrease in clinical outcomes: incidence of VAP, duration of mechanical ventilation and hospitalization costs.12 The opportunities for decreasing VAP rates seem to be greatest when multi-module programs were applied with an average reduction of more than 40%.73 Arabi et al100 concluded that simple cost-effective measures reduced the incidence of VAP significantly in developing countries with limited healthcare resources. For this reasons, staff education and involvement was recommended in most VAP prevention guidelines as American Thoracic Society and Infectious Disease Society of America5 (I), Center of Disease and Control3 (IA), SHEA and Infectious Disease Society of America25 (A-II).

The pre-intervention VAP rate was higher than that reported in multicenter surveillance networks. The mean rates were 61 per 1000 ventilator-days in both ICUs. As compared to National Healthcare Safety Network 2008 (NHSN; formerly National Nosocomial Infections Surveillance [NNIS]) system, the 50th percentile of major teaching medical-surgical ICUs was 2.3,91 INICC 2008 mean VAP rate of medical/surgical ICU was 14.7,92 German Krankenhaus Infektions Surveillance System (KISS) surveillance system was 8.0 cases in all ICUs,93 and the French national surveillance system median rate in all ICUs was 16.4 cases per 1000 ventilator-days in 2008.94 

In the post-intervention phase, the mean VAP rates were 41 per 1000 ventilator days in both ICUs. As compared to NHSN 2011, the 50th percentile of major teaching medical-surgical ICU was 1,95 KISS mean VAP rate of 6.8.96 The large differences between our VAP rates and international VAP rate can be explained by several factors.

First: The NNIS and INICC utilized the CDC definitions while we utilized ACCP criteria for diagnosis. Skrupky et al97 when compared the CDC and ACCP definition in the same study group showed large discrepancy (1.2 vs. 8.5 per 1000 ventilator days). Similarly the difference between the NNIS, KISS rates and the rates in France might be attributed to the different criteria for defining VAP across networks.58

Second: Studies from limited-resource countries have shown that VAP rates were more than three-fold higher than those in developed countries,35,92,98,99 where lower-middle income countries had higher VAP rates than upper-middle-income countries (9.0 vs. 0.5 per 1000 MV-days).100 Thus this higher VAP rate might be related to limitations associated with socioeconomic factors: the ICU equipment is less advanced than in developed countries, medical resources are relatively insufficient, there are crowded wards, patient-nurse ratio is low, and there is low compliance with preventive measures.23 In an Egyptian respiratory ICU (in Cairo) VAP rate were 73.4 per 1000 ventilation days by CDC definition.101

Third: There were higher device associated infection rates and higher device-utilization ratios in major teaching hospitals (those hospitals with an important role in teaching programs and with clinical clerkships) than from all other hospitals.102 These differences may result from differences in case mix (including differences in numbers of patients with severe trauma or with organ transplantation), in staffing, or in procedures.102 Fourth: most of the surveillance system record the first VAP episodes or utilize the more rigid CDC criteria for diagnosis of second VAP attack by complete resolution of initial infections.103 Therefore, The high VAP rate per 1000 ventilator days in both the pre and the post-intervention phases showed the compelling need that initiated the present study and still demanding for further VAP intervention Campaigns.

The major limitation of this study was the long time lag between the pre- and post-intervention phase (51 months) which might contributed to the resistance pattern of organisms prevailing. Although, this might be partly attributed to the lack of resources for program implementation, this might have attenuated the effect of the educational program. The second limitation of this study was that the personnel collecting the compliance to VAP preventive practices were different in both phases. In addition the observation of VAP preventive practices was only done in the morning shift in both the pre and post-intervention phases of both units.

The third limitation that both pre and post-intervention phases were observational non-randomized study (ICU staff and patients were non-blinded to the intervention). This raised the possibility of factors that have occurred which accounted for these results. For these reasons, we evaluated confounding factors which are considered the risk factors for VAP and used it for risk stratification. However the double blinded randomized trial is not applicable for the educational program because of failure to segregate its effect from study and control groups and also randomization of patients to receive or not to receive good care that has been recognized by IHI and Joint Commission on Accreditation of Healthcare Organizations’ (JCAHO) may be unethical. Therefore educational program can only be applied through pre and post-intervention observation study as in all previous studies. Other factors like seasonal variation has been excluded as pre and post-intervention phase has been performed in the same months (both from September till May).

The fourth limitation; that this was a single medical center study, so the results cannot be generalized to other hospitals. However the quite similar results from several studies, suggests that this intervention might be applicable for other resource limited facilities, especially in developing countries. For this reasons, we explained our setting in details so that it can be compared to other facilities.

The fifth limitation of our study was its susceptibility to a number of biases. The clinical diagnosis by the modified ACCP criteria had limited specificity 30,104,105 and the possibility of misclassification bias cannot be ruled out. However the same observer and diagnostic criteria were used in both the pre and post-intervention study groups which might have attenuated the effect of any misclassification bias. Also the same personnel performed all patients’ data collection in the pre and post-intervention study group. Thus observer bias might have occurred, although discussion of all suspected VAP cases have been done with surveillance team. Similarly the health-care worker was informed of surveillance and might have haw-throne effect (observer effect).

In spite of the importance of top management support and full availability of supplies, VAP staff education was still effective in reducing VAP through tailoring of educational and procedural tools. As in relation to our initial failure to reduce VAP rate as with Hawe et al,8 Papadimos et al,69 Bigham et al,70 and Cocanour et al71 it is suggested that active implementation strategies and multi-module program increase the success of VAP prevention programs.

1. Lisboa T, Kollef MH, Rello J. Prevention of VAP: the whole is more than the sum of its parts. Intensive Care Med. 2008; 34(6): 985-987. doi: 10.1007/s00134-008-1101-0

2. Rebmann T, Greene LR. Preventing ventilator-associated pneumonia: An executive summary of the Association for Professionals in Infection Control and Epidemiology, Inc, Elimination Guide. Am J Infect Control. 2010; 38(8): 647-649. doi: 10.1016/j.ajic.2010.08.004

3. Tablan OC, Anderson LJ, Besser R, Bridges C, Hajjeh R. Guidelines for preventing health-care–associated pneumonia, 2003: recommendations of CDC and the Healthcare Infection Control Practices Advisory Committee. MMWR Recomm Rep. 2004; 53(RR-3): 1-36.

4. Dodek P, Keenan S, Cook D, et al. Evidence-based clinical practice guideline for the prevention of ventilator-associated pneumonia. Ann Intern Med. 2004; 141(4): 305-313. doi: 10.7326/0003-4819-141-4-200408170-00011

5. American Thoracic Society; Infectious Diseases Society of America. Guidelines for the management of adults with hospital-acquired, ventilator-associated, and healthcare-associated pneumonia. Am J Respir Crit Care Med. 2005; 171(4): 388-416. doi: 10.1164/rccm.200405-644ST

6. El Solh AA, Akinnusi ME, Wiener-Kronish JP, Lynch SV, Pineda LA, Szarpa K. Persistent infection with Pseudomonas aeruginosa in ventilator-associated pneumonia. Am J Respir Crit Care Med. 2008; 178(5): 513-519. doi: 10.1164/rccm.200802-239OC

7. Torres A, Ewig S, Lode H, Carlet J. Defining, treating and preventing hospital acquired pneumonia: European perspective. Intensive Care Med. 2009; 35(1): 9-29. doi: 10.1007/s00134-008-1336-9

8. Hawe CS, Ellis KS, Cairns CJ, Longmate A. Reduction of ventilator-associated pneumonia: active versus passive guideline implementation. Intensive Care Med. 2009; 35(7): 1180-1186. doi: 10.1007/s00134-009-1461-0

9. Rosenthal VD, Guzman S, Safdar N. Reduction in nosocomial infection with improved hand hygiene in intensive care units of a tertiary care hospital in Argentina. Am J Infect Control. 2005; 33(7): 392-327. doi: 10.1016/j.ajic.2004.08.009

10. Ross A, Crumpler J. The impact of an evidence-based practice education program on the role of oral care in the prevention of ventilator-associated pneumonia. Intensive Crit Care Nurs. 2007; 23(3): 132-136. doi: 10.1016/j.iccn.2006.11.006

11. Arabi Y, Haddad S, Hawes R, et al. Changing sedation practices in the intensive care unit–protocol implementation, multifaceted multidisciplinary approach and teamwork. Middle East J Anesthesiol. 2007; 19(2): 429-447.

12. Jansson M, Kaariainen M, Kyngas H. Effectiveness of educational programmes in preventing ventilator-associated pneumonia: a systematic review. J Hosp Infect. 2013; 84(3): 206-214. doi: 10.1016/j.jhin.2013.04.009

13. Bingham M, Ashley J, De Jong M, Swift C. Implementing a unit-level intervention to reduce the probability of ventilator-associated pneumonia. Nurs Res. 2010 ; 59(1 Suppl): S40-S47. doi: 10.1097/NNR.0b013e3181c3bffc

14. Abbott CA, Dremsa T, Stewart DW, Mark DD, Swift CC. Adoption of a ventilator-associated pneumonia clinical practice guideline. Worldviews Evid Based Nurs. 2006; 3(4): 139-152. doi: 10.1111/j.1741-6787.2006.00066.x

15. Bloos F, Muller S, Harz A, et al. Effects of staff training on the care of mechanically ventilated patients: a prospective cohort study. Br J Anaesth. 2009 ; 103(2): 232-237. doi: 10.1093/bja/aep114

16. Apisarnthanarak A, Pinitchai U, Thongphubeth K, et al. Effectiveness of an educational program to reduce ventilator-associated pneumonia in a tertiary care center in Thailand: a 4-year study. Clin Infect Dis. 2007; 45(6): 704-711. doi: 10.1086/520987

17. Zack JE, Garrison T, Trovillion E, et al. Effect of an education program aimed at reducing the occurrence of ventilator-associated pneumonia. Crit Care Med. 2002; 30(11): 2407-2412. doi: 10.1097/00003246-200211000-00001

18. Babcock HM, Zack JE, Garrison T, et al. An educational intervention to reduce ventilator-associated pneumonia in an integrated health system: a comparison of effects. Chest. 2004 ; 125(6): 2224-2221. doi: 10.1378/chest.125.6.2224

19. Salahuddina N, Zafarb A, Sukhyanic L, et al. Reducing ventilator-associated pneumonia rates through a staff education programme. Journal of Hospital Infection. 2004; 57: 223-227. doi: 10.1016/j.jhin.2004.03.002

20. Leblebicioglu H, Yalcin AN, Rosenthal VD, et al. Effectiveness of a multidimensional approach for prevention of ventilator-associated pneumonia in 11 adult intensive care units from 10 cities of Turkey: findings of the International Nosocomial Infection Control Consortium (INICC). Infection. 2013. doi: 10.1007/s15010-013-0407-1

21. Rosenthal VD, Alvarez-Moreno C, Villamil-Gomez W, et al. Effectiveness of a multidimensional approach to reduce ventilator-associated pneumonia in pediatric intensive care units of 5 developing countries: International Nosocomial Infection Control Consortium findings. Am J Infect Control. 2012; 40(6): 497-501. doi: 10.1016/j.ajic.2011.08.005

22. Guanche-Garcell H, Morales-Perez C, Rosenthal VD. Effectiveness of a multidimensional approach for the prevention of ventilator-associated pneumonia in an adult intensive care unit in Cuba: findings of the International Nosocomial Infection Control Consortium (INICC). J Infect Public Health. 2013; 6(2): 98-107. doi: 10.1097/CCM.0b013e3182657916

23. Tao L, Hu B, Rosenthal VD, Zhang Y, Gao X, He L. Impact of a multidimensional approach on ventilator-associated pneumonia rates in a hospital of Shanghai: findings of the International Nosocomial Infection Control Consortium. J Crit Care. 2012 Oct; 27(5): 440-446. doi: 10.1016/j.jcrc.2011.12.018

24. Rosenthal VD, Pawar M, Leblebicioglu H, et al. Impact of the International Nosocomial Infection Control Consortium (INICC) multidimensional hand hygiene approach over 13 years in 51 cities of 19 limited-resource countries from Latin America, Asia, the Middle East, and Europe. Infect Control Hosp Epidemiol. 2013; 34(4): 415-423. doi: 10.1086/669860

25. Coffin SE, Klompas M, Classen D, et al. Strategies to prevent ventilator-associated pneumonia in acute care hospitals. Infect Control Hosp Epidemiol. 2008; 29 (Suppl 1): S31-S40. doi: 10.1086/591062

26. Craven DE. Preventing ventilator-associated pneumonia in adults: sowing seeds of change. Chest. 2006; 130(1): 251-260 doi: 10.1378/chest.130.1.251

27. Kollef MH. The prevention of ventilator-associated pneumonia. N Engl J Med. 1999; 340: 627-634. doi: 10.1056/NEJM199902253400807

28. Yassi A, Lockhart K, Copes R, et al. Determinants of healthcare workers’ compliance with infection control procedures. Healthc Q. 2007; 10(1): 44-52. doi: 10.12927/hcq.2007.18648

29. Elmenshawy A ET, Abukhaber H, Hafez SF, Ibrahim EH, Fayed AM. Evaluation of the efficacy of a preventive program on ventilator-associated pneumonia. Alexandria Medical Journal. 2010; 52(1): 52-67.

30. Klompas M. Does this patient have ventilator-associated pneumonia? JAMA. 2007 Apr 11; 297(14): 1583-1593. doi: 10.1001/jama.297.14.1583

31. Edwards JR, Peterson KD, Andrus ML, et al. National Healthcare Safety Network (NHSN) Report, data summary for 2006, issued June 2007. Am J Infect Control. 2007; 35(5): 290-301. doi: 10.1016/j.ajic.2007.04.001

32. Jeffrey R, Jacobson GN. Bronchoalveolar lavage. In: Wang KP, Mehta AC, Turner JF, editors. Flexible bronchoscopy. 2nd ed. Massachusetts: Blackwell Science; 2004; 103-115.

33. Gauvin F, Lacroix J, Guertin MC, et al. Reproducibility of blind protected bronchoalveolar lavage in mechanically ventilated children. Am J Respir Crit Care Med. 2002; 165(12): 1618-1623. doi: 10.1164/rccm.2104129

34. Leroy O, Sanders V, Girardie P, et al. Mortality due to ventilator-associated pneumonia: impact of medical versus surgical ICU admittance status. J Crit Care. 2001 Sep; 16(3): 90-97. doi: 10.1053/jcrc.2001.28192

35. Rosenthal VD, Maki DG, Salomao R, et al. Device-associated nosocomial infections in 55 intensive care units of 8 developing countries. Ann Intern Med. 2006; 145(8): 582-591. doi: 10.7326/0003-4819-145-8-200610170-00007

36. Getting started kit: prevent ventilator-associated pneumonia: how-to guide. Crit Care Nurs Q. 2006; 29(2): 157-173. doi: 10.1097/00002727-200604000-00010

37. Leslie E, Geoffrey J, James M. Statistical analysis. Interpretation and uses of medical statistics. 4th ed: Oxford Scientific Publications; 1991; 411-416.

38. Kirkpatrick L, Feeney B, editors. A simple guide to IBM SPSS statistics for version 20.0. Student ed. Belmont, Calif: Wadsworth, Cengage Learning. 2013.

39. Budnitz D, Neuman WR. Underuse of beta-blockers following myocardial infarction. JAMA. 2001; 285(8): 1013. doi: 10.1001/jama.285.8.1013

40. Young MP, Manning HL, Wilson DL, et al. Ventilation of patients with acute lung injury and acute respiratory distress syndrome: has new evidence changed clinical practice? Crit Care Med. 2004; 32(6): 1260-1265. doi: 10.1097/01.ccm.0000127784.54727.56

41. Masterton R, Craven D, Rello J, et al. Hospital-acquired pneumonia guidelines in Europe: a review of their status and future development. J Antimicrob Chemother. 2007; 60(2): 206-213. doi: 10.1093/jac/dkm176

42. Cook D, Ricard JD, Reeve B, et al. Ventilator circuit and secretion management strategies: a Franco-Canadian survey. Crit Care Med. 2000; 28(10): 3547-3554. doi: 10.1097/00003246-200010000-00034

43. Rello J, Lorente C, Bodi M, Diaz E, Ricart M, Kollef MH. Why do physicians not follow evidence-based guidelines for preventing ventilator-associated pneumonia?: a survey based on the opinions of an international panel of intensivists. Chest. 2002; 122(2): 656-661. doi: 10.1378/chest.122.2.656

44. Ricart M, Lorente C, Diaz E, Kollef MH, Rello J. Nursing adherence with evidence-based guidelines for preventing ventilator-associated pneumonia. Crit Care Med. 2003; 31(11): 2693-2696. doi: 10.1097/01.ccm.0000094226.05094.aa

45. Resar R, Pronovost P, Haraden C, Simmonds T, Rainey T, Nolan T. Using a bundle approach to improve ventilator care processes and reduce ventilator-associated pneumonia. Jt Comm J Qual Patient Saf. 2005; 31(5): 243-248. doi: 10.1016/s1553-7250(05)31031-2

46. Crunden E, Boyce C, Woodman H, Bray B. An evaluation of the impact of the ventilator care bundle. Nurs Crit Care. 2005; 10(5): 242-246. doi: 10.1111/j.1362-1017.2005.00134.x

47. Burger CD, Resar RK. “Ventilator bundle” approach to prevention of ventilator-associated pneumonia. Mayo Clin Proc. 2006; 81(6): 849-850. doi: 10.4065/81.6.849

48. Fox MY. Toward a zero VAP rate: personal and team approaches in the ICU. Crit Care Nurs Q. 2006; 29(2): 108-114; quiz 15-6. doi: 10.1097/00002727-200604000-00002

49. Lai KK, Baker SP, Fontecchio SA. Impact of a program of intensive surveillance and interventions targeting ventilated patients in the reduction of ventilator-associated pneumonia and its cost-effectiveness. Infect Control Hosp Epidemiol. 2003; 24(11): 859-863. doi: 10.1086/502150

50. Laux L, Herbert C. Decreasing ventilator-associated pneumonia: getting on board. Crit Care Nurs Q. 2006; 29(3): 253-258. doi: 10.1097/00002727-200607000-00011

51. Apostolopoulou E, Bakakos P, Katostaras T, Gregorakos L. Incidence and risk factors for ventilator-associated pneumonia in 4 multidisciplinary intensive care units in Athens, Greece. Respir Care. 2003; 48(7): 681-688.

52. Torres A, Aznar R, Gatell JM, et al. Incidence, risk, and prognosis factors of nosocomial pneumonia in mechanically ventilated patients. Am Rev Respir Dis. 1990; 142(3): 523-528. doi: 10.1164/ajrccm/142.3.523

53. Erbay RH, Yalcin AN, Zencir M, Serin S, Atalay H. Costs and risk factors for ventilator-associated pneumonia in a Turkish university hospital’s intensive care unit: a case-control study. BMC Pulm Med. 2004; 4: 3. doi: 10.1186/1471-2466-4-3

54. Jarvis WR, Edwards JR, Culver DH, et al. Nosocomial infection rates in adult and pediatric intensive care units in the United States. National Nosocomial Infections Surveillance System. Am J Med. 1991; 91(3B): 185S-191S. doi: 10.1016/0002-9343(91)90367-7

55. Needleman J, Buerhaus P, Mattke S, Stewart M, Zelevinsky K. Nurse-staffing levels and the quality of care in hospitals. N Engl J Med. 2002; 346(22): 1715-1722. doi: 10.1056/NEJMsa012247

56. Cho SH, Ketefian S, Barkauskas VH, Smith DG. The effects of nurse staffing on adverse events, morbidity, mortality, and medical costs. Nurs Res. 2003; 52(2): 71-79. doi: 10.1097/00006199-200303000-00003

57. Salahuddin N, Zafar A, Sukhyani L, et al. Reducing ventilator-associated pneumonia rates through a staff education programme. J Hosp Infect. 2004; 57(3): 223-227. doi: 10.1016/j.jhin.2004.03.002

58. Bouadma L, Deslandes E, Lolom I, et al. Long-term impact of a multifaceted prevention program on ventilator-associated pneumonia in a medical intensive care unit. Clin Infect Dis. 2010; 51(10): 1115-1122. doi: 10.1086/656737

59. Blamoun J, Alfakir M, Rella ME, et al. Efficacy of an expanded ventilator bundle for the reduction of ventilator-associated pneumonia in the medical intensive care unit. Am J Infect Control. 2009; 37(2): 172-175. doi: 10.1016/j.ajic.2008.05.010

60. Berriel-Cass D, Adkins FW, Jones P, Fakih MG. Eliminating nosocomial infections at Ascension Health. Jt Comm J Qual Patient Saf. 2006; 32(11): 612-620. doi: 10.1016/s1553-7250(06)32079-x

61. Lansford T, Moncure M, Carlton E, et al. Efficacy of a pneumonia prevention protocol in the reduction of ventilator-associated pneumonia in trauma patients. Surg Infect (Larchmt). 2007; 8(5): 505-510. doi: 10.1089/sur.2006.001

62. Rosenthal VD, Guzman S, Crnich C. Impact of an infection control program on rates of ventilator-associated pneumonia in intensive care units in 2 Argentinean hospitals. Am J Infect Control. 2006; 34(2): 58-63. doi: 10.1016/j.ajic.2005.11.002

63. Rosenthal VD, Rodriguez-Calderon ME, Rodriguez-Ferrer M, et al. Findings of the International Nosocomial Infection Control Consortium (INICC), Part II: Impact of a multidimensional strategy to reduce ventilator-associated pneumonia in neonatal intensive care units in 10 developing countries. Infect Control Hosp Epidemiol. 2012; 33(7): 704-710. doi: 10.1086/666342

64. Rosenthal VD, Rodrigues C, Alvarez-Moreno C, et al. Effectiveness of a multidimensional approach for prevention of ventilator-associated pneumonia in adult intensive care units from 14 developing countries of four continents: findings of the International Nosocomial Infection Control Consortium. Crit Care Med. 2012; 40(12): 3121-3128. doi: 10.1097/CCM.0b013e3182657916

65. Zilberberg MD, Shorr AF, Kollef MH. Implementing quality improvements in the intensive care unit: ventilator bundle as an example. Crit Care Med. 2009; 37(1): 305-309. doi: 10.1097/CCM.0b013e3181926623

66. Beattie M, Shepherd A, Maher S, Grant J. Continual improvement in ventilator acquired pneumonia bundle compliance: a retrospective case matched review. Intensive Crit Care Nurs. 2012; 28(5): 255-262. doi: 10.1016/j.iccn.2012.01.007

67. Warren DK, Kollef MH. Prevention of hospital infection. Microbes Infect. 2005; 7(2): 268-274. doi: 10.1016/j.micinf.2004.12.003

68. Marra AR, Cal RG, Silva CV, et al. Successful prevention of ventilator-associated pneumonia in an intensive care setting. Am J Infect Control. 2009; 37(8): 619-625. doi: 10.1016/j.ajic.2009.03.009

69. Papadimos TJ, Hensley SJ, Duggan JM, et al. Implementation of the “FASTHUG” concept decreases the incidence of ventilator-associated pneumonia in a surgical intensive care unit. Patient Saf Surg. 2008; 2: 3. doi: 10.1186/1754-9493-2-3

70. Bigham MT, Amato R, Bondurrant P, et al. Ventilator-associated pneumonia in the pediatric intensive care unit: characterizing the problem and implementing a sustainable solution. J Pediatr. 2009; 154(4): 582-587 e2. doi: 10.1016/j.jpeds.2008.10.019

71. Cocanour CS, Peninger M, Domonoske BD, et al. Decreasing ventilator-associated pneumonia in a trauma ICU. J Trauma. 2006; 61(1): 122-129; discussion 9-30. doi: 10.1097/01.ta.0000223971.25845.b3

72. Morris AC, Hay AW, Swann DG, et al. Reducing ventilator-associated pneumonia in intensive care: impact of implementing a care bundle. Crit Care Med. 2011; 39(10): 2218-2224. doi: 10.1097/CCM.0b013e3182227d52

73. Gastmeier P, Geffers C. Prevention of ventilator-associated pneumonia: analysis of studies published since 2004. J Hosp Infect. 2007; 67(1): 1-8. doi: 10.1016/j.jhin.2007.06.011

74. Omrane R, Eid J, Perreault MM, et al. Impact of a protocol for prevention of ventilator-associated pneumonia. Ann Pharmacother. 2007; 41(9): 1390-1396. doi: 10.1345/aph.1h678

75. Youngquist P, Carroll M, Farber M, et al. Implementing a ventilator bundle in a community hospital. Jt Comm J Qual Patient Saf. 2007; 33(4): 219-225. doi: 10.1016/s1553-7250(07)33026-2

76. Public health focus: surveillance, prevention, and control of nosocomial infections. MMWR Morb Mortal Wkly Rep. 1992; 41(42): 783-787.

77. Jarvis WR. Selected aspects of the socioeconomic impact of nosocomial infections: morbidity, mortality, cost, and prevention. Infect Control Hosp Epidemiol. 1996; 17(8): 552-557. doi: 10.1086/647371

78. Boyce JM, Potter-Bynoe G, Dziobek L, Solomon SL. Nosocomial pneumonia in Medicare patients. Hospital costs and reimbursement patterns under the prospective payment system. Arch Intern Med. 1991; 151(6): 1109-1114. doi: 10.1001/archinte.1991.00400060053009

79. Zilberberg MD, Shorr AF. Ventilator-associated pneumonia as a model for approaching cost-effectiveness and infection prevention in the ICU. Curr Opin Infect Dis. 2011; 24(4): 385-389. doi: 10.1097/QCO.0b013e3283474914

80. Klompas M. The paradox of ventilator-associated pneumonia prevention measures. Crit Care. 2009; 13(5): 315. doi: 10.1186/cc8036

81. Chlebicki MP, Safdar N. Topical chlorhexidine for prevention of ventilator-associated pneumonia: a meta-analysis. Crit Care Med. 2007; 35(2): 595-602. doi: 10.1097/01.ccm.0000253395.70708.ac

82. Drakulovic MB, Torres A, Bauer TT, Nicolas JM, Nogue S, Ferrer M. Supine body position as a risk factor for nosocomial pneumonia in mechanically ventilated patients: a randomised trial. Lancet. 1999; 354(9193): 1851-1858. doi: 10.1016/S0140-6736(98)12251-1

83. Edwards JR, Peterson KD, Andrus ML, Dudeck MA, Pollock DA, Horan TC. National Healthcare Safety Network (NHSN) Report, data summary for 2006 through 2007, issued November 2008. Am J Infect Control. 2008; 36(9): 609-626. doi: 10.1016/j.ajic.2008.08.001

84. Rosenthal VD, Maki DG, Mehta A, et al. International Nosocomial Infection Control Consortium report, data summary for 2002-2007, issued January 2008. Am J Infect Control. 2008; 36(9): 627-637. doi: 10.1016/j.ajic.2008.03.003

85. Gastmeier P, Geffers C, Brandt C, Zuschneid I, Sohr D, Schwab F, et al. Effectiveness of a nationwide nosocomial infection surveillance system for reducing nosocomial infections. J Hosp Infect. 2006; 64(1): 16-22. doi: 10.1016/j.jhin.2006.04.017

86. (RAISIN) Rsdadiedsdin. Surveillance des infections nosocomiales en re´animation adulte. France, re´sultats 2006, 2007. [cited 2010 5 October]; Available from: http: //www.invs.sante.fr/surveillance/raisin/.

87. Dudeck MA, Horan TC, Peterson KD, et al. National Healthcare Safety Network (NHSN) Report, data summary for 2010, device-associated module. Am J Infect Control. 2011; 39(10): 798-816. doi: 10.1016/j.ajic.2011.10.001

88. Geffers C, Gastmeier P. Nosocomial infections and multidrug-resistant organisms in Germany: epidemiological data from KISS (the Hospital Infection Surveillance System). Dtsch Arztebl Int. 2011; 108(6): 87-93. doi: 10.3238/arztebl.2011.0087

89. Skrupky LP, McConnell K, Dallas J, Kollef MH. A comparison of ventilator-associated pneumonia rates as identified according to the National Healthcare Safety Network and American College of Chest Physicians criteria. Crit Care Med. 2012; 40(1): 281-284. doi: 10.1097/CCM.0b013e31822d7913

90. Rosenthal VD, Bijie H, Maki DG, et al. International Nosocomial Infection Control Consortium (INICC) report, data summary of 36 countries, for 2004-2009. Am J Infect Control. 2012; 40(5): 396-407. doi: 10.1016/j.ajic.2011.05.020

91. Rosenthal VD, Maki DG, Jamulitrat S, et al. International Nosocomial Infection Control Consortium (INICC) report, data summary for 2003-2008, issued June 2009. Am J Infect Control. 2010; 38(2): 95-104 e2. doi: 10.1016/j.ajic.2009.12.004

92. Rosenthal VD, Jarvis WR, Jamulitrat S, et al. Socioeconomic impact on device-associated infections in pediatric intensive care units of 16 limited-resource countries: international Nosocomial Infection Control Consortium findings. Pediatr Crit Care Med. 2012; 13(4): 399-406. doi: 10.1097/PCC.0b013e318238b260

93. Lacherade JC, De Jonghe B, Guezennec P, et al. Intermittent subglottic secretion drainage and ventilator-associated pneumonia: a multicenter trial. Am J Respir Crit Care Med. 2010; 182(7): 910-917. doi: 10.1164/rccm.200906-0838OC

94. Muscedere J, Rewa O, McKechnie K, Jiang X, Laporta D, Heyland DK. Subglottic secretion drainage for the prevention of ventilator-associated pneumonia: a systematic review and meta-analysis. Crit Care Med. 2011; 39(8): 1985-1991. doi: 10.1097/CCM.0b013e318218a4d9

95. Lorente L, Lecuona M, Jimenez A, Mora ML, Sierra A. Influence of an endotracheal tube with polyurethane cuff and subglottic secretion drainage on pneumonia. Am J Respir Crit Care Med. 2007; 176(11): 1079-1083. doi: 10.1164/rccm.200705-761OC

96. Valles J, Artigas A, Rello J, et al. Continuous aspiration of subglottic secretions in preventing ventilator-associated pneumonia. Ann Intern Med. 1995; 122(3): 179-186. doi: 10.7326/0003-4819-122-3-199502010-00004

97. Papazian L, Thomas P, Garbe L, et al. Bronchoscopic or blind sampling techniques for the diagnosis of ventilator-associated pneumonia. Am J Respir Crit Care Med. 1995; 152(6(1)): 1982-1991. doi: 10.1164/ajrccm.152.6.8520766

98. Fabregas N, Ewig S, Torres A, et al. Clinical diagnosis of ventilator associated pneumonia revisited: comparative validation using immediate post-mortem lung biopsies. Thorax. 1999; 54(10): 867-873. doi: 10.1136/thx.54.10.867

99. Kirtland SH, Corley DE, Winterbauer RH, et al. The diagnosis of ventilator-associated pneumonia: a comparison of histologic, microbiologic, and clinical criteria. Chest. 1997; 112(2): 445-457. doi: 10.1378/chest.112.2.445

100. Arabi Y, Al-Shirawi N, Memish Z, Anzueto A. Ventilator-associated pneumonia in adults in developing countries: a systematic review. Int J Infect Dis. 2008; 12(5): 505-512. doi: 10.1016/j.ijid.2008.02.010

101. Rasslan O, Seliem ZS, Ghazi IA, et al. Device-associated infection rates in adult and pediatric intensive care units of hospitals in Egypt. International Nosocomial Infection Control Consortium (INICC) findings. J Infect Public Health. 2012; 5(6): 394-402. doi: 10.1016/j.jiph.2012.07.002

102. Richards MJ, Edwards JR, Culver DH, Gaynes RP. Nosocomial infections in combined medical-surgical intensive care units in the United States. Infect Control Hosp Epidemiol. 2000; 21(8): 510-515. doi: 10.1086/501795

103. Horan TC, Andrus M, Dudeck MA. CDC/NHSN surveillance definition of health care-associated infection and criteria for specific types of infections in the acute care setting. Am J Infect Control. 2008; 36(5): 309-332. doi: 10.1016/j.ajic.2008.03.002

104. Ibrahim EH, Ward S, Sherman G, Kollef MH. A comparative analysis of patients with early-onset vs late-onset nosocomial pneumonia in the ICU setting. Chest. 2000; 117(5): 1434-1442. doi: 10.1378/chest.117.5.1434

105. Ibrahim EH, Tracy L, Hill C, Fraser VJ, Kollef MH. The occurrence of ventilator-associated pneumonia in a community hospital: risk factors and clinical outcomes. Chest. 2001; 120(2): 555-561. doi: 10.1378/chest.120.2.555

LATEST ARTICLES

Blood Sample from the Patient

Hypertriglyceridemia-Induced Pancreatitis: A Case Report and Literature Review

Maarten Bulterys, Melvin Willems* and Agnes Meersman

doi.

From Neck Pain to a Life-Threatening Condition: A Case Report

Floris Vandewoude* and Sören Verstraete

doi.

Chest X-ray Showed a Hazy Left Upper Lung Infiltrate

A Noteworthy Case of Myasthenic Crisis Induced by Levofloxacin

Ada Young*, Ramya Ramesh and Milind Awale

doi.

The Right Thigh Anterior Compartment was Swollen, and the Skin was Ulcerated due to the Traditional Cautery

Primary Skeletal Muscle Lymphoma: A Case Report and Literature Review

Solomon Bishaw*, Addisu Alemu and Abel Tefera

doi.

LATEST ARTICLES

Blood Sample from the Patient

Case Report

2024 Jun

Maarten Bulterys, Melvin Willems* and Agnes Meersman

Case Report

2024 Jun

Floris Vandewoude* and Sören Verstraete