INTRODUCTION
Diabetic Autonomic Neuropathy (DAN) belongs to the group of diffuse Diabetic Neuropathies (DN), it is included in peripheral secondary Autonomic Neuropathies (AN) and carries a risk of vascular complications and sudden death, it is considered the most common AN in industrialized countries.1
Characterized by Sudomotor Autonomic Dysfunction (SAD) and Cardiovascular autonomic dysfunction (CVAD), DAN is the most frequent Autonomic Dysfunction (AD) with the greatest morbidity and mortality.2
Type 2 diabetes has a latency period estimated at 4-7 years, being in this time when the gluco-lipotoxicity on nerve fibers is just a functional and reversible damage. This damage progresses as
type 2 diabetes evolves, passing through the stage of subclinical organic damage until reaching the stage of established clinical disease, where it becomes irreversible.3
Nerve conduction studies have shown the presence of AD in 10%-18% of patients with newly diagnosed type 2 diabetes and selective involvement of small sensitive somatic fibers in patients at increased risk for type 2 diabetes.4,5
These data suggest the presence of AD in stages prior to the diagnosis of type 2 diabetes, corresponding to the period of latency and increased risk for type 2 diabetes, previously known as “pre-diabetes”,6,7,8,9,10,11,12 making it essential to identify it through a screening test.
This study proposes to provide new ratings for AD, which apparently appears in type 2 diabetes and is possibly present in “pre-diabetes”.
The controversies about the fact that the AD in diabetic patient is characterized by a SAD as first lesion continue, followed by other damages such as CVAD;13,14,15,16,17,18,19,20,21 sudomotor and cardiac autonomic function have been studied in a group of patients at risk for type 2 diabetes and type 2 diabetes with short evolution, while keeping a control group.
Clinical tests for the assessment of sudomotor autonomic function include the Electrodermal response (EDR) triggered through autonomic stimulation. The phasic response is called a Skin Conductance Response (SCR), and consists of rapid changes in skin conductance level.22
The electrical skin conductance is related to the cholinergic sympathetic activity of the eccrine sweat glands; when sweat fills the pores, the corneum becomes more conductive. SAD hinders this activity, triggering a decrease in maximum glandular filling, reducing moisture of the skin and therefore its conductance level, which can be quantified by observing a value close to the null value23,24 in the SCR registry.
Its inclusion in our study is also based on the suggestion made by several authors that in individuals with Oral Glucose Intolerance (OGI), a decrease in nerve conduction is found thus presenting an added risk of distal small fiber neuropathy.6,7,8,9,10 Not to mention the association found between the OGI and the Quantitative Sudomotor Axon Reflex Test (QSART), which seems to support the theory that the OGI can affect the function of the autonomic small nerve fibers, and be the prelude of diabetic polyneuropathy11 dysfunction.
Despite EDR having been recently proposed as an indicator in the evaluation of the diabetic foot,24,25 there are few publications on SAD diagnosis in patients with type 2 diabetes using SCR;26 and no studies in subjects with increased risk for type 2 diabetes can be found in literature.
In this context, we designed a prospective study aimed to determine the prevalence and types of autonomic neuropathy in patients at different stages of the natural history of type 2 diabetes: ranging from risk categories for type 2 diabetes to recently establish.
RESEARCH DESIGN AND METHODS
It is a longitudinal, prospective and observational study designed at the beginning of 2009, carried out within the scope of the “Servicio de Medicina Interna del Hospital Clínico Universitario de Valladolid” (HCUV), with the collaboration of CARTIF´s Biomedical Engineering Division.
The ethical committee of the HCUV approved the designed experimental protocol.
Patient Selection
We included patients aged between 25 and 75 years diagnosed with type 2 diabetes of ≤8 years of evolution or its risk categories increased. Were excluded long-standing or severe complications, those who presented polyneuropathy or dysautonomia, acute heart disease, heart rhythm disorders and / or take medications that may modify.
All members expressed their approval of the study by signing the informed consent.
Criteria
The study population consists in 30 control subjects, 30 patients with increased risk for type 2 diabetes and 30 patients with type 2 diabetes ≤8 years of evolution, selected according to ADA’s 2009 diagnostic.1,27
With the exception of those patients already diagnosed with type 2 diabetes, patients underwent an Oral Glucose Tolerance Test (OGTT). The group to which each of the patients belonged was established based on its results and those from previous blood analysis.
Anthropometric Variables Studied were
Age, sex, height, weight, Body Mass Index (BMI), waist and neck perimeter.
Epidemiologic Variables
Epidermiologic variables were collected from the information provided by the participant.
Smoking:
consumption: <5 packages/year =1 (light consumption); 5-15 packages/year =2 (moderate); and >15 packages/year = 3 (serious).
Alcoholic beverages:
zero consumption = 0; 1 cup/day =1; 2 cups/day =2; and ≥3 glasses/day =3.
Physical Activity
Physical activity was determined based on daily walk at a pace that would prevent fluid talking while walking and the weekly day’s physical exercise. A person was considered to exercise if walking lasted more than 1 hour and if it was executed more than twice a week.
Clinic Variables
Hypertension: was established based on the measurements of Blood Pressure (BP) and data recorded in the clinical history. The recommendations of the 2007 guide of the European Society of hypertension and the European Society of Cardiology state that, BP ≥140/90 mm Hg must be considered hypertension. For patients with DM2, hypertension is diagnosed if BP ≥130/80 mm Hg according to the ADA in 2009.1
Dyslipidaemia: was used the criteria of The Third Report of the Expert Panel on Detection, Evaluation, and Treatment of High Blood Cholesterol in Adults (Adult Treatment Panel III) from the National Cholesterol Education Program (NCEP), to determinate the lipids plasma concentration.
Ischemic heart disease was established on the basis of data provided by patients, data found in the clinical history and through the ECG measured in this study.
Cardiovascular family history was established by the presence of a family history of hypertension, hypercholesterolemia and hypertriglyceridemia.
Biological Variables
Two analytical determinations of each of the biochemical variables of interest were requested for our study in order to obtain the mean of the recorded values. Blood and urine tests were carried out under basal conditions and performed two days prior to study entry.
Hyperinsulinemia was defined as basal levels of insulinemia ≥16 mU/L.
Insulin Resistance (IR) was quantified with the Homeostatic model assessment index (HOMA-IR): multiplying the mean basal insulinemia (mU/L) and basal glycaemia (mg/dl), divided by 405. Border value for the Spanish population was set at HOMA-IR ≥3,8.28
HbA1c: normal v <7%.
HDL-c: values were considered abnormal below 40 mg/dl in men and 50 mg/dl in women according to the American Heart Association.
Micro-albuminuria: correlation albumin/creatinine of early morning urine samples was determined. Anomalous values were considered ≥30 mg/gr.
Uric acid: anomalous values were considered above 7 mg/dl in males and 6 mg/dl in women. Homocysteinemia: anomalous values considered above 15 µmol/L.
Evaluation of Autonomic Function
Two sensors with isotonic conductive gel were placed on the fingertips of the second and third fingers of the non-dominant hand for the registration of the responses associated with distal innervation of the median nerve (SCR).24 Similarly, standard electrodes needed to capture a conventional ECG comprising six bipolar derivations and three unipolar leads (V3, V4 and V5-V6) were placed.
Once all electrodes were placed, the SCR signal was monitored until its stabilization.
A BioPac MP 150 System® with a sampling frequency of 1 kHz was used for the registration of the SCR and the ECG.
For the detection of events in the ECG, a proprietary algorithm was developed in Matlab 7®, it automatically searches for events by using a modification of the algorithm proposed by Martínez.29 This generates a log that is stored in digital format and was forwarded to CARTIF´s Biomedical Engineering Division for reading and interpretation.
After waiting twenty minutes at rest and maintaining a periodic breathing, Heart Rate (HR) was recorded and we then proceeded to the execution of the autonomic testing battery, based on DAN’s statement.30
Afterwards, the variables were analyzed and diagnosis of CAD was established if ≥2 indexes with anomalous value were found.31,32,33
The studied cardiac autonomic variables: were resting HR, deep inspiration, controlled breathing, 30/15, Valsalva maneuver, Sustained handgrip test (SHGT) and prolonged QTc indexes.30
Resting HR: the average value the HR during the last 5 minutes of the 20 that the subject remains at rest and prior to the start of the battery. It was accounted in Beats per minute (BPM): normal values: ≤90, borderline: 91-99, anomalous: ≥100.
Deep inspiration index: difference between maximum HR during deep inspiration and the minimum HR within fifteen seconds. It is a value in BPM: normal values: ≥15, borderline: 11- 14, anomalous: ≤10.
Controlled breathing rate: difference between the average of the HR during inspiration and average HR during exhalation registered during the controlled breathing maneuver. It is a value in BPM: normal values: ≥15, borderline: 11-14, anomalous: ≤10.
30/15 index: ratio between the 30th RR interval and the 15th RR 30s after standing up from rest to orthostasis. Normal values: ≥1.04, border: 1.01-1.03, anomalous: ≤1.00.
Valsalva index: ratio between the maximum RR interval registered within 45 seconds after the Valsalva maneuver and the minimum RR interval during the 15 seconds of the maneuver. Normal values: ≥1.21, border: 1.11-1.20, anomalous: ≤1.10.
SHGT index: we decided to determine the HR rather than the diastolic ABP during isometric, sustained muscle contraction; we then calculated the difference between the achieved maximum HR during this maneuver and the mean HR prior to the maneuver. We established the anomalous value as ≤12 bpm, on the basis of prior studies.34,35,36,37
Prolonged QTc interval: we proceeded to measure QT intervals during the ten minutes that the patient remained in dorsal decubitus. Martinez’s algorithm was used to measure the position of the QRS complex.29 Farina´s DWT algorithm was used for the correct measurement of the end of the T wave.38,39,40 These QT intervals were corrected using Bazett’s formula41 to get the corrected QT interval (QTc) and finally, we calculated the average QTc in miliseconds for each patient: normal between 300-440 ms in men and 300-450 ms in women, borderline: 440-470 ms in men and 450-480 ms in women, abnormal: greater than 470 ms in men and 480 ms in women.
Sudomotor Autonomic Indexes
Measurement of the SCR is associated to a specific stimulus; each response is different in each repetition of the stimulus. We used the second response to a given stimulus for having the best amplitude for the maneuver before habituation to the stimuli occurred.
The following maneuvers can be associated with a SRC: deep inspiration controlled breathing, standing to orthostasis, Valsalva maneuver and SHGT; but the measurement of the SCR associated with the standing to orthostasis had to be discarded due to the electromyographic noise generated during postural change.
Statistical Analysis
A descriptive analysis of all collected variables was made. Quantitative variables are presented with their mean and standard deviation. The qualitative variables are exposed according to the distribution of frequencies. The association between qualitative variables of the three study groups was analyzed using the Pearson’s Chi-square test. In the event the number of cells with expected value <5 would be higher than 20, Fisher’s exact test was used. The Pearson correlation coefficient was used to analyze the relationship between the SCR and the HR in various autonomic stimuli. The comparison of quantitative values was made through Student’s t-test or Mann-Whitney’s test in the case of two groups. Anova or Kruskal-Wallis H test were used when the number of groups was
greater than 2. Test applied afterwards include Fisher’s Least Significant Difference and Dunnett’s test.
P-values <0.05 have been considered as statistically significant.
Data were analyzed using SPSS version 18.0 for Windows.
RESULTS
Anthropometric Variables: See Table 1
The overall prevalence of obesity was the 30.0% of the population plus a 44.4% of overweight (74.4% with BMI 25 Kg/ m2). P-value (p=0.047) was found to be statistically significant between groups. We did not find statistical significance for the rest of the studied variables.
|
CONTROL
|
INCREASED RISK FOR TYPE 2 DIABETES |
TYPE 2 DIABETES |
|
|
Mean±SD (Minimum-maximum)
|
Mean±SD (Minimum-maximum) |
Mean±SD (Minimum-maximum) |
p-value
|
|
Age (years)
|
47.4±7.30 (31-61) |
53.7±13.2 (27-75) |
56.4±8.4 (28-67) |
0.075
|
|
Male
|
49.4±7.4 (40-61) |
48.5±13.3 (27-74) |
54.9±10.6 (28-67) |
–
|
|
Female
|
46.6±7.2 (31-58) |
59.6±10.8 (43-75) |
58.4±5.2 (47-66) |
–
|
|
Height (meters)
|
1.60±0.10 (1.50-1.90) |
1.60±0.10 (1.50-1.90) |
1.60±0.10 (1.40-1.80) |
0.992
|
|
Weight (kg)
|
76.7±27.4 (49.5-170.0) |
77.6±18.8 (46.0-128.0) |
81.1±17.7 (54.0-142.5) |
0.733
|
|
BMI (kg/m2 )
|
28.1±7.3 (21.1-53.7) |
28.3±4.9 (17.1-39.6) |
29.7±4.4 (23.8-43.8) |
0.510
|
|
Waist (cm)
|
92.2±16.8 (70.0-140.0) |
96.4±12.0 (70.0-125.5) |
99.1±11.5 (87.5-120.5) |
0.169
|
|
Neck(cm)
|
35.9±4.8 (30.5-46.0) |
35.7±3.9 (30.0 – 44.5) |
36.6±3.3 (30.5 – 43.0) |
0.785
|
|
Basal Insulin (mU/L)
|
9.7±7.8 (3.0-39.0) |
11.0±5.0 (4.0-24.0) |
12.6±9.9 (4.0-47.0) |
0.389
|
|
HOMA-IR (mU/mmol)
|
2.2±1.8 (0.6-9.2) |
2.8±1.2 (1.1-6.0) |
4.5±3.4 (1.1-13.8) |
0.014+
|
|
HbA1c (%)
|
5.7±0.3 (5.0-6.0) |
6.0 ± 0.3 (5.6 – 6.3) |
7.0 ± 1.1 (5.5 – 10.0) |
<0.001#
|
|
Total cholesterol
|
216.3±41.1 (125.0-308.0) |
215.9±36.9 (163.0-353.0) |
213.4±31.7 (150.0-289.0) |
0.946
|
|
HDL-c (mg/dl)
|
56.4±17.5 (33.0-117.0) |
50.3±13.4 (33.0-90.0) |
45.5±15.8 (6.0-70.0) |
0.033+
|
|
HDL-c male (md/dl)
|
44.3±13.8 (33.0-71.0) |
44.0±8.8 (33.0-62.0) |
39.6±15.7 (6.0-67.0) |
–
|
|
HDL-c female (mg/dl)
|
61.5±16.6 (43.0-117.0) |
57.6±14.2 (39.0-99.0) |
51.9±13.7 (25.0-70.0) |
–
|
|
LDL-c (mg/dl)
|
137.6±40.1 (61.2 – 228.8) |
139.2±31.8 (66.0-226.0) |
130.0±29.6 (73.8-201.4) |
0.548
|
|
Triglycerides (mg/dl)
|
112.1±62.4 (45.0-334.0) |
131.2±80.0 (57.0-413.0) |
192.1±155.0 (51.0-781.0) |
0.041+
|
|
µalbuminuria (mg/gr)
|
5.0±6.8 (2.9-19.6) |
3.3±0.7 (2.9-5.6) |
7.3±14.7 (2.9-447.0) |
0.158
|
|
Uric acid (mg/dl)
|
4.4±1.4 (2.1-8.0) |
5.0±0.9 (3.4-7.5) |
5.4±1.5 (2.9-8.4) |
0.028+
|
|
Homocistein (µmoles/l)
|
9.3±2.8 (5.0-18.0) |
9.6±1.5 (7.0-12.0) |
10.8±5.2 (7.0-33.0) |
0.241
|
|
n
|
% |
n |
% |
n |
% |
p-valor
|
|
BMI (kg/m2)
|
Normal |
13 |
43.3 |
7 |
23.3 |
3
|
10.0
|
0.047*
|
| |
Overweight
|
12 |
40.0 |
15 |
50.0 |
13
|
43.3
|
| |
Obesity
|
5 |
16.6 |
8 |
26.6 |
14
|
46.6
|
* : control – increased risk – type 2 diabetes + : control – type 2 diabetes # : increased risk – type 2 diabetes
Table 1: Anthropometric and biochemical variables results.
Epidemiologic and Biochemical Variables: Described in Tables 1 and 2
Statistical significance was found between the control and the type 2 diabetes group, both for the levels of HDL-c (p=0.033), triglycerides (p=0.041), uric acid (p=0.028), hypertension, hypercholesterolemia and hypertriglyceridemia (p= 0.001) as well as for ischemic heart disease (p=0.005) and the HOMA-IR (p=0.014). The highest average value of HOMA-IR corresponded to the type 2 diabetes group.
No significant differences were found for the rest of the variables studied.
|
CONTROL
|
INCREASED RISK FOR TYPE 2 DIABETES |
TYPE 2 DIABETES
|
|
|
Mean±SD (Minimum-maximum)
|
Mean±SD (Minimum-maximum)
|
Mean±SD (Minimum-maximum)
|
p-value
|
|
Snuff consumption
|
1.3±0.9 (0-3)
|
1.5±1.3 (0-3)
|
1.8±1.2 (0-3) |
0.138
|
|
Alcohol consumption (a)
|
1.7±1.0 (0-3)
|
1.7±0.9 (0-3)
|
2.4±0.6 (0-3) |
0.204
|
|
n
|
% |
n |
%
|
n
|
% |
p-value
|
|
Smoking
|
No
|
12 |
40.0 |
9 |
30
|
10
|
33.3
|
|
|
Ex-smoker
|
6 |
20.0 |
14 |
46.6
|
10
|
33.3
|
0.247
|
|
Yes
|
12 |
40.0 |
7 |
23.3
|
10
|
33.3
|
|
Drinking |
No
|
24 |
80.0 |
21 |
70.0 |
20
|
66.6
|
0.551 |
|
Ex-alcoholic
|
2 |
6.6 |
5 |
16.6 |
3 |
10.0
|
|
Yes
|
4 |
13.3 |
4 |
13.3 |
7 |
23.3
|
|
Daily walking
|
<1hour
|
14 |
46.6 |
12 |
40.0 |
10 |
33.3 |
0.492
|
|
≥1hour
|
16 |
53.3 |
18 |
60.0 |
20 |
66.6
|
|
Weekly exercise
|
<2 days
|
18 |
60.0 |
16 |
53.3 |
20 |
66.6
|
0.623
|
|
≥2 days
|
12 |
40.0 |
14 |
46.6 |
10 |
33.3
|
|
Hypertension
|
3
|
10.0 |
7 |
23.3 |
15 |
50.0 |
0.001
|
|
Hypertension family history
|
16
|
53.3 |
11 |
36.6 |
19 |
63.3 |
0.319
|
|
High cholesterol
|
8
|
26.6 |
11 |
36.6 |
23 |
76.6 |
0.001
|
|
High cholesterol family history
|
15
|
50.0 |
15 |
50.0 |
15 |
50.0 |
0.959
|
|
High triglycerides
|
3
|
10.0 |
6 |
20.0 |
15 |
50.0 |
0.001
|
|
High triglycerides family history
|
6
|
20.0 |
6 |
20.0 |
9 |
30.0 |
0.718
|
|
Ischemic cardiopathy
|
1
|
3.3 |
6 |
20.0 |
10 |
33.3 |
0.005
|
|
Ischemic cardiopathy family history
|
17
|
56.6 |
13 |
43.3 |
13 |
43.3 |
0.246
|
(a) Non consumption: 0; 1 glass wine/day: 1; 2 glasses wine/day: 2; ≥3 glasses wine/day: 3
Table 2: Clinical-epidemiologic variable results.
Cardiac Autonomic Variables: See Table 3
Resting HR: it is average value increases as the dysglicaemia progressed, significant differences were only found between the control and the type 2 diabetes group (p=0.041).
Deep inspiration index: significant differences were only found between the increased risk group and the type 2 diabetes group (p=0.047).
Controlled breathing rate: a progressive decrease of its average value was observed as dysglicaemia progressed, significant differences were only found between the control group and the type 2 diabetes group (p=0.008). Significant differences were only found between the control group and the increased risk group (p=0.023).
No significant differences were found in the rest of the indices studied.
Diagnosis of CAD: all patients who showed more than 2 indexes with anomalous were diagnosed with CAD, and therefore 30.2% of the control group; 42.9% of the increased risk groupand 58.7% of the type 2 diabetes group, with a p-value =0.064.
Sudomotor Autonomic Variables: See Table 3 SCR-HR: we found significant correlation between the sudomotor response generated by the SHGT maneuver and the variation of the HR generated by this autonomic stimulus (p=0.036) (Figure 1); not so for the remaining stimuli.
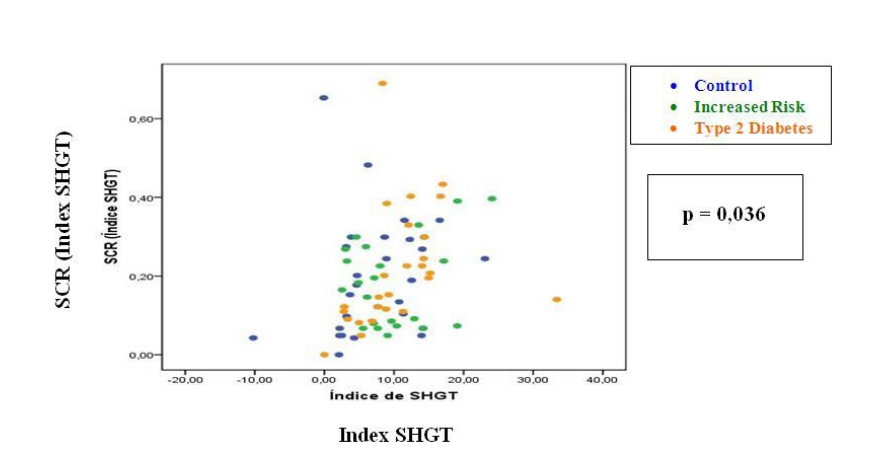
Figure 1: Relationship between the sudomotor response generated by the SHGT maneuver and the variation of the HR generated by this autonomic
stimulus.
No significant differences were found in the rest of the indices studied
|
CONTROL
|
INCREASED RISK FOR TYPE 2 DIABETES
|
TYPE 2 DIABETES |
|
|
Mean±SD (Minimummaximum)
|
Mean at 95% (inferior limitsuperior limit)
|
Mean±SD (Minimum-maximum) |
Mean at 95% (inferior limitsuperior limit) |
Mean±SD (Minimum-maximum) |
Mean at 95% (inferior limitsuperior limit) |
p-value
|
|
Resting HR (bpm)
|
69.10±11.72 (46.12-92.88) |
(64.55-73.64) |
73.95±12.72 (51.11-112.7) |
(68.31-79.59) |
77.62±12.14 (49.88-98.04) |
(72.72-82.53) |
0.041+ |
|
Deep inspiration index (bpm)
|
14.00±8.97 (1.30-35.77)
|
(10.52-17.47)
|
16.61±11.85 (4.31-54.07)
|
(11.49-21.74)
|
10.05±6.81 (1.61-25.91)
|
(7.36-12.75)
|
0.047#
|
|
Controlled breathing index (bpm)
|
23.14±8.85 (4.29-41.00)
|
(19.71-26.57) |
19.01±11.07 (3.78-48.04)
|
(14.10-23.92)
|
14.97 ± 8.12 (2.98 – 28.07)
|
(11.69-18.25)
|
0.008+
|
|
Valsalva index
|
1.54±0.37 (0.88-2.33)
|
(1.40-1.68)
|
1.56±0.35 (1.13-2.52)
|
(1.42-1.70)
|
1.50±0.46 (1.03-2.94)
|
(1.32-1.68)
|
0.874
|
|
30/15 index
|
1.20±0.16 (1.00-1.63)
|
(1.13-1.26)
|
1.17±0.15 (1.00-1.62)
|
(1.10-1.24)
|
1.15±0.07 (1.03-1.31)
|
(1.12-1.17)
|
0.315
|
|
SHGT index (bpm)
|
7.58±6.58 (10.22-23.08)
|
(5.02-10.13)
|
9.78±5.92 (2.54-24.09)
|
(7.15-12.40)
|
10.51±6.57 (0.00-33.41)
|
(7.85-13.16)
|
0.223
|
|
QTc (ms)
|
370±30 (300-420)
|
(360-390)
|
380±30 (340-460)
|
(370-400)
|
380 ± 30 (330-430)
|
(370-390)
|
0.721
|
|
SCR (deep inspiration)
|
0.30±0.25 (0.00-1.06)
|
(0.20-0.39)
|
0.24±0.17 (0.00-0.67)
|
(0.16-0.31)
|
0.30±0.24 (0.04-1.16)
|
(0.21-0.39)
|
0.533
|
|
SCR (controlled breathing)
|
0.18±0.19 (0.00-0.85)
|
(0.10-0.25)
|
0.14±0.12 (0.00-0.48)
|
(0.09-0.19)
|
0.19 ±0.13 (0.00-0.56)
|
(0.14-0.25)
|
0.475
|
|
SCR (Valsalva maneuver)
|
0.23±0.23 (0.00-1.23)
|
(0.14-0.32)
|
0.23±0.16 (0.00-0.61)
|
(0.16-0.29)
|
0.32±0.31 (0.00-1.21)
|
(0.20-0.45)
|
0.258
|
| SCR (SHGT maneuver) |
0.20±0.15 (0.00-0.65) |
(0.14-0.26) |
0.18±0.11 (0.05-0.40) |
(0.13-0.23) |
0.21±0.15 (0.00-0.69) |
(0.15-0.28) |
0.734
|
+: control – type 2 diabetes #: increased risk – type2 diabetes
Table 3: Autonomic variable results.
CONCLUSIONS
The Type 2 Diabetes and Its Neuropathic Effect
Early detection of autonomic diabetic neuropathy could help prevent serious complications and mortality associated with this condition in type 2 diabetes patients. We aimed to determine the
prevalence of Sudomotor Autonomic Dysfunction and Cardiac Autonomic Dysfunction (SAD, CAD) in the early stages of glucose metabolism alterations, ranging from risk categories for type 2 diabetes (prediabetes) to recently established type 2 diabetes.
The last adaptation on the classification of DN and data revealed by recent studies4,5,6,7,8,9,10,11,42 suggest the presence of AD in the stages prior to the diagnosis of type 2 diabetes, which justifies our study.
Given that there is still no consensus on the use of certain standardized methodology, autonomic tests battery proposed by Ewing et al. continue to be the gold standard for the diagnosis of CVAD.31 This situation led to its use as a base from which we developed the battery of autonomic tests for our study, which was completed following the guidelines provided by the ADA in its statement about for the diagnosis of CVAD.30
The Cardiac Autonomic Variables and Diagnosis of CAD
Before an autonomic stimulus, the loss of variation in the HR is considered a Pathognomonic parasympathetic CAD (PCAD) marker; while the registration of a fixed HR is an accurate indicator of PCAD and Sympathetic CAD (SCAD).32 Regarding the deep inspiration index, the statistical significance found for the average value between the type 2 diabetes and increased risk for type 2 diabetes and the average value of the type 2 diabetes group, approach to the abnormality, this reflects a trend towards PCAD. Detection of anomalous values for the 30/15 index in the increased risk group indicates the presence of PCAD.
Given the important influence that the respiratory rate has on the variation of the HR, being its modulation almost in it is entirely of vagal origin; finding anomalous values to the autonomic stimulation of controlled breathing reflect the existence of a functional compromise of the Parasympathetic Nervous System (PNS).
It is known that during SHGT there is a rise in HR, and we would expect this rise to decrease as dysglicaemia progresses, being that HR is particularly sensitive to the dysfunction of sympathetic fibers from the right stellate ganglion.34,35,36,37 Not having registered null values for the various indexes, together with results from the HR’s response during SHGT, the integrity of the responsible for the regulation of the heart’s chronotropism sympathetic component can be established, at least in the increased risk group. However, the fact finding participants with abnormal values for the Valsalva index in the type 2 diabetes group, speak in favour of a possible SCAD accompanying the PCAD already present in this group.
Finally, the absence of participants with prolonged QTc, reveals the integrity of left stellate ganglion sympathetic fibers. However, there may be fiber injury without being reflected in QTc prolongation. The heart acts as a syncytium and requires global damage of the sympathetic component to be observed in QTc.
The idea of using the controlled breathing index as a screening test is strengthened. It is the first component of the CAD related to altered dysglicaemia,33 after this first altered index, the following would be: deep inspiration, 30/15 index and Valsalva index in order to establish the diagnosis of CAD based on the presence of ≥ 2abnormal indexes, as proposed by the ADA and the AAN.31
The fact of finding control subjects with ≥ 2 abnormal indexes for CAD, speaks in favour of other reasons beyond dysglicaemia; although it could also be participants with “hidden pre-diabetes” not shown in the requested analytical determinations.
The Sudomotor Autonomic Variables and Diagnosis of SAD
For the study of the sympathetic component at peripheral level we used the SCR since the eccrine sweat glands present at the fingertips react weakly to heat but intensely to autonomic stimuli and reflect only the nerve activity of cholinergicpostganglionic sympathetic fibers of the median nerve.
Since no significant differences among the studied groups were found for any of the sudomotor responses generated by different autonomic stimuli; no presence of SAD can be detected.
The presence of a low percentage of patients in every group with null SCR values, can be related to a source of SAD outside the dysglicaemia despite the preventive measures taken before the study: hand washing, abundant use of isotonic conductive gel, recording the signal in the non-dominant hand to avoid neural mechanical wear of the nerve; without forgetting that the detection of the SCR in the chosen fingertips, reflects SAD in relation to a single nerve and distal level.
The Presence of Autonomic Dysfunction
Considering parasympathetic preganglionic fibers, results from this study demonstrate the presence of PCAD, both in the group of patients with increased risk and in the type 2 diabetes group.
Regarding the right stellate ganglion’s sympathetic fibers, abnormal results found with the Valsalva maneuver show a possible SCAD in the group of patients with short evolution type 2 diabetes; while the group of patients with increased risk we found no proof of SCAD.
Concerning left stellate ganglion sympathetic fibers, the non-presence of patients with prolonged QTc interval shows the integrity of the fibers.
SAD secondary to dysglicaemia cannot be detected in connection to cholinergic postganglionic sympathetic fibers.
Signs make us suspect that SAD is not the first autonomic injury and therefore does not precedes the PCAD already present in patients with increased risk for type2 diabetes, and followed by a possible SCAD in the group of patients with short evolution type 2 diabetes.
In conclusion, signs indicating autonomic neuropathy are already present in patients at risk for type 2 diabetes, being its prevalence higher in patients with recently diagnosed type 2 diabetes. Whereas diabetic patient’s exhibit signs suggesting parasympathetic and sympathetic involvement, prediabetic subjects show only cardiac autonomic dysfunction, which supports the notion, that parasympathetic fiber are the ones initially affected by dysglicemia-related glycolipotoxicity. These findings may contribute to optimise preventive strategies aimed to early detect autonomic neuropathy in dysglicemic patients, even before they become diabetics.
ACKNOWLEDGMENTS
This study was partially funded by the “Plan Nacional de I+D+I”, through the projects DPI 2003-09309, “Sistema de Soporte al Pronóstico y Diagnóstico de Complicaciones Microvasculares en Pacientes Diabéticos Tipo 1”, and DPI 2006- 14367, “Aplicación de Técnicas de Procesamiento de Señal para el Desarrollo de Herramientas de Diagnóstico de la Neuropatía Vegetativa”.
This work was executed in close collaboration with the Biomedical Engineering Division of CARTIF Foundation and with the “Servicio de Medicina Interna del Hospital Clínico Universitario de Valladolid”.
F.J.P.B., P.V.R.F. and E.G.S. were responsible to develop the article, M.I.F.G., J.F.A. and J.P.T. Contributed to the data analysis and writing the comments of the manuscript and M.F.M.M. the statistical analysis
CONFLICTS OF INTERESTS
The authors declare not to have potential conflicts of interest.