INTRODUCTION
To diagnose diseases of specific endocrine organs, it is common practice to measure directly hormones produced by those organs or measure the levels of the metabolites of those hormones. For example, for the diseases of the adrenal gland, the measurement of plasma cortisol (to assess the function of the zona fasciculata and diagnose either Addison’s or Cushing’s syndrome),1 and androgens such as plasma dehydroepiandrosterone or urinary 17-ketosteroids (to assess the function of the zona reticularis for diagnosis of congenital adrenal hyperplasia),2,3 or plasma renin and aldosterone (to assess the function of the zona glomerulosa and diagnose Conn’s disease)4 and plasma catecholamines and its metabolites plasma metanephrine and urinary vanillylmandelic acid (to assess the adrenal medulla and diagnose pheochromocytoma).5 Insulin, produced by the pancreatic β-cell, is the only endogenous hormone that lowers blood glucose and the deficiency of insulin or its inability to adequately perform this task leads to the development of various types of diabetes mellitus. In all cases the hallmark of the disease is hyperglycemia. For example, type 1 diabetes (T1DM) is produced by loss of pancreatic β-cell function, leading to a deficiency of insulin and hyperglycemia, the onset of which is often seen in children and young adults, and accounting for less than 5% of the incidence of diabetes.6 The development of type 2 diabetes mellitus (T2DM) takes several years and is the most common type. T2DM has now reached global epidemic status, affecting people in all socio-economic groups, all races and is found in both developed and developing countries.7,8,9 This type of diabetes is also marked by defects of the pancreatic β-cell, swinging from hyperinsulinemia, a compensatory response to increasing peripheral insulin resistance, and progressing to loss of insulin production in later years due to pancreatic β-cell exhaustion.10 It is well established that impaired pancreatic β-cell function, together with increased hepatic glucose production and increased peripheral insulin resistance, contributes to the development of T2DM.11 The definitive diagnosis of T2DM uses only the plasma glucose at 2 hours post glucose challenge6 and the care of the diabetic subject thereafter is based on predominantly blood glucose and hemoglobin A1c (HbA1c) measurements with only occasional tests of the pancreatic β-cell function during the care of the diabetic patient. The primary objective of this paper is to present some dataon the pancreatic β-cell function during T2DM in a cross-sectional study to stimulate more discussion, why pancreatic β-cell function (insulin/C-peptide) is not measured on a regular basis for the care of the T2DM patient.
RESEARCH DESIGN
Subjects
Study subjects were selected from prior studies12,13,14,15,16,17,18 in which the subjects were enrolled in response to advertisements on bulletin boards around the University campus. The experimental protocolswere approved by the Institutional Review Board of the University of Texas Health Science Center, the General Clinical Research Center and the Research and Development Committee of the South Texas Veterans Health Care System, Audie L. Murphy Division. Written, informed, voluntary consent was obtained from all subjects. Body weights for all individuals had been stable for at least 3 months prior to study. None of the participants was on a dietary or exercise program for weight reduction. Potential subjects with significant medical problems (major cardiovascular, hepatic and other endocrine disease) other than elevated total cholesterol, as determined by routine medical history, physical examination, blood and urine tests were excluded. Diabetic subjects on oral hypoglycemic drugs were included but those on insulin injections were excluded. A pregnancy test was performed in all women of reproductive potential, and pregnant or nursing women were excluded. Subjects with anemia [Hb<12 g/dL (female) or <13 g/dL (male)] were also excluded.
Study Protocol
After an overnight fast (10-12 h) all subjects were asked to come to the Frederic C. Bartter General Clinical Research Center, where they were weighed, their heights taken (for determination of body mass indices), body composition profile performed using a bioelectrical impedance method (Spectrum Lightweight II, RJL Systems Instruments), electrocardiography performed, blood pressure checked and clinical examination performed. The subjects underwent the standard 75 g oral OGTT7 to verify normal glucose tolerance and provide quantitative information about pancreatic β-cell secretion using established procedures. Three baseline blood samples (5 ml) were collected (time -30, -15 and -1-min) before the subjects ingested the glucose drink (Trutol® 75, NERL Diagnostics, East Providence, IR, USA) at time zero. Blood samples were obtained at 15 min intervals and analyzed for plasma glucose, insulin, and C-peptide. Blood samples were also collected during the basal state for the measurement of the basic metabolic panel, liver function tests and total lipid profile.
Analytical Techniques
All the clinical laboratory tests were performed in the Chemistry Laboratory of the South Texas Veterans Health Care System, Audie L. Murphy Division. LDL cholesterol was calculated using the Friedwald equation because fasting triglyceride levels did not exceed 400 mg/dL in any subject. Glycosylated hemoglobin was determined using high-pressure liquid chromatography using a Daimet Glycosylated Hemoglobin Analyzer (Bio-Rad Laboratories, Hercules, CA, USA). Plasma glucose concentrations during the OGTT was determined by the glucose oxidase method on a Beckman Glucose Analyzer II (Beckman, Fullerton, CA, USA). Plasma insulin and C-peptide levels were determined using radioimmunoassay kits (Diagnostic System Laboratories, Inc. Webster, TX, USA). At midcurve, the cross-reactivity of the C-peptide antiserum was less than 4% for proinsulin (and non-detectable with insulin) but the insulin antiserum may be as high as about 40% cross-reactivity with proinsulin. The fasting plasma levels of glucose, insulin and C-peptide were calculated as mean of the three baseline determinations whereas the fasting levels of free fatty acids were calculated as the mean of two baseline (-15 and -1 min) measurements. Intra-assay CV for plasma insulin and C-peptide were 3.5% and 2.6%, respectively, and inter-assay CV were 5.2% and 4.2%, respectively.
Statistical Analysis
A post-hoc statistical power analysis was performed for sample size estimation, using G* Power v3.1 software, based on the fasting insulin levels of 7.5±2.8 μU/mL and 30.0±7.9 μU/mL for normal glucose tolerant (NGT) and T2DM subjects, respectively. The effect size (ES) was considered to be large using Cohen’s criteria.19 With an alpha=0.05 and power=0.8, the sample size of n=8 (4 males and 4 females) for each group (total 32) for this simple between group comparison was more than adequate for the main objective of this study. Each value is the mean±SD. Student’s unpaired t-test comparison between NGT and IGT, T2DM and T2DM with pancreatic exhaustion (T2DM-PE) and between T2DM and T2DM-PE was performed using the statistical package on Microsoft Excel for Mac. Differences with p<0.05 were considered significant.
RESULTS
Subject Characteristics
Using the criteria of the American Diabetes Association (ADA) the subjects were divided into four groups based on their 2-hour plasma glucose levels after ingestion of a 75 g glucose load. The clinical characteristics of the subjects, with respect to the comprehensive metabolic panel, is presented in Table 1. Although this study was a cross-sectional one, it can be seen that in general, as an individual’s tolerance to the glucose load deteriorated from an NGT state to impaired glucose tolerant (IGT), and full-blown T2DM and eventually into a T2DM-PE state. Full-blown T2DM was defined according to the American Diabetes Association criteria: 2-hour plasma glucose levels greater than 200 mg/dL after a 75 g glucose challenge. Whereas this is typically accompanied by a compensatory hyperinsulinemia, T2DM-PE patients exhibit hyperglycemia with reduced plasma insulin/C-peptide because of progressive failure of the pancreas to respond to rising blood glucose. The BMI increased from NGT to IGT to T2DM but subjects in the T2DM-PE state had significantly decreased BMI compared to the T2DM group. In all, several biochemical parameters of the body began to deteriorate significantly (compared to the NGT group) including the lipid panel. However, there was no significant difference between the T2DM and T2M-PE subjects, with respect to HbA1c (Table 2). The pancreatic response in the 4 groups in response to the glucose load is shown Figures 1-4. In Figures 1 and 2 it can be seen that using the 2-hour plasma glucose during the OGTT is an accurate reflection of the total plasma glucose area under the curve over the course of the 2-hour glucose challenge (AUC(0→2)). Importantly, although there was no difference between plasma glucose in T2DM and T2DM-PE, there was a very significant difference in the insulin AUC(0→2), mirrored by the plasma C-peptide results (Figure 4), which reflects of the worsened state of the pancreas in T2DM-PE. One important observation was that although there was about a 300% increase in fasting insulin between the IGT and T2DM groups, the corresponding fasting C-peptide levels was only about 15%.
| Table 1. Summary of Selected Subject Clinical Characteristics in NGT, IGT, T2DM and T2DM-PE Subjects |
|
Healthy
n=8
(M/F; 4/4)
|
IGT
n=8
(M/F; 4/4) |
T2DM
n=8
(M/F; 4/4) |
T2DM-PE
n=8
(M/F; 4/4) |
Tests of Significance
|
| Age (years) |
45±11
|
54±7a |
55±4b |
51±9c,d
|
a. NGT vs IGT, p<0.031
b. NGT vs T2DM, p<0.012
c. NGT vs T2DM-PE, p=0.127
d. T2DM vs T2DM-PE, p=0.125 |
| BMI (kg/m2) |
27.2±5.4
|
33.7±5.8a |
36.6±5.6b |
30.7±4.6c,d
|
a. NGT vs IGT, p<0.018
b. NGT vs T2DM, p<0.002
c. NGT vs T2DM-PE, p=0.089
d. T2DM vs T2DM-PE, p<0.018 |
| Systolic BP (Hg mm) |
129±14
|
132±13 |
135±16 |
137±17
|
Non-significant differences |
| Diastolic BP (Hg mm) |
78±8
|
78±9 |
76±7 |
79±5
|
Non-significant differences |
| Cholesterol (mg/dL) |
156±14
|
197±31a |
185±38b |
181±26c,d
|
a. NGT vs IGT, p<0.002
b. NGT vs T2DM, p<0.029
c. NGT vs T2DM-PE, p<0.017
d. T2DM vs T2DM-PE, p=0.387 |
| Triglycerides (mg/dL) |
114±47
|
131±46a |
165±49b |
196±103c,d
|
a. NGT vs IGT, p=0.240
b. NGT vs T2DM, p<0.026
c. NGT vss T2DM-PE, p<0.030
d. T2DM vs T2DM-PE, p=0.228 |
| HDL (mg/dL) |
53±16
|
47±9a |
38±8b |
37±9c,d
|
a. NGT vs IGT, p=0.198
b. NGT vsT2DM, p<0.014
c. NGT vs T2DM-PE, p<0.019
d. T2DM vs T2DM-PE, p=0.407 |
| LDL (mg/dL) |
93±12
|
125±27a |
115±36b |
105±28c,d
|
a. NGT vs IGT, p=0.004
b. NGT vs T2DM, p<0.062
c. NGT vs T2DM-PE, p=0.138
d. T2DM vs T2DM-PE, p=0.277 |
| All values=mean±SD and unpaired t-test was used for statistical analysis and p-values<0.05 were considered significant. |
Figure 1. Plasma Glucose at 2 hours after the Ingestion of a 75 g Glucose Beverage
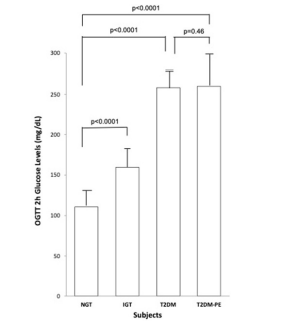
Each bar represents the mean of the subjects’ plasma glucose for NGT (n=8, 4 females and 4 males), IGT (n=8, 4 females and 4 males) and T2DM (n=8, 4 females and 4 males) and T2DM-PE (n=8, 4 females and 4 males) groups. SD bars have been
omitted for clarity. p values<0.05 were considered significant.
Figure 2. Plasma Glucose Over the Course of 2 hours after the Ingestion of a 75 g Glucose Beverage
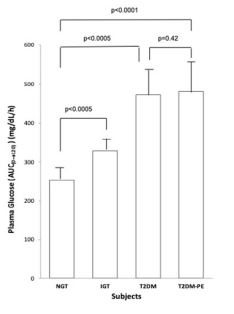
Each bar represents the mean of the subjects’ plasma glucose for NGT (n=8, 4 females and 4 males), IGT (n=8, 4 females and 4 males) and T2DM (n=8, 4 females and 4 males) and T2DM-PE (n=8, 4 females and 4 males) groups. p values<0.05 were considered significant
Figure 3. Plasma Insulin Production Over the Course of 2 hours after the Ingestion of a 75 g Glucose Beverage
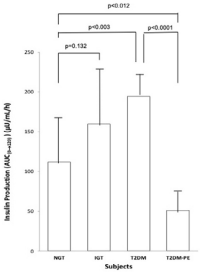
Each bar represents the mean of the subjects’ plasma glucose for NGT (n=8, 4 females and 4 males), IGT (n=8, 4 females and 4 males) and T2DM (n=8, 4 females and 4 males) and T2DM-PE (n=8, 4 females and 4 males) groups. p values<0.05 were considered significant.
Figure 4. Plasma Insulin Production Over the Course of 2 hours after the Ingestion of a 75 g Glucose Beverage
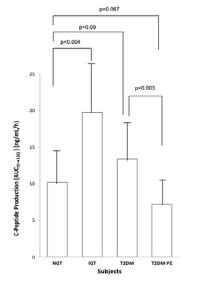
Each bar represents the mean of the subjects’ plasma glucose for NGT (n=8, 4 females and 4 males), IGT (n=8, 4 females and 4 males) and T2DM (n=8, 4 females and 4 males) and T2DM-PE (n=8, 4 females and 4 males) groups. p values<0.05 were considered significant.
DISCUSSION
In 2011, the International Federation of Diabetes (IDF)7 estimated that globally, there would be about 234 million people with diabetes by the year 2030 while the World Health Organization’s (WHO) estimate was 366 million.8 Both of these estimates appeared to be wrong as the global estimate of diabetes in 2015 was actually 415 million.9 In the United States, an estimated 30 million people of all ages had diabetes, with the risk of developing T2DM increasing with age (reaching 25.2% among those aged 65 years or older), among several other factors.20 Measurement of glucose in the laboratory, whether in plasma, serum or whole blood, is relatively easy and reliable and clearly self-monitoring blood glucose system is advantageous to patients.21 Although several factors contribute to the failure to maintain normal blood glucose (euglycemia), it can be narrowed down to primarily insulin, the only endogenous hormone that lowers blood glucose.
The results of the present study illustrate and confirm the well-known facts about the development of T2DM. In the NGT individuals, plasma glucose was at euglycemia requiring relatively less insulin secretion when challenged with 75 g of glucose, because of enhanced whole-body insulin sensitivity. As insulin resistance increased, increased pancreatic β-cell function was required to keep blood glucose under control as seen in the IGT (pre-diabetic) individuals. In the overt T2DM subjects, there was significantly increased fasting insulin and increased insulin production in response to the 75 g glucose load. This compensatory hyperinsulinemia may initially produce euglycemia and may explain the substantial number of people who are generally aware of having diabetes. In this study, one important observation was that although there was about a 300% increase in fasting insulin between the IGT and T2DM groups the corresponding fasting C-peptide levels was only about 15%. Equimolar amounts of insulin and C-peptide are expected during synthesis from proinsulin. In this study, plasma levels of fasting insulin increased by nearly 3-fold (10.8 μU/ml vs 30 μU/ml, IGT and T2DM, respectively) probably due to increased peripheral insulin resistance and compensatory hyperinsulinemia by the pancreatic β-cells. However, the fasting plasma C-peptide outputs did not appear to match the insulin production (3.4 ng/ml vs 3.9 ng/mL in IGT and T2DM groups, respectively), accounting for only about 15% increase. This disparity could be related to the pharmacokinetics of these hormones – either decreased hepatic extraction of insulin or enhanced renal excretion of C-peptide. The seminal work of Matthews and colleagues22 showed that whereas insulin levels are extracted from the peripheral circulation by the liver, the C-peptide levels were determined predominantly by renal clearance and therefore determined by kidney function.23 In fact, subsequently, attempts to predict the actual insulin levels from the C-peptide levels have been described.24 An extensive review of the clinical utility of C-peptide measurements in the care of diabetic patients has been published.25 It is well known that diabetes confers increased risk for kidney diseases. Therefore, further studies are warranted to determine the effects of diabetes medications on hepatic and renal functions as they relate specifically to the insulin and C-peptide levels.
With entrenched insulin resistance and years of excessive secretory activity the pancreatic β-cells begin to fail as seen in the T2DM-PE, exhibiting increased fasting plasma glucose, with corresponding worsening of the HbA1c and decreased fasting plasma insulin/C-peptide (Table 2) and the insulin and C-peptide AUC(0→2) (Figures 3 and 4). It has long been known that the progression of NGT to IGT and ultimately to T2DM is typically hastened by obesity26,27,28 which increases insulin resistance and is seen here by the increased BMI from NGT to T2DM. The decreased BMI in T2DM-PE compared to the overt T2DM is expected because T2DM diabetic patients are known to become leaner during pancreatic exhaustion.
| Table 2. Summary of the Fasting Glucose and Insulin/C-peptide Characteristics of the NGT, IGT, T2DM and T2DM-PE Subjects |
|
Healthy
n=8
(M/F; 4/4)
|
IGT
n=8
(M/F; 4/4) |
T2DM
n=8
(M/F; 4/4) |
T2DM-PE
n=8
(M/F; 4/4) |
Tests of Significance
|
| Fasting Plasma
Glucose (mg/dL) |
90±6
|
101±8a |
121±17b |
145±39c,d
|
a. NGT vs IGT, p<0.003
b. NGT vs T2DM, p<0.001
c. NGT vs T2DM-PE, p<0.001
d. T2DM vs T2DM-PE, p<0.024 |
| HbA1c (%) |
5.2±0.4
|
5.7±0.5a |
6.8±1.3b |
7.8±1.3c,d
|
a. NGT vs IGT, p<0.021
b. NGT vs T2DM, p<0.002
c. NGT vs T2DM-PE, p<0.001
d. T2DM vs T2DM-PE, p=0.077 |
| Fasting Plasma Insulin (µU/mL) |
7.5±2.8
|
10.8±5.2a |
30.0v7.9b |
13.9±7.8c,d
|
a. NGT vs IGT, p=0.066
b. NGT vs T2DM, p<0.001
c. NGT vs T2DM-PE, p<0.022
d. T2DM vs T2DM-PE, p<0.001 |
| Fasting Plasma
C-peptide (ng/mL) |
1.1±0.5
|
3.4±1.5a |
3.9±1.6b |
2.4±1.1c,d
|
a. NGT vs IGT, p<0.005
b. NGT vs T2DM, p<0.001
c. NGT vs T2DM-PE, p<0.001
d. T2DM vs T2DM-PE, p<0.024 |
| All values=mean±SD and unpaired t-test was used for statistical analysis and p-values<0.05 were considered significant. |
The pancreas is a very unique organ performing both endocrine and exocrine functions in the body. The endocrine function of the pancreas controls predominantly carbohydrate metabolism. The pancreatic α-cells constitutes about 30-40% of the islet population, producing glucagon that elevates blood glucose by stimulating glycogenolysis and gluconeogenesis and adipose tissue lipolysis. On the other hand, the pancreatic β-cells, constituting about 50-60% of the islet population produces insulin, the only hormone that lowers blood glucose. Insulin acts by increasing glucose uptake by the liver, skeletal muscle and adipose tissue, stimulating glycogenesis and inhibiting gluconeogenesis. Impaired insulin secretion and/or insulin action may lead to the failure to maintain glucose at euglycemia, leading to hyperglycemia.
The age of diagnosis of the disease in the T2DM group was 47±3 years which agrees with the Centers for Disease Detection and Prevention (CDC) report indicating that adults in the United States typically receive new diagnosis of the disease between 45 and 64 years of age.29 The age of diagnosis of diabetes for the T2DM-PE group was lower (41±5 years of age) because two patients were diagnosed at 34 and 35 years of age.
Although several derangements have now been shown to contribute to the pathogenesis of T2DM, the three most common are increased endogenous (hepatic) glucose production, impaired insulin secretion and impaired/decreased skeletal muscle insulin action (or decreased peripheral insulin sensitivity).11 Correspondingly, the most common targeted oral hypoglycemic agents to address these defects are biguanides (e.g. metformin) to treat the increased hepatic glucose production,30 sulfonylureas (e.g. glipizide) to treat the impaired pancreatic β-cell secretory function31 and the thiazolidinediones (TZD) (e.g. pioglitazone) to increase insulin sensitivity.32
All the subjects in the two diabetes groups were on combination therapy. In the T2DM group, 4 out of 8 subjects were taking glipizide (5 mg daily), all were on metformin (2 subjects, 250 mg daily; 4 subjects, 500 mg daily; and 2 (500 mg×2 daily) and all were on 15 mg of pioglitazone. In the T2DM-PE group, all the subjects were on glipizide (10 mg daily), perhaps a recognition of decreased pancreatic β-cell function, all of them were metformin (4 subjects, 500 mg daily; one subject, 850 mg daily and 3 subjects were prescribed, 850 mg×3 daily), and all the 8 T2DM-PE subjects were on 15 mg pioglitazone. The prescription regimens indicate that the patients were all deemed to have all three defects – impaired pancreatic β-cell function, increased hepatic glucose production and increased peripheral insulin resistance. So, even though all the diabetic patients were managed by combination oral hypoglycemic agents (sulfonylureas, biguanides and thiazolidinediones, respectively), it can be seen that the fasting blood glucose was worse in patients with T2DM-PE. The decrease in the insulin secretory function at this stage is thought to be due predominantly to an actual loss of pancreatic β-cell mass with the mechanism being increased pancreatic β-cell apoptosis and dediffrentiation.23,33,34,35
Even though several new antidiabetic drugs are now available, sulfonylureas which target the pancreas, remain the most prescribed class of drugs but metformin, the recommended first line of treatment, is the most common prescribed individual drug among the oral hypoglycemic agents.36,37 The guidelines endorsed by the American Diabetes Association for pharmacological treatment of T2DM recommends metformin as an initial treatment, in addition to lifestyle changes. If glycemic targets are not achieved in 3 months, then other drugs like the sulfonylureas and thiazolidinediones may be added. The euglycemic clamp that may be used to determine hepatic glucose production and peripheral insulin resistance is available only in a clinical research setting. On the other hand, pancreatic β-cell function for routine patient care could be assessed easily by measurement of plasma insulin and C-peptide but Quest Diagnostics, a leading laboratory testing organization in the United States and others like it, do not have plasma insulin in their test guide for “Laboratory testing for diabetes and management.” This is probably because assessment of pancreatic function is not a recommendation in the American Diabetes Association guidelines for the pharmacologic management of the diabetic patient. So, insulin and C-peptide tests are not ordered. This is unlike the case of hyperlipidemia where blood cholesterol levels are routinely ordered to guide doctors in treatment options. There must be some value to the physician and the patient knowing about the status of the pancreas.
CONCLUSION
Impaired hepatic glucose production, increased peripheral insulin and impaired pancreatic β-cell are major players that collude to produce T2DM.
The OGTT is very useful for the diagnosis of the disease because it assesses both the secretory capacity of the pancreatic β-cell as well as the tissue response to insulin (peripheral tissue insulin sensitivity). Using 2-hour plasma glucose as a diagnostic cutoff, fasting glucose or HbA1c levels are reliable for diagnosis of T2DM, but it is also clear that progressive loss of pancreatic β-cell function is inevitable in the disease progression. Just like plasma cholesterol measurements are relied upon to guide medication prescriptions in the care of patients with hyperlipidemia, we must start discussions on why measurement of insulin/C-peptide plasma levels could not be relied upon in the care of the diabetic patient. That knowledge of the pancreatic β-cell secretory capacity may be useful to the physician for choosing sulfonylureas in the case of patients approaching T2DM-PE.
ACKNOWLEDGEMENT
Nursing and dietetic care was provided by the staff of the Frederic C. Bartter General Clinical Research Center at the South Texas Veterans Health Care Systems – Audie Murphy Division. This study was a part of a larger study on Ginkgo biloba extract which was supported by funds from NIH grants M01-RR-01346 and R01-AT-00832 (National Center for Complementary and Alternative Medicine, NCCAM). My gratitude to Janet Blodgett, MD who supervised our patients and to all my research assistants and graduate students over the years.