INTRODUCTION
Football is the world’s most popular sport, practiced across the world.1 The sports universal appeal is reflected by 260 million, males, females, and children, of all abilities, who participate globally, which corresponds for more than 29 million female participants.2 Therefore, through obtaining a deeper level of understanding, coaches and players can benefit in terms of their ability to present improved information to modify tactics and training approaches.3 With female football extensively increasing in stature, the performance expectation has further risen with an increased need for specific scientific research to improve performance.4 From a physical outlook, football is an intermittent sport3,5 that requires a well-developed level of conditioning and physical fitness to be played successfully.6 Throughout the duration of a match, the completed amount of external work completed is characterised by the total distance covered by each player.7 Nonetheless, given its inability to account for the utility movements and their complete energy costs, total distance alone is not considered to be a valid measure of overall match performance. Rather, the combination of total distance completed, alongside the measurement of heart rate throughout a football match could thus provide a more representative figure.8,9
Physical Demands in Football
Physical demands within football have increased across the last decade3 with all players now participating within defensive and offensive phases; this has created multifunctional footballers, usable within multiple positions.10 Physical individual variables have been observed within playing positions in all competitive levels of football.11,12 Numerous studies have compared playing position, presenting a clear link between playing position and physical capacity both aerobically and anaerobically.13 Being an intermittent sport,3 the aerobic system is heavily taxed with peak heart rates of 85% HRmax and 98% HRmax. 10 However, oxygen kinetics undergo changes throughout a football match due to the 150-250 anaerobic short intense bouts performed, indicating a high anaerobic energy turnover.14,15 The benefits of efficient oxygen kinetics to subsequently benefit footballer’s performance due to delaying fatigue and improving recovery, due to the characteristics of football, players have to attain physical qualities including high-levels of aerobic and anaerobic endurance.14,16 However, Hoff and Helgerud17 stated that football players do not excel in one single physical component.14,16 Shalfawi et al18 affirms that the ability to sustain aerobic and anaerobic endurance further to strength, power and agility for the match, particularly in the second half, are vital to aid physical performance and determine the match outcome.
Positional Variations in External Workload
Studies show the differences in external workload throughout a match.19 The energy expenditure in performance is directly linked to the mechanical external work output. Conflicting research debates the total distance travelled throughout a match; the concluded distance players cover is 8-12 km, with distances at elite levels reaching 14 km.16,20 Collective studies, conclude midfielders performing the largest total distance in comparison to other playing positions.3,10 External midfielders previously recorded distances covering 11990+776 m whilst central midfielders recorded distances of 12027+625 m throughout the duration of a 90-minute match.14 As a result, centre backs (10627+893 m), external defenders (11410+708 m) and forwards (11254+894 m) display significantly lower overall distances covered.14 Whereas, external defenders (402+165 m), external midfielders (446+161 m) and forwards (404+140 m) have presented a noticeable difference in total sprinting distance during the duration of a game.14,19 Central midfielders only recorded total sprinting distances of 248±116 m with centre backs presenting an even lower total sprinting distance (215±100 m).14 The study by Di Salvo et al21 supports centre backs low overall distances covered both anaerobically and aerobically resulting in their lower physical capacity and important tactical role.
Midfielders, through covering the largest distances, are unable to work at high intensities and therefore sprint for the same duration as other positions. Covering a larger distance results in working at lower intensities with less opportunity for rest due to midfielder’s HR rarely falling below 65% of HRmax. 14 Therefore, the working muscles have a continuous demand for oxygen prohibiting anaerobic, high intensity sprinting. External defenders and forwards have further rest opportunities, allowing higher intensities to be met on numerous occasions, thus resulting in larger total sprinting distances.
Positional Variables Affecting External Workload
Total external work completed throughout a game has been found to vary according to a variety of factors which dictate work rate profiles and energy expenditure.14 Firstly, a player’s VO2max can influence the distance performed; a higher physical capacity displays a positive correlation to enable further distance to be completed due to positional and tactical roles.14 The variation between VO2max and positions influences the ability to cover greater distances at higher intensities; this is further reflected through the increased VO2max values consistently obtained by midfielders, alongside overall largest distances travelled.14 Secondary factors affecting external workload include the style of play and team formation.20,22 The evolution concerning style of play within professional football has been suggested by Di Mascio and Bradley,14 whom produced conclusions which demonstrate an increased distance covered by contemporary English Premier League players (11 km) compared to those in the original First Division (8.2 km) observed by Reilly and Thomas.23 The increase in 2.8 km supports the physical demands of football increasing with every position involved in defensive and offensive phases across a match.3,10 Tierney et al22 stated that there are noticeable differences in the positional demands across a series of formations. Jozak et al24 claimed that midfielders will always cover the largest total distance in any formation, due to being the direct link between the defensive and offensive part of the whole team.
Heart Rate of Footballers
Heart rate (HR) is a leading tool guiding the intensity level of exercise and determining physical demands.9,25 The intensity level is expressed as a percentage of maximal heart rate (HRmax) due to the large variations that occur throughout 90-minutes within a match. Changes to the modern game3 has led researchers into developing specific aerobic conditioning concepts for players.26 Hoff et al27 stated that pure running is suitable for players to reach maximum oxygen consumption. However, simply running is not suitable for the development of football specific aerobic capacity, which is more dependent upon aerobic peripheral, rather than central adaptation.26,28 Within football, it is documented that the maximum benefits are achieved when the conditioning stimuli coincide with specific competitive demands.26,29
Heart Rate Intensity in Football
In football, athletes perform different types of physical movements ranging at a series of intensities.1,8 Santos et al1 claimed that 80- 90% of football spent within a low to moderate intensity zone with 10-20% spent completing high intensity activities. These findings do not match previous research by Jozaket al24 whom presented 30% of overall football activities to be spent at a high intensity. In total, the average myocardium reaction throughout the duration of a 90-minute match is 80-90% of the HRmax. 20,30 Coelho et al30 compared player positions based on intensity within football matches. The researchers concluded that midfielders spent the majority of a 90-minute football match at 85-90% HRmax, thus suggesting higher aerobic requirements then defenders and forwards. As a result, Coelho et al30 suggested a higher requirement of aerobic activities within midfielders physical training to assist with recovery and consequently, their performance.
Fatigue of Footballers
Fatigue has become a high profile topic in intermittent team sports.31 Waldron and Highton31 discussed the likelihood that performers whom inversely have an increase in overall work performed, must reflect recovery either partially or fully, overall displaying temporary fatigue. The phrase refers to a period of reduced intensity, which occurs directly after the most intense period which can occur through possession or the match score.31 Therefore, if players are in possession of the ball, their intensity of play is reduced and external workload reduced, this period of recovery overcomes temporary fatigue. Acute fatigue, which is seen within footballers, occurs as a result of both peripheral and central factors.31 The immediate peripheral assumption to fatigue isassumed to be due to blood lactate accumulation with a reduction in pH.31 Waldron and Highton31 report blood lactate concentrations samples during and after football matches to vary between 7-9 mmo1-1. The findings reveal that team sports players tolerate some degree of lactate accumulation; however, blood lactate accumulations do not appear to increase across the course of the matches.31 Furthermore, whilst a decrease in pH has been reported after the most intense period within a match, a poor correlation has been connected to decrements in sprinting performance.31 Overall, the evidence therefore concludes that other factors must contribute towards the reduction in work within football matches and other intermittent sports.
Football matches last 90-minutes, indicating that muscle glycogen is the primary source for ATP synthesis; however, glycogen stores are limited and depleted quickly.32 Kenney et al32 stated that since the muscle biopsy technique was introduced, studies show a clear correlation between muscle glycogen depletion and fatigue during prolonged activity. Football is an intermittent sport3 with over 1000 high intensity actions,10,20 therefore the working muscles constantly rely on a supply of glycogen to meet high energy demands.32 As the match prolongs, the constant supply of glycogen slows down causing the muscles to fatigue.32 This study aimed to: (i) To investigate which position completes the most external work across the varying heart rate intensities, (ii) To compare differences in external workload (distance travelled) completed by each position and their average heart rate intensity and, (iii) Compare the average heart rate intensity of female footballers per 45 minute half of a football match to investigate fatigue.
METHODS
Participants and Recruitment
A sample of n=24 amateur female football players (mean±SD; age: 20.7±4.0 years; stretched stature: 165.6±5.8 cm; body mass: 58.1±4.7 kg) were recruited from an amateur football club within the South West of England during the 2016/2017 competitive season (Table 1). Recruited participants were outfield playing positions including defenders (n=8), midfielders (n=8) and forwards (n=8) and possessed at least 5 years of playing and training footballing experience. All participants were over 18 years of age, free from disease, illness or injury. They all completed a Physical Activity Readiness Questionnaire (PAR-Q) before inclusion33 and provided written informed consent, and understood their right to withdraw. To minimise risk, ethical approval was sought from the University of Gloucestershire Faculty Research Ethics Committee.
| Table 1. General summary (x± s) characteristics for n=24 amateur female football players according to playing position (defenders, midfielders and forwards) |
|
Variables
|
Defenders (n=8) ᵡ ± s |
Midfielders (n=8) ᵡ ± s |
Midfielders (n=8) ᵡ ± s |
| Age (years) |
22.4±5.5 |
20.9±3.5 |
20.7±2.1
|
|
Stretched Stature (cm)
|
164.6±2.2 |
168.3±7.4 |
163.8±6.1 |
| Body Mass (kg) |
59.1±3.7 |
59.1±3.7 |
59.1±3.7
|
Procedures
All participants followed the same protocols leading up to each test to ensure consistency. In the 24 hour period prior to testing participants did not partake in any vigorous exercise and refrain refrain from consuming any caffeine or alcohol.34 Furthermore, participants arrived hydrated and having not consume large quantities of food within a 2 hour prior to testing. Body Mass was measured in the morning with electronic digital weighing scales and to the nearest 0.1 kg. Stretched stature was also measured in the morning using a Harpenden Stadiometer to the nearest 0.1 cm. After measurements were taken, the mean value was determined for subsequent data analysis. The Yo-Yo IR Level 1 protocol commenced whilst all players entered the middle of the competitive season to determine the maximal HR values for each participant. The week following, the SAFT90 procedure was completed.35 The training load and amount of match play performed for each participant was standardised to the competitive season.
Experimental Session 1
(Yo-Yo Level 1 Intermittent Recovery Test): The Yo-Yo IR Level 1 test was performed on artificial turf in running lanes having a width of 2 m and a length of 20 m.36,37 Prior to the test, the participants performed a warm up prescribed by Barrett et al38 and Marshall et al39 an identical warm up was used prior to the completion of the SAFT90. Procedures suggested by Krustrupet al40 and Castagna et al41 for the Yo-Yo IR Level 1 were followed, with runs at a progressive speed, controlled by audio bleeps from a pre-recorded tape.36 After each bout of running, the players had a 10s rest period.36 The test result was recorded upon the point when a participant has failed twice to reach to finish line within the allocated time.36
Experimental Session 2
(Soccer-Specific Aerobic Field Test (SAFT90): The SAFT90 design uses an agility based course whereby players navigate around the 20 m course in an intermittent fashion through stranding (0 km/h), walking (~5.5 km/h), jogging (~10.7 km/h), striding (~15 km/h) or sprinting (maximal effort).38,39,42,43 The course is based around a shuttle run with the incorporation of 4 positioned poles in which the participants must navigate around (Figure 1).38,42,43 Altogether, the course provides the participants with 1332 changes in direction and 1269 changes in speed, eliciting internal loads similar to those reported from match-play.38,39,42,43
Prior to the completion of the test, 2he participants performed a football specific warm up prescribed by Barrett et al38 and Marshall et al.39 The first 8 exercises proposed by Marshall et al39 involved light jogging further to side-stepping with the inclusion of simple plyometric movements. Dynamic movements followed with each sequence performed twice over a 20 m distance.39 Final exercises involved sprint-based agility movements before undertaking the SAFT90.39
Data Collection Session
Heart rate: Heart rates were monitored throughout the Yo-Yo IR Level 1 and SAFT90 protocols using a HR monitoring system (Polar Team 2 System, Kempele, Finland).35 Furthermore, the data collected through the completion of the Yo-Yo IR Level 1 quantified the overall HR intensity zones. The intensity of the match was reported as the percentage of time spent in the five HR zones prescribed by Coelho et al30. Each zone was identified as a different percentage of HRmax zone 1 equates to <70% HRmax, zone 2, 70-85% HRmax; zone 3, 85-90 HRmax; zone 4, 90-95% HRmax, with zone 5, 95-100% HRmax. 30 Heart rates for each participant were recorded every second of each protocol and quantified to produce data for each minute throughout each 45 minute half and across the 90-minute duration with each position being investigated. The amount of time, alongside the percentage of time spent in each zone was reported in relation to the amount of external work completed for each position. Additionally, differences in HR recordings between positions and across the duration of the protocol (per 45 minute half) was measured, to investigate fatigue.
External workload: Throughout both protocols, in order to obtain overall external workloads, the participants were videoed replicating protocols previously implemented by De Ste Croix et al.43 The footage attained was then interpreted based on the standardised 20 m guidelines.
Statistical Analysis
Raw data sets were analysed using Microsoft Excel, 2016. Descriptive statistics, including means and standard deviations, were calculation for each measure including, external workload and HR intensities across each 45 minute half. Furthermore, percentage measurements for each position, based on each HR intensity, were calculated. In order to determine the following situations: a) comparison of intensity between the different halves of the match (first half vs. second half); b) comparison of each position across the intensity zones; c) comparison of each positions external workload; d) time spent at each intensity across each 45 minute half; a one-way analysis of variance (ANOVA) was applied. The level of significance for statistical testing was set at alpha level p<0.05.
RESULTS
On average, the overall external workload for all positions, during the SAFT90, was (mean±SD) 10913.7±1076.7 m. Across the 90-minutes, defenders recorded an external workload of 10020.4±1086.6 m, whilst forwards recorded a distance of 10938.9±865.2 m, and midfielders an external workload of 11781.9±324.7 m. Therefore, across the 90-minute SAFT90, midfielders overall performed the largest proportion of external work. Across each 45 minute halves of the SAFT90, midfielders consistently recorded the highest external workload. Across the opening 45 minutes, midfielders recorded distances of 6325.3±645.4 m, with forwards documenting distances of 6003.8±32.2 m and defenders, the lowest of the three outfield positions, 5774.6±783.0 m. This trend continued into the second half of the protocol, with midfielders maintaining the highest external workload (5456.6±635.3 m), with forwards distances of 4935.1±633.2 m and repeatedly, defenders the lowest of the three positions (4245.8±856.3 m). Furthermore, between the two separate halves, all players demonstrated a decreased external workload in the second half (6034.5±727.8 m) in comparison with the first 45 minutes completed (4879.2±851.3 m). A one-way ANOVA showed that the effect of position within female football on the external workload performed during a 90-minute SAFT90 was significant (F(df:23)=9.156 p< 0.05). However, across the two separate 45 minute halves, significance results differed. Within the first half, the effect of position on the external workload performed was not significant, whereas, the second half showed there to be a significant difference between the playing positions and overall external workload completed (F(df:23)=5.758; p< 0.05).
Based on the results illustrated in Table 1, defenders present the lowest average HR (144.3±7.4 bpm-1 in comparison with forwards (170.3±7.4 bpm-1 and midfielders (168.8±10.8 bpm-1) across the 90-minutes of recorded data. This trend is further present between the two 45 minute halves. Across the first 45 minutes, defenders recorded an average HR of 140.4±6.7 bpm-1 significantly lower than midfielders (181.0±13.3 bpm-1 and forwards (170.1±7.5 bpm-1. In the second half, forwards displayed the highest average HR of 170.4±9.4 bpm-1 in comparison with midfielders (170.0±9.2 bpm-1) and forwards (148.1±9.4 bpm-1). Across the two halves of the 90 minutes, defenders and forwards each presented average HR data showing an increase, from the first half to the second, midfielders however, demonstrated a decreased. The average HR recorded for all positions across the SAFT90 was 161.1±14.7 bpm-1 as shown in Table 2, with the average intensity during the protocol for all defenders, midfielder and forward represented 81% HRmax.
| Table 2. Total external workload performed during SAFT90 for each position (p) including defenders (d), midfields (m) and forwards (f) |
|
P
|
1st Half (m) |
2nd Half (m) |
Full Game (m) |
| Mean±SD |
Range |
Mean±SD |
Range |
Mean±SD |
Range
|
|
D
|
5774.6±783.0 |
4969-6987 |
4245.8±856.3 |
3263-5659 |
10020.4±1086.6 |
8562-11984 |
| M |
6325.3±645.4 |
5236-6984 |
5456.6±635.3 |
4362-6549 |
11781.9±324.7 |
11236-12142
|
|
F
|
6325.3±645.4 |
5002-6954 |
4935.1±633.2 |
4071-5762 |
10938.9±865.2 |
9412-11985 |
| ALL |
6034.5±727.8 |
4969-6987 |
4879.2±851.3 |
3263-6549 |
10913.7±1076.7 |
8562-12142
|
| Table 3. Mean heart rate (HR) during SAFT90 for each position (p) including defenders (d), midfields (m) and forwards (f) |
|
P
|
1st Half (m) |
2nd Half (m) |
Full Game (m) |
| Mean±SD |
Range |
Mean±SD |
Range |
Mean±SD |
Range
|
|
D
|
140.4±6.7 |
130.0-148.0 |
148.1±9.4 |
136.0-160.0 |
144.3±7.4 |
136.0-154.0 |
| M |
181.0±13.3 |
146.0-183.0 |
170.0±9.2 |
157.0-180.0 |
168.8±10.8 |
152.0-181.5
|
|
F
|
170.1±7.5 |
146.0-183.0 |
170.4±9.4 |
154.0-183.0 |
170.3±7.4 |
159.0-184.0 |
| ALL |
159.4±16.6 |
130.0-185.0 |
162.8±13.9 |
136.0-183.0 |
161.1±14.7 |
136.0-184.0
|
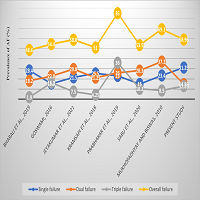
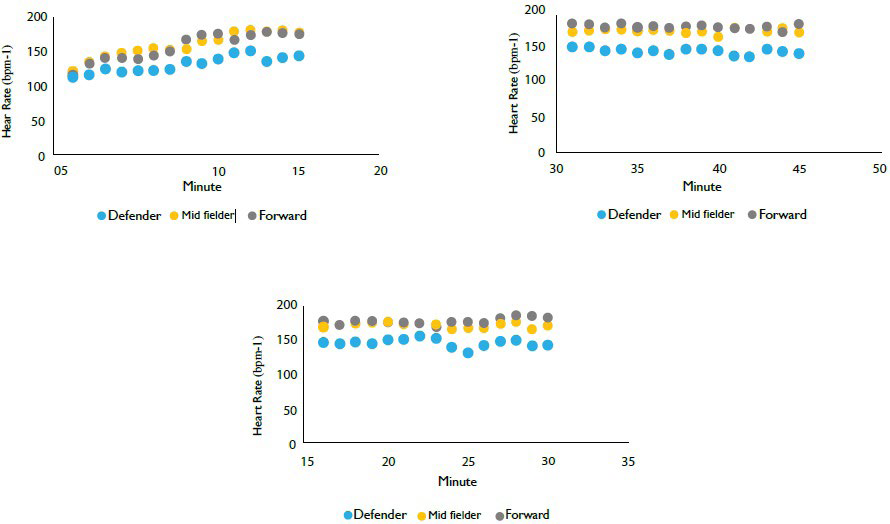
Figure 2 and Figure 3 demonstrate that midfielders and defenders continually displayed lower average heart rates than forwards per 15-minute bout of the SAFT90. Within the opening 15 minute bout (Figure 2), all three positions present an increase in HR, following into the second bout (15-30 minutes), only at the 23rd minute did each positions HR plateau. Figure 1 illustrates average heart rates from midfielders and forwards maintaining 150-200 bpm-1, however defenders continually work between 100-150 bpm-1. Defenders further display periods of increased and decreased heart rates with decreases falling in both the 35th37th minute and 41st-43rd minute. Towards the end of the opening half of the SAFT90, both midfielders and defenders show a decrease in average HR.
Figure 1. A Diagrammic Representation of the SAFT90 Football Match-play Course
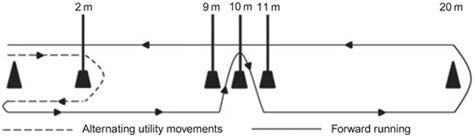
Figure 2. Average HR for Defenders, Midfielders and Forwards per 15-minute bout of the First 45 minute Half of the SAFT90 including 1-15 minutes, 15-30 minutes and 30-45 minutes
Across the entire bout, defenders displayed much lower heart rates showing a range between 135-160 bpm-1 in comparison with midfielders at 160-180 bpm-1 and forwards at 170-190 bpm-1. The final bout displayed both the midfielders and forwards HR decreasing in comparison with the previous 15-minutes (Figure 3). Similarly, defenders showed periods an increased HR of 160 bpm1 at 77 minutes and 165 bpm-1 at 85 minutes, with periods of a decreased HR of 140 bpm-1 at 80 minutes and then 87 minutes. However, the final 3 minutes of the entire protocol presents all three positions average heart rates decreasing.
Figure 3. Average HR for defenders, midfielders and forwards per 15 minute bout of the second 45 minute half of the SAFT90 including 45-60 minutes, 60-75 minutes and 75-90 minutes
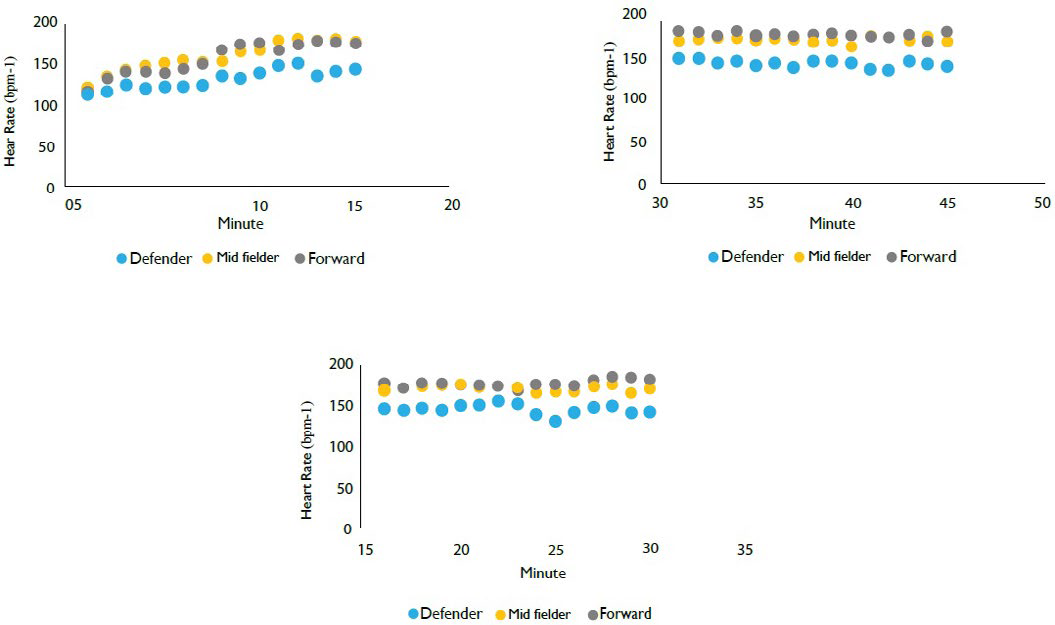
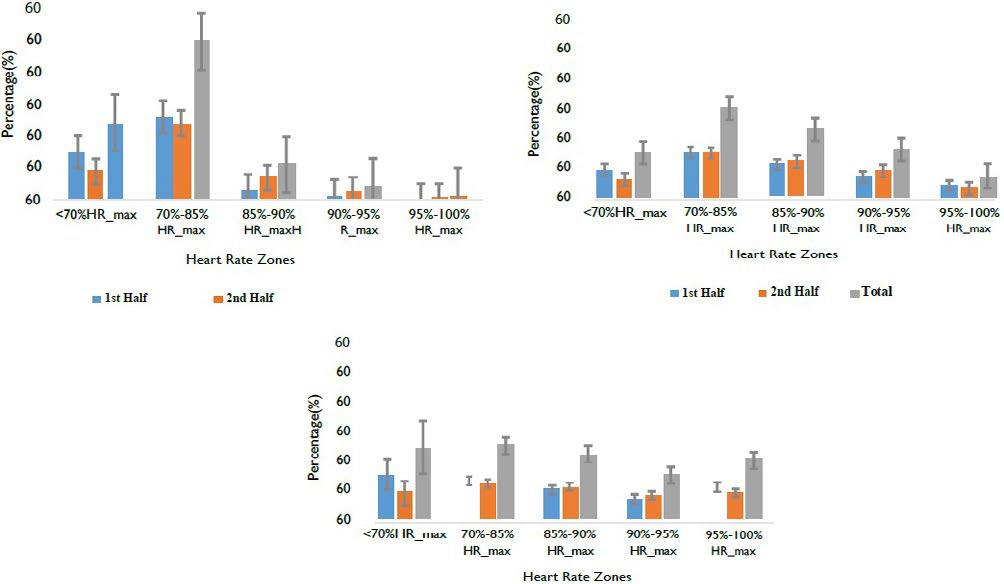
Figure 4. Percentage of time defenders, midfielders and forwards spent within zone 1,< 70% HRmax; zone 2, 70-85% HRmax; zone 3, 85-90 HRmax; zone 4, 90-95% HRmax and zone 5, 95- 100% HRmax for first 45-minute half; second 45 minute half and full 90 minutes of the SAFT90
A one way ANOVA showed the effect of position, within female football, on the average HR during a 90 minute SAFT90 was significant (F(df:23 )=22.317;(p< 0.05). Furthermore, results showed a significant difference between defenders, mid fielders and forwards average HR across both the first 45 minute half (F(df:23)=23.405; p<0.05) and second 45 minute half (F(df:23)=14.925; p<0.05).
Heart Rate Intensities
Across the total SAFT90, the average intensity for all positions represents 81% HRmax, which in line with the investigation means within zone 2 (70-85% HRmax). Within the first half, the average intensity for all positions represents 80% HRmax; however, in the second half, average intensity increased to 82% HRmax but was maintained in zone 2. Through the completion of a one way ANOVA, significance results showed position, to have an effect on the level of intensity and time spent at each intensity. Across the SAFT90, there was a significant difference between playing position and the duration spent working within zone 1, p<0.05) zone 2 between 70-85% HRmax(F(df:23)=5.965 p<0.05) and zone 4 at 90-95% HRmax(F(df:23)=4.433 p<0.05) However, across zone 3 between 85-90% HRmax and zone 5 at 95-100% HRmax, no significant difference was found between each position and the duration spent working at each intensity. Within the opening half, defenders average intensity was 73% HRmax, working within zone 2 (70-85% HRmax). However, midfielders and forwards average intensity represented that of zone 3 (85-90% HRmax), with midfielder’s average intensity at 88% HRmax and forwards 86% HRmax. In comparison with the second half, forwards display no change in average heart rate intensity. Midfielders however moved into zone 2 (70-85% HRmax) at 83% HRmax. Defenders nonetheless display an increase in average heart rate intensity to 78% HRmax; however, still maintained working within zone 2 (70-85% HRmax).
Across the 90-minutes (Figure 3), all three positions spent time in each HR zone, from zone 1 to zone 5. All positions each spent the largest percentage of the SAFT90 in zone 2(70-85% HRmax). Specifically, within zone 1 (<70% HRmax), defenders spent the larger percentage of time with forwards the least, whereas, at the highest intensity, in zone 5 (95-100% HRmax), forwards spent the larger percentage of time with defender’s the least. Midfielders specifically spent the largest percentage of the 90-minutes within zone 3 (85-90% HRmax) and zone 4 (90-95% HRmax) in comparison with the further outfield positions.
Figure 3 display differences between the HR intensities between the two 45-minute halves of the SAFT90. Within the first half, all three positions worked across each HR zone; however, in the second half, defenders never worked with in zone 5 (95-100% HRmax). Similarly, between the first half and second half, all three positions spent the largest percentage of the game at 70-85% HRmax in zone 2. Specifically, across both halves of the protocol, midfielder’s largest duration of time was spent within zone 2 and 3 working in total across 70-90% HRmax whereas defender’s largest percentage of time was spent within zone 1 and 2. Forwards in comparison spent the smallest percentage of time within zone 1; however, increasingly more from zones 2 to zone 5 with HR intensities varying from 70-100% HRmax.
Significance results of a completed one-way ANOVA showed position has an effect on the level of intensity and time spent at each intensity. Across the first 45-minute half of the SAFT90, there was a significant difference between playing position and the duration spent working within zone 170% HRmax, (F(df:23)=6.379: p<0.05); ; zone 2 between 70-85% HRmax (F(df:23)=5.076; p<0.05); ; zone 3 (85-90% HRmax) (F(df:23)=4.997; p<0.05); and zone 4 (90-95% HRmax) (F(df:23)=4.635; p<0.05); However, no significant difference was found between position and duration working at the intensity of zone 5 (95-100% HRmax). Across the second 45-minute half, no significant difference was found between each position, for the duration of time spent within, zone 1 (p<0.05).
CONCLUSION
External Workload
In total, for all three positions, the total external workload completed across 90-minutes was 10913.7±1076.7 m with a range of 8562-12142 m. The findings correspond to previous research showing the average distance players cover during a match is 8-12 km.7,16,20 Statistical analysis across the 90-minutes concluded a sinificant difference between the workloads completed between the three positions. On average, the largest external workload completed was by midfielders (11781.9±324.7 m) followed by forwards with defenders covering the smallest distance covered (10020.4±1086.6 m). Other studies have also found midfielders to cover the greatest external workload.3,10,44 The completed distance for midfielders (11781.9±324.7 m) further corresponds to that of previous studies within the range of 10-12 km.10,44
The protocol removes oppositional effects and tactics, resulting in the physiological and mechanical demands displayed during football match-play being observed; therefore, it can be concluded that the greater distances were not due to tactics and styles of play.34,42 Midfielders however, to have developed higher physical capacities or VO2max levels due to their overall roles within match play, through involvement in both attacking and defensive phases of play in comparison with their counterparts, who rarely cross or retreat past the half way line.45 Therefore, with an increased physical capacity, more external work is able to be completed. However, with regards to total external workload, other variables further to VO2max may have influenced the results. These variables include changes in the intensity of activity as well as motivation.8 Between the three positions, defenders covered the lowest external workload (10020.4±1086.6 m). Indeed, several studies have previously found defenders to obtain, in general, lower fitness levels, resulting in lower external loads performed in comparison with midfielders and forwards.20,44 Research by Di Salvo et al21 supports defender’s low overall distances covered both anaerobically and aerobically as the result of their lower physical capacity and tactical role to complete small bouts of movement in winning duels and aerial challenges.24
Heart Rate
Considering the load intensity from a physiological point of view, average HR results across the 90-minute SAFT90 for all players was 161±14.7 bpm-1 corresponding to 81±7.4% HRmax. This matched heart rates previously obtained within research by Andersson et al44 who found the average HR of female footballers within domesticated matches to correspond to 162±6 bpm-1 or 85±3% of HRmax. However, the participants of the study were international female players from Sweden and Denmark, playing professionally, in comparison with amateur footballers.
The football simulated match intensity found in the present study did not differ markedly from those reported in other investigations. Coelho et al30 evaluation of 26 footballers, during a championship game, reported an overall intensity of 84% HRmax. Furthermore, Mohr et al46 reported an intensity of 85% HRmax during a friendly match of the 4th division, whilst O’Connor47 evaluated HR during two women’s and men’s soccer games finding an intensity of 85% HRmax. However, both studies evaluated friendly matches rather than a simulated football match. Intensity observed in the present study further matches than that obtained by Reilly and Keane,48 who evaluated senior soccer players in a specific simulated test with the mean intensity presented at 80% HRmax. Although maximum effort tests are suitable for the determination of HRmax, a previous study by Antonacci et al49 showed that HRmax is lower in simulated tests, than during official matches.
Heart Rate Intensities
Focusing on the total 90 minute SAFT90, the average intensity for all positions was 81% HRmax which in line with the investigation means within zone 2 (70-85% HRmax). The data, as a result, cor responds with other studies findings.30,44,46 Throughout the first half, the average intensity for all positions was 80% HRmax; however, within the second half the average intensity increased to 82% HRmax. This meant across both 45-minute halves working within zone 2 (70-85% HRmax). However, the results contradict the research conducted by Coelho et al30 whom observed a decrease in game intensity from the first to second half of a championship football game. Mortimer et al50 stated that a reduction in game intensity occurs during the second half of a football match, due to the role of fatigue as a result of the progressive utilisation of glycogen, which decreases during the second half. With focus on each of the position, forwards average HR did not differ between either of the halves of football and maintained 86% within zone 3 (85-90% HRmax), whereas defenders rose from the first half (73% HRmax) to the second half (78% HRmax). Midfielders average HR from the first half (88% HRmax) in comparison to the second half (83% HRmax) was the only decrease supporting previous research. A similar decline had been reported in other studies.30,46 The lack of significant difference between the two halves of the game for forwards is however supported by Vencurik et al51 who witnessed no changes between certain positions physiological demands across the two halves of a female basketball match.
Across the 90-minutes, results displayed differences between each of the HR intensity zones, however significant differences were only found between the duration each position spent within zone 1, zone 2 and zone 4. Nonetheless, across the 90-minutes, each position spent time within each zone. All three positions each spent the largest percentage of the SAFT90 within zone 2 (70-85% HRmax) in comparison with the other intensity zones. Defenders spent the largest percentage of time within zone 1, with forwards the least, whereas, at the high intensities, in zone 5, forwards spent the larger percentage of time with defenders the least. This result demonstrates the importance of HIR for forwards and LIT for defenders. Di Mascio and Bradley,14 analysed the evolution of football describing forwards movements to focus around high intensities and short-duration efforts, with defenders maintaining a low intensity with minimal HIR, therefore, the current study backs up that of previous research.4,10
The results however, contradict the research by Jozak et al24 who studied 600 players during the world cup finals; results showed defenders and forwards to have completed the most LIR due to the positions having the least contact with the ball. However, the comparison must be taken with caution due to the sample using male international athletes during competitive matches, resulting in formations and tactics potentially interfering with play.20,22 A further finding includes midfielders specifically spending the largest percentage of the 90-minutes within zone 3 and zone 4. Research by Coelho et al30 and Goncalves et al25 reported the similar findings. Furthermore, Orendurff et al52 investigated differences in positions during a game using a step rate as an intensity parameter; the results obtained were similar to those observed in both the current study but further the investigation by Coelho et al.30 Midfielders presented a similar game pattern characterised by few maximum intensity bouts (step rate=7) and short recovery bouts of moderately high intensity (step rate=4), thus in agreement with studies showing a higher aerobic capacity of midfielders.30,45
First Half Versus Second Half Fatigue
It is generally accepted that physical performance declines during a match because of increased fatigue towards the end of a game.36,42 Within the current study, first half differences in comparison second half suggest all positions to experience fatigue. External workload decreased for all positions by 11% with a first half overall workload of 6034.5±727.8 m in comparison to a second half workload of 4879.2±851.3 m. Furthermore, defenders, midfielders and forwards individual workloads completed each decreased. The findings further support numerous research that indicates that the fatigue induced by the physical activity completed during the first half is related to the physical activity completed during the second.4,19,44
Within the first half, all three positions worked across each HR zone; however, in the second half defenders never worked with in zone 5 displaying a slowly declining intensity. Furthermore, the percentage of time defenders spent within zone 1 and zone 2 increase in the second half. Additionally, midfielder’s intensity decreased at the highest intensity (95-100% HRmax) by 2%, further to forwards by 4%. Moreover, forwards time within zone 2 and zone 3 and zone 4 increased within the second half in comparison with the first. Specifically, forwards duration of time spent in zone 3 increased by 2% and in zone 4, by 3%. Martinez- Lagunas et al4 stated that the amount of HIR completed in the second half, compared to the first half of match-play, decreases due to temporary and permanent forms of fatigue. Since football game intensity and fatigue is influenced by the opponent and tactical preferences of the coach, the data should be considered carefully due to using a SAFT90. Nonetheless, Jones et al42 stated that the fatigue induced by the SAFT90 protocol is representative of the responses associated with actual football match-play.53
In summary, overall external distance during a SAFT90 is similar to that of competitive match-play. The results indicated that all positions workloads externally are different, with midfielders achieving the highest overall distance, in comparison with forwards and defenders, who completed the least. Defenders spent a higher percentage of the protocol within the lowest intensity zones with forwards rarely performing below zone 2 (70-85% HRmax) resulting in forwards spending the largest percentage of the game at the highest intensities. This data should be included in specific training programmes addressing the tactical positions of players. In the case of forwards, the objective is to increase performance at short durations and at the highest intensities, since their main focus is to move at pace to create space to receive the ball or break through oppositions defensive lines. Midfielders are the players who spent the most time between zone 2 (70-85% HRmax), zone 3 (85-90% HRmax) and zone 4 (90-95% HRmax). In addition, across both halves and the total 90-minutes, they spent a higher percentage of time in zone 4 (90-95% HRmax) than defenders and forwards, suggesting higher aerobic requirements of these players. This higher requirement of aerobic activities should be included in the physical training of midfielders to improve their recovery and consequently their performance.
CONFLICT OF INTEREST
None of the authors have any conflict of interest.