INTRODUCTION
In both developed and developing countries, diabetes mellitus has explosively increased, and there has been a lot of ongoing discussion regarding calorie restriction (CR) and low-carbohydrate diet (LCD) for dietary treatment. LCD was originally developed by Bernstein, Atkins and others,1,2 and now it becomes a universal topic of discussion.3-8
The Japanese Dietetic Association recommended taking 50-60 % carbohydrate, but our group treated DM patients by LCD with 12% carbohydrate since 1999, and experienced a good response and prognosis.9-13 LCD often accompanied with increase of ketone bodies as a toxic substance, but recent study found the physiological role of beta-hydroxybutyrate, especially in the normal delivery and very low carbohydrate treatment was effective to treat gestational diabetes.13 It caused a paradigm change to use LCD for the treatment of diabetes.
Recently, postprandial hyperglycemia is reported to be a risk factor of cardiovascular events. Several evaluation methods, such as M-value and mean amplitude of glycemic excursions (MAGE) have been proposed to estimate the risk.14-18 Efficacy of these indexes under the LCD dietary treatment needed to be analyzed. By combining these 2 streams, we have investigated blood glucose changes in diabetic patients under a controlled meal of CR and LCD in the light of diabetic and M-value aspects.
SUBJECTS AND METHODS
The subjects of the study were 26 T2DM patients who planned to receive LCD therapy for 2 weeks. They were 12 males and 14 females, with an average age 62.6±8.6 years old, ranging from 38 to 78 years old. A few patients were newly diagnosed with T2DM, but mostly transferred from other hospitals with a wish to be treated by LCD. Before beginning with LCD, they were instructed well about it. They received the same treatment protocol for endocrine and metabolic examination.
The study began with providing a conditioning CR diet to the patients for 2 days. CR diet included carbohydrates 60%, protein 15%, and lipids 25% with 1400 kcal/day according to the standard dietary therapy of the Japan Diabetic Society. Whereas, the diet for LCD was composed of carbohydrates 12%, protein 24%, lipids 64% with 1400 kcal/day according to the LCD method.9,12 Total intake of calorie was adjusted properly by the size or weight of the patients.
The schedule and protocol during admission were as follows:
1. On admission, HbA1c and other biochemical data were collected. In the early morning on day 2, several biomarkers such as lipids and daily profile of glucose were measured.
2. On day 2 and 3, urinary excretion of C-peptide for 24 hours was measured. The dietary energy of CR and LCD was adjusted to 1400 kcal in average. On day 3 CR was changed to LCD.
3. On day 12, the daily profile of blood glucose and biomarkers were measured.
4.The daily profiles of blood glucose on day 2 and 12 were analyzed with the following method.
Statistical Analysis
For statistical analysis, all 26 patients were classified into 3 groups according to their HbA1c level on the admission; the low (L) group: less than 6.9%, middle (M) group: 7.0-8.4%, high (H) group: more than 8.5%.
The average blood glucose was calculated by the mean amplitude of glycemic excursions (MAGE), M-value, and the data between CR and LCD were compared.
The calculation of M-value is performed as follows; 1) the optimal blood glucose is set at 0, as the standard, 2) the example is 100 mg/dL, 3) the further the blood glucose value deviates from the standard, the greater will be the point assigned.
Practically M-value was calculated by the following formula:
M-value (Morbus value) is a logarithmic transformation of the deviation of glycemia from an arbitrary assigned “ideal” glucose value, with an expression of both the mean glucose value and the effect of glucose swings.14,15,19 The formula is as follows: M=MBS+MW, where MW=(maximum blood glucose-minimum glucose)/20; MBS=the mean of MBSBS; MBSBS=individual Mvalue for each blood glucose value calculated as (absolute value of [10×log(blood glucose value/120)]).19
The standard range of M-value is <180, borderline is 180-320 and abnormal is >320. Whereas, in the MBS value, the standard range is <5, borderline is 5-10 and abnormal is >10. It was reported that multiple sampling and a 7-point glycemic trial per day would yield similar results.16,20
Data was represented as the mean±standard deviation when the data were normal distribution. Pearson’s correlation coefficients were calculated using the JMP (Version 8) statistical analysis software (JMP Japan Division of SAS Institute Japan Ltd., Minato-ku, Tokyo, Japan) and Microsoft Excel analytical tool.
Intergroup comparisons were made using the Wilcoxon rank sum test or the Bonferroni multiple comparison (Lambert method). A significance level of less than 5% obtained using a two-tailed test was considered to be statistically significant.
Ethical Considerations
The present study was conducted in compliance with the ethical principles of the Declaration of Helsinki and Japan’s Act on the Protection of Personal Information along with the Ministerial Ordinance on Good Clinical Practice (GCP) for Drug (Ordinance of Ministry of Health and Welfare No. 28 of March 27, 1997). Informed consent was obtained from the patients concerning this trial. The study was registered in advance with UMIN #R000029006.
RESULTS
Anthropometric data of the patients
Subjects were divided into 3 groups according to the HbA1c value, and the data recorded by examining the subjects is shown in Table 1. Low (L), middle (M) and high (H) groups are composed of 9, 9, 8 patients, respectively, and their HbA1c values were 6.1±0.5%, 7.9±0.4%, 9.3±0.8%. BMI and abdominal circumference are slightly high in the H group.
| Table 1: Data of the Subjects Classified in 3 Groups. |
|
Low group
|
Middle group |
High group
|
| 1. Anthropometry |
|
|
|
| Number |
9
|
9 |
9
|
| Male/female |
5/4
|
4/5 |
3/5
|
| Age (years, mean±SD) |
57.2±11.1
|
64.7±11.2 |
63.7±5.7
|
| Body mass index (kg/m2 ) |
23.3±2.3
|
24.4±3.7 |
25.6±4.1
|
| Abdominal circumference (cm) |
84.4± 7.2
|
85.7±9.0 |
89.8± 9.5
|
| 2. Data on admission |
|
|
|
| HbA1c (%)* |
6.1±0.5
|
7.9±0.4 |
9.3±0.7
|
| HOMA-R* |
3.3 (2.2-3.8)
|
2.7 (1.6-5.2) |
2.7 (1.8-4.3)
|
| HOMA-β** |
78.4 (60.6-83.1)
|
29.5 (12.5-60.1) |
11.8 (9.1-25.1)
|
| eGFR (mL/min) |
91.8±23.5
|
86.1±30.7 |
104±31.3
|
| Urinary Uric acid/cre |
0.42±0.14
|
0.53±0.16 |
0.63±0.13
|
| 3. Data on day 2 |
|
|
|
| Fasting glucose (mg/dL)* |
109.0±27.3
|
155.4±35.7 |
210.7±52.9
|
| Glucose-120 min (mg/dL)* |
167.8±56.4
|
217.7±72.3 |
329.8±32.5
|
| M-value* |
26.1±34.7
|
94.1±11.2 |
343.0±192.0
|
| Triglyceride (mg/dL) |
106.0±68.6
|
131.6±75.5 |
163.7±84.4
|
| Uric acid (mg/dL) |
5.5±1.5
|
5.7±1.1 |
4.9±0.9
|
| 4. Data on day 12 |
|
|
|
| Fasting glucose (mg/dL) |
98.3±14.2
|
121.5±23.9 |
130.0±27.8
|
| Glucose-120 min (mg/dL) |
118.4±20.9
|
142.2±34.7 |
164.8±47.1
|
| M-value* |
10.4±7.9
|
18.8±28.4 |
84.2±52.7
|
| Triglyceride (mg/dL) |
70.0±28.8
|
83.3±15.6 |
125.0±38.2
|
| Uric acid (mg/dL) |
6.5±1.8
|
6.8±1.9 |
6.2±1.2
|
| Elevation of UA (mg/dL)* |
0.55 (0.28-0.93)
|
0.95 (0.45-1.37) |
1.15 (0.6-1.8)
|
Data are expressed as mean±SD.
*: median [25-75 percentile],
*: significant difference (p<0.05) each other among 3 groups. |
Blood glucose under CR and LCD therapy
The daily blood glucose changes by 7 points have been shown according to the three groups for CR (day 2) and LCD (day 12) (Figure 1).
Figure 1: Daily Profile of Blood Glucose on CR (day 2) and LCD (day 12).
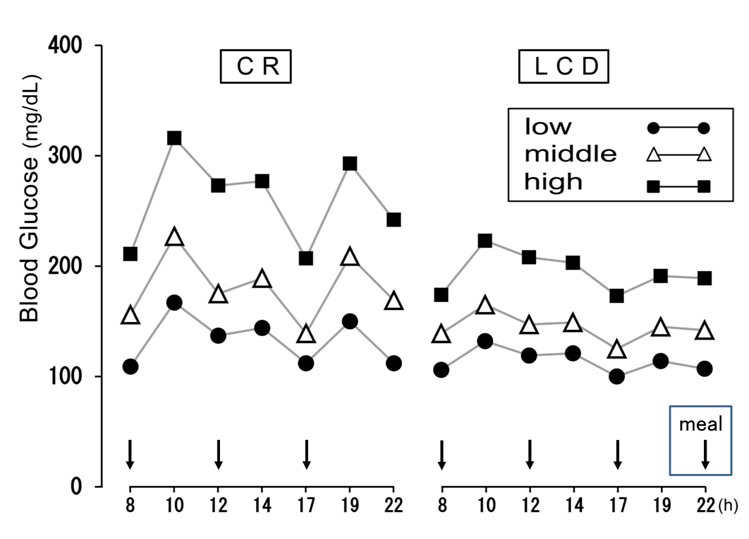
L: Low; M: Middle; H: High group; CR: Calorie restriction; LCD: Low-carbohydrate diet
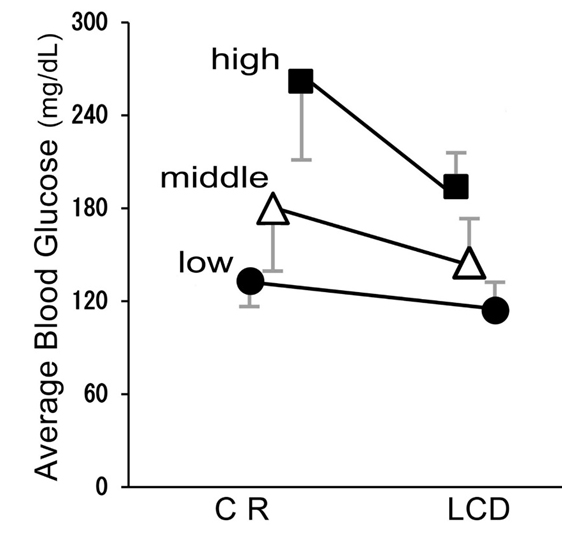
The average glucose levels improved by LCD therapy from 133±17 mg/dL to 114±22 mg/dL in L group, from 180±45 mg/dL to145±28 mg/dL in M group, and from 262±51 mg/dL to 194±26 mg/dL in H group (p<0.05 in all groups) (Figure 2).
Figure 2: Average Blood Glucose in CR (day 2) and LCD (day 12). Average Glucose Levels in 3 Groups Decreased with Statistically Significant Difference (p<0.05). Data are Represented by mean±SD.
M-value in CR and LCD
The changes of the M-value of blood glucose from CR (day 2) to LCD (day 12) are shown in Figure 3. The median levels of Mvalue at CR and LCD were: 7.1 and 7.2 in L group, 50.8 and 8.8 in M group, 273.2 and 85.3 in H group, respectively (Figure 3a). The actual changes of M-value in all individual patients were shown in Figure 3b.
Figure 3: The Changes of M-value on CR (day 2) and LCD (day 12). a) Changes in 3 Groups, Data are mean±SEM. b) Actual Data of M-value in 3 Groups.
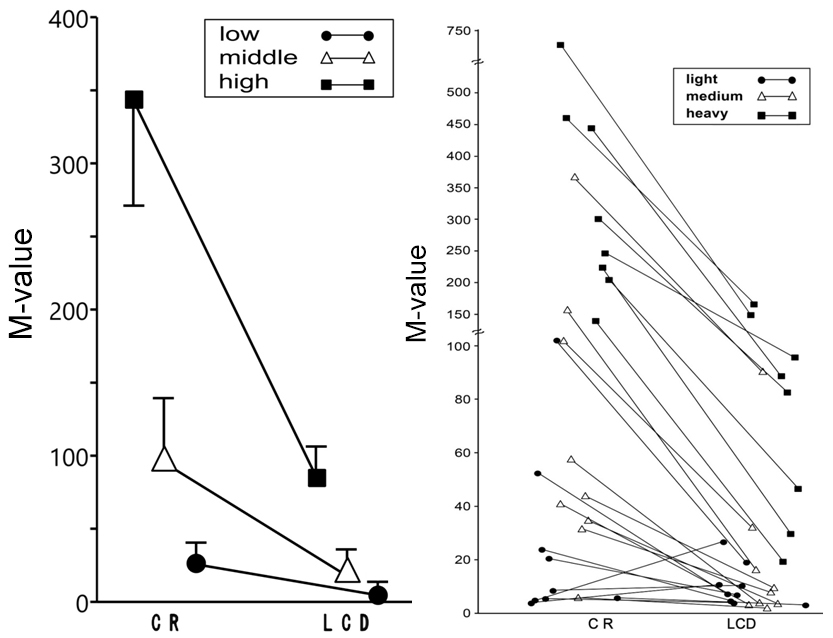
L: Low group; M: Middle group, H: High group; CR: Calorie restriction; LCD: Low-carbohydrate diet.
Urinary C-Peptide in CR and LCD
Urinary C-peptide in 24 hours was measured on day 2 (CR) and on day 3 (LCD) (Figure 4a). The median values of urinary C-peptide by CR were: L: 94.0 mg/day, M: 61.0 mg/day, and H: 70.5 mg/day, respectively, and those by LCD was 65.5(L), 47.5(M) and 46.5 mg/dL (H), respectively. By paired-T analyses, three groups showed a statistically significant decrease (p<0.05).
Figure 4: Comparison of Biomarkers on CR and LCD in Three groups. a) Urinary C-peptide on CR (day2) and LCD (day 3).
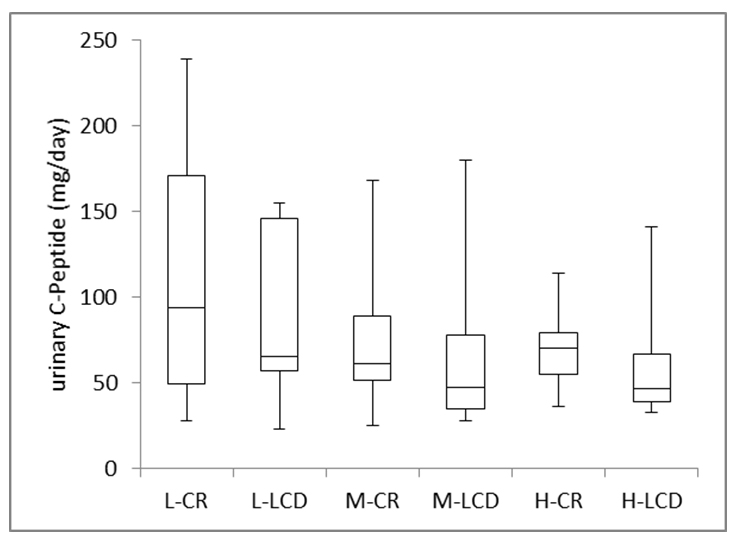
L: Low group; M: Middle group, H: High group; CR: Calorie restriction; LCD: Low-carbohydrate diet.
The urinary C-Peptide excretion by CR (day 2) and by LCD (day 3) showed statistically positive correlation of (p<0.01).
TG and Uric Acid
The changes in triglyceride value from CR (day 2) to LCD (day 12) are shown in Figure 4b. TG from day 2 to day 12, there was a statistically significant decrease, which was respectively.
Figure 4: b) Triglyceride Values on CR (day 2) and LCD (day 12).
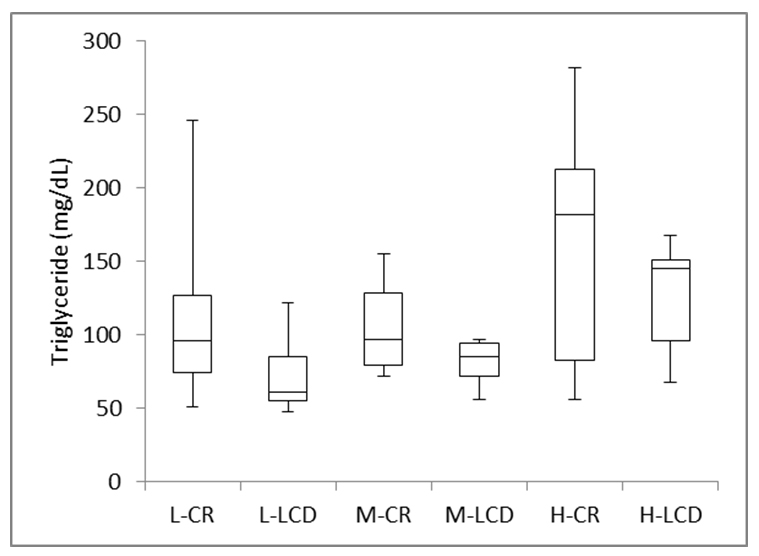
L: Low group; M: Middle group, H: High group; CR: Calorie restriction; LCD: Low-carbohydrate diet.
Median levels of TG value are: L: 96 mg/dL and 61 mg/ dL, M: 97 mg/dL and 85.5 mg/dL, H: 182 mg/dL and 145 mg/ dL, respectively.
The changes in uric acid value from CR (day 2) to LCD (day 12) are shown in Figure 4c. The median levels by CR were: 5.0 mg/dL (L group), 5.7 mg/dL (M group), and 4.6 mg/dL (H group), respectively. It increased to 6.3 mg/dL in L group, 6.8 mg/dL in M group, and 6.0 mg/dL in H group, respectively. These elevation was statistically significant (p<0.05) in all three groups.
Figure 4:c) Uric Acid Values on CR (day 2) and LCD (day 12).
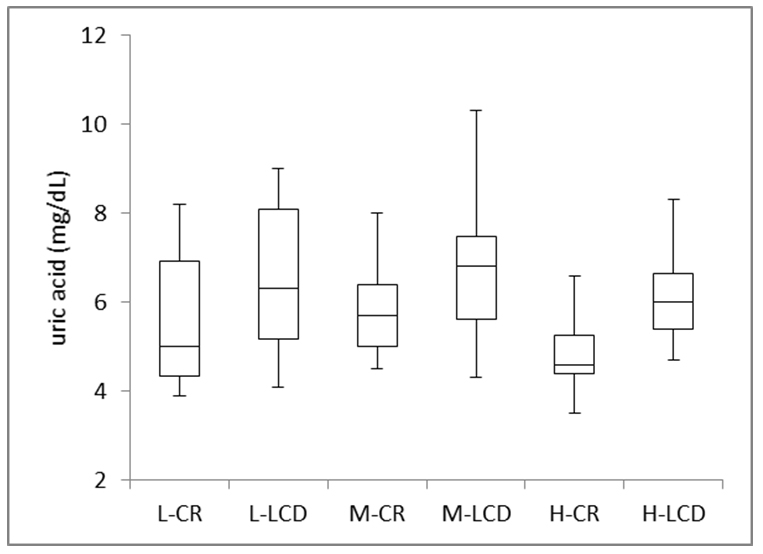
L: Low group; M: Middle group, H: High group; CR: Calorie restriction; LCD: Low-carbohydrate diet.
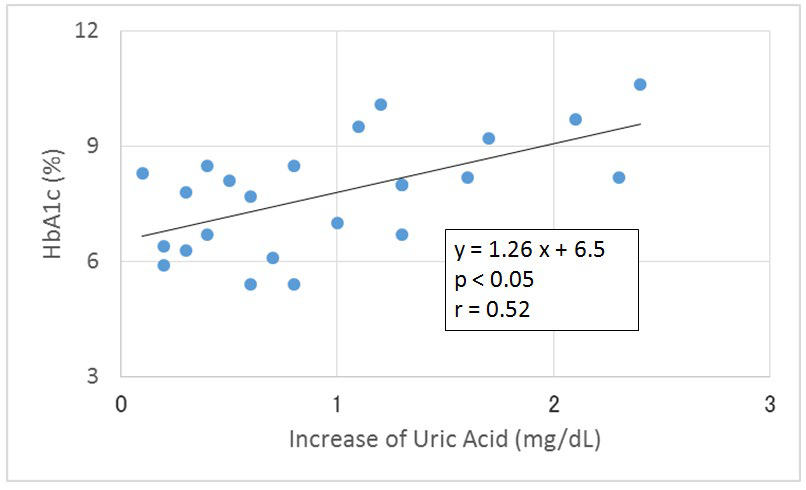
There is a significant correlation between increase of uric acid and HbA1c levels (Figure 5).
Figure 5: Correlation between the Increase of Uric Acid and HbA1c Level. Uric acid levels were measured on Day 2 (CR) and Day 12 (LCD). Significant Correlation were observed between Increase of Uric Acid and HbA1c.
DISCUSSION
The clinical effects of LCD have been recognized by many case reports.1-3,7 In Japan, our group have led a role to develop LCD diet for obesity and diabetic patients by a lot of books and reports.8-13 In this report, we investigated the clinical effects of LCD in relation with M-value.
Even though the subjects of this study were very heterogeneous, all patients showed a good response to the short term LCD therapy. Individual response was well shown by the change of M-value. Two day conditioning with CR was useful to determine the will and safe introduction of very low carbohydrate diet. Carbohydrate intake by CR was 210 g and that by LCR was 42 g. Definition of LCD has not yet made, but 40% carbohydrate is recommended by the American Diabetic Association. Our very low carbohydrate diet was effective on all stage of diabetes, and contributed to reduce the dose of drug administration in most patients.
LCD improved many aspects, such as improvement of hyperglycemia, hyperinsulinemia, hyperlipidemia, etc. Decreased urinary C-peptide suggested the suppression of insulin secretion per day up to three-fourth times, because the regression curve showed y=0.73x+7.8.
Recently, a risk of post-prandial hyperglycemia for the cardiovascular events is recognized. Fasting glucose and/or HbA1c could not show the above risk. Several methods have been proposed, like MAGE15 and M-values.14 Initially, Schlichtkrull14 measured the blood glucose levels 20 times per day. However, multiple sampling and 7-point glycemic trial per day have yielded similar results.16,20
In this study, M-values of the 3 groups were significantly decreased by LCD therapy. M-value can be a clinically useful index for evaluating the glucose profile of diabetic patients.
As for the glucose fluctuation, the following 5 markers would be valuable:16,21 1) The mean amplitude of glycemic excursions (MAGE), 2) standard deviation (SD), 3) the mean of the daily difference (MODD), which are calculated via continuous glucose monitoring (CGM).22,23 4) M-value, which estimates both average and fluctuation of blood glucose, and 5) 7-point glycemic trial, which is prevalent in-patients admitted in the hospital.16,21-23 Markers 4) and 5) were applied in this report, that can be easily calculated using a free software Excel by internet.
The continuous glucose monitoring (CGM) measurement for 48 hours would be ideal,24,25 but the 7-times method would be simple and useful without invasion. Seven points are before and 2 hours after each meal and at night before sleep. Our average blood glucose data, classified into 3 groups according to HbA1c value, were compatible for the two reports. One is the comparison between HbA1c and average blood glucose values,26 and the other is reporting the regression correlation, estimated average glucose (eAG) (mg/dL)=28.7×A1c-46.7.27 In the future, glucose variability may be considered more important, due to its influence on cognitive ability.28
LCD lowered TG levels in only 10 days, which were consistent with previous reports of LCD.29 The uric acid level was significantly elevated by LCD, and the elevated degree was significantly correlated with HbA1c. From our clinical experience with the LCD diet in thousands of patients, the changes in uric acid levels ran the gamut from increase, stabilization and decrease. One of the causes for elevated uric acid levels would be the insufficiency of total calorie intake in addition to LCD. If the total calorie intake per day were increased to the proposed necessary energy level stated by the Ministry of Welfare and Labor, then uric acid levels could remain within the normal range.
There are several reports indicating a significant correlation between uric acid values and insulin resistance.30-32 As the influence of LCD for renal function has been in discussion,33,34 the metabolism and changes of uric acid metabolism will be involved in the effect of LCD. So far, any report concerning uric acid elevation and LCD could not be found. As such, the relationship between these two factors is a subject for future study.
CONCLUSION
Ten to 12 day- dietary therapy with LCD was quite effective to improve blood glucose profile. Patients with high HbA1c could be safely treated by LCD. Blood glucose improvement was well correlated to the M-value.
LCD improved many aspects, such as improvement of hyperglycemia, hyperinsulinemia, hyperlipidemia, etc. The uric acid level was significantly elevated by LCD, and the elevated degree was significantly correlated with HbA1c. It needs further study whether LCD itself causes elevation of uric acid or insufficient calorie intake would be the cause.
ACKNOWLEDGEMENT
The introduction of this article was presented at the 89th Scientific Meeting of Japan Endocrine Society (JES) Annual Congress, Kyoto, 2016, and we intend to present the entire study at the 90th Meeting of JES, Kyoto, Japan, 2017. The authors would like to thank the patients and staff for their cooperation and support.
CONFLICTS OF INTEREST
The authors declare that they have no conflicts of interest.


