Obesity Research

Open journal

ISSN 2377-8385

Association of Fat Mass and Obesity Associated, Dopamine Receptor Type 2 and Ankyrin Repeat and Kinase Domain Containing 1 Genes with Pediatric Obesity and Metabolic Risk: A Case-Control Study

Renata M. Pinto*, Jakeline S. Fortes, Rúbia V. Monteiro, Nygell S. Alves, Maria P. Curado, Lysa B. Minasi, Daniela de M e Silva and Aparecido D. da Cruz

Renata M. Pinto, PhD

Federal University of Goiás, Health Science Pos Graduation Program, Goiânia, GO, Brazil; E-mail: drarenatamachado@gmail.com

INTRODUCTION

Obesity is recognized by the World Health Organization (WHO) as one of the ten leading health problems in most diverse societies,1 and in 2019 chronic non-communicable diseases: obesity, diabetes, cancer, and cardiovascular diseases reached the second position in the ranking world of health challenges.2 The prevalence of obesity has increased worldwide, with epidemic proportions in many developed and developing countries.3,4 Currently, obesity is considered a neurobehavioral disease in which hypothalamic changes occur in the control of hunger, satiety, and energy expenditure.5 It is a condition of multifactorial etiology influenced by genetic, epigenetic, endocrine-metabolic, and behavioral factors.6,7

The regulation of food intake by the Central Nervous System (CNS) depends on the interaction of a homeostatic component that aims to balance energy and nutrients and a hedonic component, which seeks pleasure associated with food.8,9 The ingestion of highly palatable foods (rich in sugar and fats) can deregulate the homeostatic control of appetite, perpetuating the stimulus to eat, which makes the intake primarily mediated by hedonic and non-homeostatic needs.10

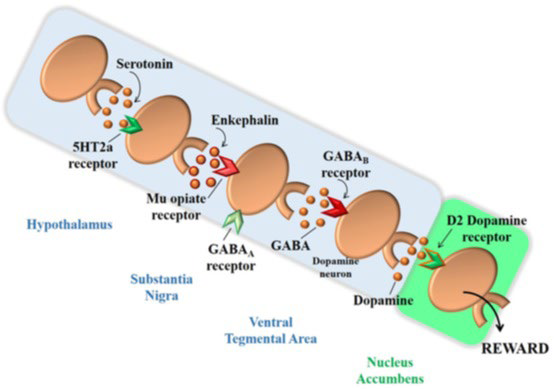
Cortico-limbic-striated structures and circuits form the Brain Reward System (BRS). BRS is activated by various stimuli that trigger a cascade of neurotransmitter secretion that ultimately releases dopamine (DA), bringing a sense of pleasure and leading the individual to seek positive reinforcements.10,11 The brain reward cascade starts in the hypothalamus, where serotonin acts as a neurotransmitter stimulating the enkephalin release, which in turn inhibits GABAergic neurons in the substantia nigra. These GABAergic neurons act in the fine adjustment of DA amount that will be released in the NAc, the brain reward site (Figure 1).12

Figure 1. Interaction of Various Neurotransmitters that forms the “Brain Reward Cascade

OROJ-8-145Fig1
Source: Pinto et al12

Considering that DA plays a crucial role in BRS, it is involved in eating behavior, and that genetic factors are responsible for up to 80% of the inter-individual variation of nutritional status,13 the study of genetic polymorphisms that affect the availability and secretion of DA have gained space in the literature.12

Dopamine Receptor Type 2 gene (rs6277) Polymorphism

The dopamine receptor type 2 (DRD2) is the main self-regulator of DA release in the brain reward dopaminergic system, with pre and postsynaptic effects.14

The DRD2 gene, located at 11q22-q23, has several polymorphisms capable of influencing the quantity and functionality of receptors in the membrane of the postsynaptic cell, which directly implies in the predisposition of individuals to seek any sub stance or behavior that stimulates BRS15 with a consequent higher propensity to gain weight in the future.16

The single nucleotide polymorphism (SNP) rs6277 of the DRD2 gene consists of the change of an Arginine (A) by Guanine (G) in the position 957pb in exon 7. There are only a few researches that studied this polymorphism from a metabolic point of view, but it is known that the presence of the risk allele (G) leads to a reduction in the affinity of the receptors and is associated with: psychiatric disorders related to the deficiency of dopaminergic function and processing of emotions,17 a greater sense of reward even in individuals of normal weight,18 higher consumption of sugar and increased body mass index (BMI) from normal to overweight/obesity in adults.19

Ankyrin Repeat and Kinase Domain Containing 1 gene (rs1800497) Polymorphism

The Ankyrin repeat and Kinase domain containing 1 gene (ANKK1) is also located in the 11q22-q23 region. It’s rs1800497 SNP interferes with the availability of DRD2 receptors and was considered part of the DRD2 gene itself, under the name of Taq1A polymorphism of the DRD2 gene.20 This SNP influences the signaling of DRD2 receptors: healthy individuals who have the risk allele (T) have a reduction of between 30-40% in the density of DRD2 in the striatum when compared to those without T-allele, and reduced glucose metabolism in the regions of BRS that contain dopaminergic neurons.20 This reduction in the BRS’s dopaminergic action reflects clinically in a higher risk of obesity in adults,16 greater weight gain,16 more intense reinforcement (feeling of pleasure) after a meal, and increased energy intake, especially in obese.21 There is a wide variation in genotype and allele frequencies in different countries, and even within the same country, there is inconsistency regarding the association or not with metabolic outcomes. Chart 1 shows the main results of these scientific researches.


Chart 1. Summary of Studies Carried Out in the Pediatric Population that Evaluated the rs1800497 Polymorphism of the ANKK1 gene
Reference Population Conclusion
Epstein et al84

26 Children from 8 to 12-years old with overweight and parents with obesity

Country: USA

Presence of the T allele associated with higher BMI and also weight modification after a weight loss program lasting 0.5 to 1-year.
Ergum et al85

Children

46 obese

50 eutrophic

Country: Turkey

There was no difference in the allelic distribution of the groups. The following

proportion was observed:

Obese: T- 51%, C- 49%

Eutrophic: T- 52% C- 48%

Stice et al16

44 female teenagers

Country: USA

Observation of MRI in a situation of food anticipation showed attenuated

response of the CNS of patients with the presence of the T allele.

Strien et al86

279 Adolescents

Country: Netherlands

Genotype frequency:

TT-2.9%; CT – 30.8%; CC – 66.3%

Allele frequency:

T -18.3%; C- 81.7%

The presence of the T allele increased the intake of emotional background

Duran-Gonzalez et al87

448 Adolescents

Country: USA

Genotype and allele frequency (%):

TT-15.2; CT- 46.5; CC- 38.3;

T-38.5; C- 61.5

T allele associated with central obesity

Araz et al42

200 pediatric patients aged 2 to 17 years.

50% obese 50% eutrophic

Country: Turkey

Genotypic and allele frequency (%) in Obese:

TT-7; CT-26; CC- 67

T-20; C – 80

Genotype and allele frequency (%) in Controls:

TT-4; CT-31; CC- 65

No association of T allele and BMI

Roth et al88

583 eutrophic adults

28 overweight children

423 children with obesity

Country: USA

n children, the following genotypic and allelic frequencies were found:

TT-2.4%; CT- 29.3%; CC- 68.3%

T- 17%; C- 83%

There was no association between elevated BMI with the presence of the T

allele; however, the TT genotype showed a worse response after a lifestyle

change program aimed at weight loss.

Pinto et al76 Pediatric patients from 5 to 16 years of age

55 obese

50 eutrophic

Country Brazil

Genotype and allele frequency (%) in the obese:

TT-14.5; CT-40; CC-45.5

T-34.5; C 65.5

Genotype and allele frequency (%) in controls:

TT-10; CT-26; CC-64

T-23 allele; C-77

T allele associated with obesity and alteration of glycemic homeostasis

Yeh et al77 84 teenagers of Asian origin

Country: USA

Genotype frequency (%)

TT + CT 63%; CC 37%

No difference in BMI, the presence of the T allele associated with increased

consumption of carbohydrates and fast food

Yobregon et al78 258 Pediatric patients aged 8 to 14 years

115 obese,

42 overweight,

101 eutrophic

Country: Chile

Genotype frequency (%)

TT-9.7; CT- 38.4; CC- 51.9

No difference in BMI, T allele associated with greater pleasure in eating in obese

boys.

Cartel et al79 286 Pediatric patients aged 7 to 12 years

Country: USA

Genotype frequency (%)

TT– 12.9; CT– 39.5; CC- 47.6

TT homozygotes reported 20% higher energy intake of carbohydrates, and

greater deposition of visceral fat.


Fat Mass and Obesity Associated gene (rs9939609) Polymorphism

The Fat Mass and Obesity Associated (FTO) gene, located at 16q12.2, encodes a 2-oxoglutarate-dependent demethylase involved in posttranslational modifications, deoxyribonucleic acid (DNA) repair, and fatty acid acidification.22 The presence of at least one risk allele (A) of this SNP is associated with higher caloric intake, less satiety, and a higher frequency of episodes of compulsive eating when compared with homozygotes for the wild allele (T).23,24,25,26

Currently, FTO is the gene that shows the most significant association with human polygenic obesity. After evaluating 3337 obese and 3159 controls, a recent meta-analysis study definitively confirms its correlation with obesity in European populations.27 The association of FTO with obesity has been confirmed in other ethnicities28 such as Asians29,30 and Hispanics.31,32,33 Few studies have evaluated this SNP in the Brazilian population, and only 7 have been carried out in the pediatric population of our country. Chart 2 shows the main findings of these studies.


Chart 2. Summary of Studies Conducted with Brazilian Children and Adolescents to Evaluate the rs9939609 Polymorphism of the FTO gene
Reference Population Conclusions
Silva et al59 N = 348

Age: 0-8-years

State: RS

Genotype and allele frequency (%)

AA- 16.4; AT- 46.3; TT- 37.4

A – 40; T- 60

Association with higher BMI and adiposity

Lourenco et al60 N = 1088
Age: 0-10-years
State: AM
Genotype frequency (%)

AA- 15.6; AT- 44.8; TT- 39.6

Association with weight gain

Pereira et al64 195 obese
153 eutrophic
State: MG
Allele frequency (%)

Obese: A- 49.5; T-50.5

Eutrophic: A- 46.7; T-53.27

There was no difference between groups

Reuter et al61 N = 406
Age: 7-17-years
State: RS
Genotype and allele frequency (%)

AA-13.3; AT-44.3; TT- 42.4

A – 35.5; T- 64.5

AA genotype associated with obesity/overweight

Nascimento et al62 136 obese

172 eutrophic

Age: 8-17-years

State: PR

Genotype and allele frequency (%)

Obese: AA- 14.7; AT- 46.3; TT- 38.9

Eutrophic: AA-9.9; AT-52.3; TT- 37.8

Allele A associated with lower AC reduction

after intervention with diet and exercise

Rodrigues et al65 378 obesos

378 eutrophic

Age:18-9-years

State: MA

Genotype and allele frequency (%)

Obese: AA -14.5; AT-44.9, TT-40.5 / A-36.8; T-63.2

Eutrophic: AA-13.5; AT- 47.9; TT-38.6 / A- 37.4;

T-62.6

There was no difference between groups

Todendi et al63 N = 871

Age: 7-17-years

State: RS

Allele A associated with increase in BMI
Legend: AC: Abdominal circumference; AM: Amazonas; BMI: Body mass index; MA: Maranhão; MG: Minas Gerais; PR: Paraná; RS: Rio Grande do Sul.


Recently Sun et al34 reviewed evidence that suggest a role of two common gene variants, FTO and ANKK1, in driving gene environment interactions leading to obesity, metabolic dysfunction, and cognitive change via their influence on DRD2 signaling. It was also demonstrated that the FTO protein regulates dopamine signaling via DRD2, and the polymorphisms rs9939609 of the FTO gene and rs18000497 of the ANKK1 gene interact.35 A study conducted in humans found that FTO risk variants affect the brain dopaminergic response and modify a pleasurable task’s learning. The FTO gene modulates the BRS connectivity, suggesting that the increased risk for obesity is related to the processing of the sensation of pleasure.35

OBJECTIVES

The main objective of this study is to investigate the relationship between pediatric obesity and the polymorphisms of the ANKK1 (rs18000497), DRD2 (rs6277) and FTO (rs9939609) genes, in a population of Brazilians. We also intend to correlate the studied polymorphisms with the degree of insulin sensitivity and cardiovascular risk factors (CRF) components of the metabolic syndrome (MS): Blood pressure (BP), Abdominal circumference (AC), Triglycerides (TG), High-density cholesterol (HDL) and blood glucose.

METHODS

This research is a Case-Control study carried out jointly by LaGene – Laboratory of Human Cytogenetics and Molecular Genetics of the Health Department of the State of Goiás (LaGene/Lacen/ SES-GO), NPR- Replicon Research Center (PUC-GO), and the Children’s Hospital of Goiânia/Child Endocrinology Office and Federal University of Goiás (LabMut/FG). The project was approved by the Research Ethics Committee of PUC Goiás, with the number: 16303313.4.0000.0037. All parents or guardians were interviewed and signed the informed consent form consenting with their child’s participation in the study and data for research. The researchers clarified the methodological research procedures before and during the study to all participants.

The study included pediatric patients from 5 to16-years of age who sought the pediatric endocrinology office of the Children’s Hospital of Goiânia (Goiânia-Goiás-Brazil) years 2017 and 2018. The responsible researcher was personally assessed in complete pediatric consultation with thorough anamnesis and physical examination. Exclusion criteria were: overweight, malnutrition, severe chronic diseases, presence of genetic syndromes, use of medications known to alter weight.

The nutritional status diagnosis was based on the BMI with interpretation according to the reference values proposed by WHO.36 According to the BMI, children were divided into two main groups: Obese (whose BMI was above +2 SD) and Eutrophic (whose BMI was between -2 SD and +1 SD) that constituted the control group.

The BP was evaluated according to the Hypertension Guidelines for children and Adolescents,37 which follows the values of the Consensus of the American Academy of Pediatrics.38 Arterial hypertension was considered if the systolic and/or diastolic blood pressure values were equal to or higher than the 95th percentile for sex, age, and height percentile on three or more occasions.37,38

The AC was measured at the midpoint between the last fixed rib (10th) and the iliac crest’s upper border. P90 was considered for age, sex, and ethnicity as the maximum value of normality, according to the values described by Freedman and collaborators.39

Biochemical Evaluation

After 8 to 12-hours of fasting, blood was collected to determine the lipid profile, blood glucose, and insulin. Through the equipment Architect c8000® Plasma total cholesterol, HDL-cholesterol, and TG were determined by enzymatic-colorimetric assay, and Glucose values were determined by the enzymatic method (Glucose Oxidase – Latest, SP, Brazil). Insulin was measured by the chemiluminescence technique using an immunometric immunoassay in a piece of automated equipment Architect i2000®.

The Brazilian Society of Pediatrics’ recommendation for the Brazilian pediatric population was used as the reference for serum lipids.40 The reference values for fasting blood glucose do not differ between children and adults, with typical values between 60 and 100 mg/dL, pre-diabetes between 101 and 125 mg/dL, and diabetes ≥ 126 mg/dL.41 Fasting insulinemia is considered normal from 2.5 to 25 mIU/mL in adults and up to 15 mIU/mL in children.42 The determination of fasting blood glucose and insulin in the same sample allows the calculation of the homeostatic model assessment insulin resistance (HOMA-IR) index, a method used to quantify insulin resistance (IR).43 The interpretation of HOMA-IR values followed the parameters established by de Almeida et al44 for the Brazilian pediatric population. HOMA was considered altered when the value was 2 standard deviations (SD) above the mean for age and sex.

According to the value of HOMA-IR, the main groups were subdivided into obese with insulin resistance (ORI) or insulin sensitivity (OSI) and eutrophic resistant (ERI) or sensitive (ESI) to insulin. According to the presence of two or more CRF, they were subdivided into metabolically unhealthy (MU) or metabolically healthy (MH) groups: OMU, OMH, EMU, EMH.

We choose to use the individualized evaluation of CRF and not the presence or absence of MS as there are no reference criteria for MS before ten-years of age, and even after that age, the criteria for MS remain controversial. More than 40 different cutoff points have already been used,45 and even after the consensus attempt by the International Diabetes Federation, there is still no consensus on which criteria should be used for the diagnosis of MS in adolescence.46 Thus, this research followed the American Academy of Pediatrics’s recommendation to focus on the CRF individually instead of focusing on the diagnosis of MS.47

Determination of the Genetic Polymorphisms

The polymorphisms of DRD2 and FTO genes were determined by the real-time polymerase chain reaction (PCR) method. The rs9939609 and rs6277 SNPs were genotyped using the TaqMan Real-Time PCR® kit (SNP Genotyping kit, from Applied Biosystems, USA), following the manufacturer’s concentration guidelines. This protocol included the primer oligonucleotide sequences and two fluorophore-labeled TaqMan® minor groove-binding (MGB) probes, named VIC® and FAM™.

To evaluate the polymorphism of the ANKK1 gene, the polymerase chain reaction-restriction fragment length polymorphisms (PCR-RFLP) strategy was used, using the restriction enzyme TaqIA whose cutting site contains an SNP C/T (C32806T), following the methodology proposed by Behravan et al.48

The Primers used were: GGTTCCTTGCGACTGCTGTGAATTT [T/A] GTGATGCACTTGGATAGTCTCTGTT (Sequence 5´→3´) for FTO; TCTTCTCTGGTTTGGCGGGGCTGTC [G/A] GGAGTGCTGTGGAGACCATGGTGGG (Sequence 5´→3´) for DRD2, and ACCCTTCCTGAGTGTCATCA (Forward) and ACGGCTGGCCAAGTTGTCTA (reverse) for ANKK1.

RESULTS

Two hundred twenty-six children and adolescents were evaluated, 124 (54.9%) had obesity, and 102 (45.1%) were eutrophic. The two groups were similar in age and sex distribution (49.2% were female in the obese group and 50.9% in the eutrophic group). Table 1 shows the clinical and biochemical parameters and the proportion of obese and eutrophic patients with altered parameters used for the main groups’ subdivision.


Table 1. Clinical and Biochemical Parameters Observed in the Obese and Eutrophic Groups
Variables Obese Eutrophic p value
Mean SD Mean SD
Age (years) 9.7 2.4 10.1 2.6 0.114
Weight (kg) 55.6 19.8 30.4 10.1 < 0.0001*
Height (cm) 142.7 13.6 135.3 15.7 0.121
Z-BMI 3.05 0.97 – 0.45 0.81 < 0.0001*
Mother´s BMI (kg/m2) 29.7 6.3 24,2 3.3 < 0.0001*
Father´s BMI (kg/m2) 32.4 6.9 26.9 4.7 0.003*
Glucose (mg/dL) 87.08 6.4 86.4 6.7 0.337
Insulin (µui/mL) 12.68 6.7 6.28 2.7 < 0.0001*
HOMA 2.77 1.53 1.32 0.6 < 0.0001*
TC (mg/dL) 170.34 29.9 162.05 26.5 0.13
HDL (mg/dL) 43.25 8.67 48.23 10.01 0.1
LDL (mg/dL) 107.19 29.02 97.37 24.08 0.186
TG (mg/dL) 94.18 44.57 73.65 27.12 < 0.0001*
Variables Obese N (%) Eutrophic N (%) p value
Altered Normal Altered Normal
TG 64 (51.6) 60 (48.4) 31 (30.4) 71 (69.6) 0.0012*
HDL 83 (66.9) 41 (33.1) 40 (39.2) 62 (60.8) 0,0003*
LDL 50 (40.3) 74 (59.7) 25 (24.5) 77 (75.5) 0.0119*
Glucose 2 (1.6) 122 (98.4) 1 (0.9) 101 (99.1) 0.679
BP 4 (3.2) 120 (96.8) 0 (0) 102 (100) NA
AC 107 (86.3) 17 (13.7) 0 (0) 102 (100) NA
MS# 83 (66.9) 41 (33.1) 24 (23.5) 78 (76.5) <0.0001*
Subgroup OMU OMH EMU EMH
HOMA 78 (62.9) 46 (37.1) 13 (12.7) 89 (87.3) <0.0001*
Subgroup ORI OSI ERI ESI
Total: N (%) 124 (100%) 102 (100%)
Legend: AC: Abdominal circumference; BMI: Body mass index; EIS: Eutrophic with insulin sensitivity; ERI: Eutrophic resistant to insulin resistance, EMH: Eutrophic metabolically healthy; EMU: Eutrophic metabolically unhealthy; HDL: High density cholesterol; LDL: Low density cholesterol; HOMA: Homeostatic Model Assessment Insulin Resistance; ORI: Obese resistant to insulin; OSI: Obese sensitive to insulin; OMH: Obese metabolically healthy; OMU: Obese metabolically unhealthy; BP: Blood pressure; MS: Metabolic syndrome; TC: Total cholesterol; TG: Triglycerides; ; SD: Standard deviation; Z-BMI: Z score of the BMI; # considering 2 or more parameters; *p level with statistical significance.


All patients were genotyped for the ANKK1 gene; however, due to an insufficient amount of DNA, two eutrophic and six children with obesity were not genotyped for the FTO and DRD2 genes. For the combined analyzes of the three genes, these eight patients were excluded.

There was no statistical difference between the obese and eutrophic groups in the allelic and genotypic distribution of the three genes studied (Table 2). The risk allele of the three genes was more frequent in the obese group concerning the eutrophic group, and the homozygous genotypes for the wild allele of the FTO and ANKK1 genes were more frequent in the eutrophic group, but none of these differences reached statistical significance.


Table 2. Genotypic and Allelic Distribution of FTO, DRD2 and ANKK1 genes in the Obese and Eutrophic Groups. (Risk alleles: FTO=A, DRD2=G, ANKK1= T)
Gene Obese N (%) Eutrophic N (%) X ² p value
FTO rs9939609
Genotypes
AA 25 (21.2) 15 (15) 1.38 0.500
AT 55 (46.6) 50 (50)
TT 38 (32.2) 35 (35)
Total 118 (100) 100 (100)
Alleles
A 105 (44.5) 80 (40) 0.89 0.344
T 131 (55.5) 120 (60)
Total 236 (100) 200 (100)
DRD2 rs6277
Genotypes
GG 43 (36.4) 29 (29) 1.594 0.450
AG 50 (42.4) 50 (50)
AA 25 (21.2) 21 (21)
Total 118 (100) 118 (100)
Alleles
G 136 (57.6) 108 (54) 0.577 0.4471
A 100 (42.4) 92 (46)
Total 236 (100) 200 (100)
ANKK1 rs1800497
Genotypes
TT 13 (10.5) 14 (13.7) 1.763 0.414
CT 45 (36.3) 29 (28.5)
CC 66 (53.2) 59 (57.8)
Total 124 (100) 102 (100)
Alleles
T 71 (28.6) 57 (28) 0.026 0.871
C 177 (71.4) 147 (72)
Total 248 (100) 204 (100)
Legend: A: Adenine; C: Cytosine; G: Guanine; T: Thymine.


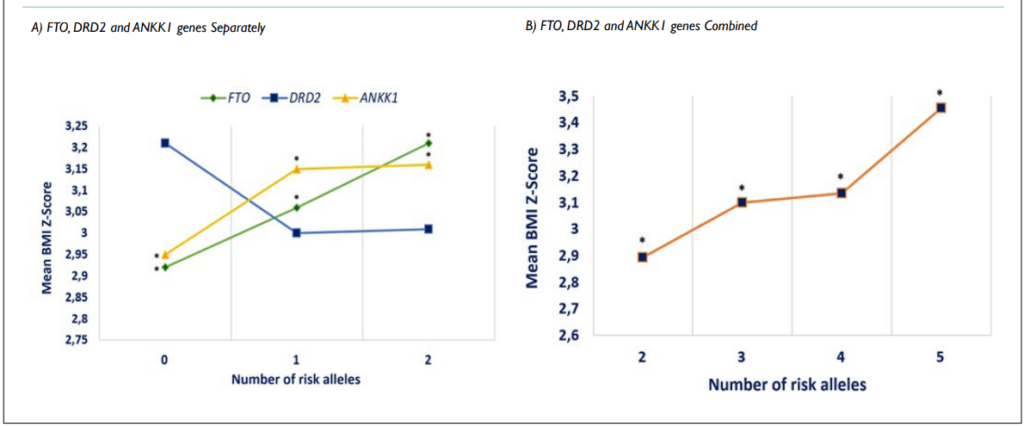
Table 3 and Figure 2 show the evolution of the mean Z Score of the BMI (Z-BMI) within the obese group, according to the number of risk alleles. In the combined evaluation of the three genes, the presence of 0, 1, and 6 risk alleles was disregarded due to the small number of patients. The highest number of risk alleles correlated with a higher Z-BMI for the FTO and ANKK1 genes individually and in the sum of the three genes studied, showing an upward curve of the lowest number of alleles and a lower Z-BMI for the highest number of alleles and higher Z-BMI (Figure 2), with a statistically significant difference for all ranges of the number of risk alleles considered.


Table 3. Mean BMI Z score in the Obese Group, According to the Number of Risk Alleles of the FTO, DRD2 and ANKK1 Genes Individually and of the 3 Genes Combined
Number of Risk Alleles Mean Z-BMI SD p value
FTO rs9939609
0 (TT) 2.92 0.68 0.000*
1 (AT) 3.06 1.09 0.000*
2 (AA) 3.21 1.05 0.000*
DRD2 rs6277
0 (AA) 3.21 1.12 0.453
1 (AG) 3.00 1.05 0.574
2 (GG) 3.01 0.76 0.404
ANKK1 rs1800497
0 (CC) 2.95 0.84 0.000*
1 (CT) 3.15 1.17 0.000*
2 (TT) 3.16 0.76 0.000*
FTO+DRD2+ANKK1
2 2.89 0.93 0.000*
3 3.09 1.08 0.000*
4 3.13 1.09 0.000*
5 3.45 0.64 0.000*
Legend: A: Adenine; C: Cytosine; G: Guanine; SD: Standard deviation; T: Thymine; Z-BMI: Z score of the BMI; * p level with statistical significance.


Figure 2. Mean BMI Z-Score in the Obese group According to the Number of Risk Alleles of the FTO, DRD2 and ANKK1 Genes

OROJ-8-145Fig2


Subgroups According to Insulin Sensitivity Criteria

Table 4 shows the genotypic and allelic distribution of the FTO, DRD2 and ANKK1 genes in the subgroups that were divided according to insulin sensitivity criteria: ORI, OSI, ERI, and ESI.


Table 4. Genotypic and Allelic Distribution of FTO, DRD2 and ANKK1 genes in the Groups: ORI (Obese Resistant to Insulin), OSI (Obese Sensitive to Insulin), ERI (Eutrophic Resistant to Insulin Resistance) and ESI (Eutrophic Sensitive to Insulin)
Gene ORI N (%) OSI N(%) ERI N(%) ESI N(%) X ² p value
FTO rs9939609
Genotypes
AA 15 (20) 10 (23.3) 5 (38.5) 10 (11.5) 7.15 a0.039
AT 36 (48) 19 (44.2) 5 (38.5) 45 (51.7)
TT 24 (32) 14 (32.5) 3 (23) 32 (36.8)
AA+AT 51 (68) 29 (67.5) 10 (77) 55 (63.2) 1.14 0.765
TT 24 (32) 14 (32.5) 3 (23) 32 (36.8)
Total 75 (100) 43 (100) 13 (100) 87 (100)
Alleles
A 66 (44) 39 (45.3) 15 (57.7) 65 (37.4) 4.76 a0.048
T 84 (56) 47 (54.7) 11 (42.3) 109 (62.6)
Total 150 (100) 86 (100) 26 (100) 174 (100)
DRD2 rs6277
Genotypes
GG 27 (36) 16 (37.2) 5 (38.5) 24 (27.6) 6.54 0.3649
AG 28 (37.3) 22 (51.2) 5 (38.5) 45 (51.7)
AA 20 (26.7) 5 (11.6) 3 (23) 18 (20.7)
GG+AG 55 (73.3) 38 (88.4) 10 (77) 69 (79.3) 3.75 0.289
AA 20 (26.7) 5 (11.6) 3 (23) 18 (20.7)
Total 75 (100) 43 (100) 13 (100) 87 (100)
Alleles
G 82 (54.7) 54 (62.8) 15 (57.7) 93 (53.4) 2.20 0.530
A 68 (45.3) 32 (37.2) 11 (42.3) 81 (46.6)
Total 150 (100) 86 (100) 26 (100) 174 (100)
ANKK1 rs1800497
Genotypes
TT 9 (11.5) 4 (8.7) 2 (15.4) 12 (13.5) 2.18 0.414
CT 28 (35.9) 17 (37) 3 (23.1) 26 (29.2)
CC 41 (52.5) 25 (54.3) 8 (61.5) 51 (57.3)
TT+CT 37 (47.5) 21 (45.7 5 (38.5) 38 (42.7) 0.60 0.895
CC 41 (52.5) 25 (54.3) 8 (61.5) 51 (57.3)
Total 78 (100) 46 (100) 13 (100) 89 (100)
Alleles
T 46 (29,5) 25 (27,2) 7 (26,9) 50 (28,1) 0.19 0.978
C 110 (70,5) 67 (72,8) 19 (73,1) 128 (71,9)
Total 156 (100) 92 (100) 26 (100) 178 (100)
Legend: A: Adenine; C: Cytosine; EIS: Eutrophic with insulin sensitivity; ERI: Eutrophic resistant to insulin; G: Guanine; ORI: Obese resistant to insulin; OSI: Obese sensitive to insulin; T: Thymine; a – p value in the comparison between ERI and ESI.


Regarding the FTO gene, in the eutrophic subgroups, the wild homozygous genotype (TT) was more prevalent in the insulin-sensitive group-ESI than in the insulin-resistant group-ERI (36.8×23%, p=0.039). The risk allele (A) was more prevalent in the ERI group (57.7%) than in the ESI group (37.4%), with an odds ratio (OR) of 2.29 for IR when the A allele was present (p=0.048).

Regarding the DRD2 gene, we did not observe any statistically significant difference in the evaluation of the groups together or separately.

Regarding the ANKK1 gene: the ERI group showed a higher proportion of the homozygous genotype for the risk allele (TT) when compared to ESI (15.4%×13.5%, p<0.00001).

Subgroups According to the Metabolic Health Criteria

The evaluation of the genotypic and allelic distribution of the FTO, DRD2 and ANKK1 genes in the groups subdivided according to the CRF number is shown in Table 5.


Table 5. Genotypic and Allelic Distribution of the FTO, DRD2 and ANKK1 Genes in the Groups: OMU (Obese MetaBolically Unhealthy), OMH (Obese Metabolically Healthy), EMU (Eutrophic Metabolically Unhealthy) and EMH (Eutrophic Metabolically Healthy)
Gene OMU N (%) OMH N(%) EMU N(%) EMH N(%) X ² p value
FTO rs9939609
Genotypes
AA 12 (15.4) 13 (32.5) 4 (17.4) 11 (14.3) 9.88 a0.020
AT 43 (55.1) 12 (30) 12 (52.2) 38 (49.3)
TT 23 (29.5) 15 (37.5) 7 (30.4) 28 (36.4)
AA+AT 55 (70.5) 25 (62.5) 16 (69.6) 49 (63.6) 1.23 0.745
TT 23 (29.5) 15 (37.5) 7 (30.4) 28 (36.4)
Total 78 (100) 40 (100) 23 (100) 77 (100)
Alleles
A 67 (42.9 38 (47.5) 20 (43.5) 67 (42.9) 1.63 0.650
T 89 (57.1) 42 (52.5) 26 (56.5) 89 (57.1)
Total 156 (100) 80 (100) 46 (100) 154 (100)
DRD2 rs6277
Genotypes
GG 28 (35.9) 15 (37.5) 7 (30.4) 22 (28.6) 6.54 0.3649
AG 38 (48.7) 12 (30) 12 (52.2) 38 (49.4)
AA 12 (15.4) 13 (32.5) 4 (17.4) 17 (22)
GG+AG 66 (84.6) 27 (67.5) 19 (82.6) 60 (88) 3.75 0.289
AA 12 (15.4) 13 (32.5) 4 (17.4) 17 (22)
Total 78 (100) 40 (100) 23 (100) 77 (100)
Alleles
G 94 (60.3) 42 (52.5) 26 (56.5) 82 (53.2) 2.02 0.567
A 62 (39.7) 38 (47.5) 20 (43.5) 72 (46.8)
Total 156 (100) 80 (100) 46 (100) 154 (100)
ANKK1 rs1800497
Genotypes
TT 49 (59) 4 (9.8) 5 (20.8) 44 (56.4) 9.01 b0.031
CT 25 (30.1) 20 (48.8) 4 (16.7) 25 (32.1)
CC 9 (10.9) 17 (41.4) 15 (62.5) 9 (11.5)
TT+CT 34 (41) 24 (58.5) 9 (37.5) 34 (53.6) 4.18 0.242
CC 49 (59) 17 (41.5) 15 (62.5) 44 (46.4)
Total 83 (100) 41 (100) 24 (100) 78 (100)
Alleles
T 43 (25.9) 28 (34.1) 14 (29.2) 43 (27.6) 0.9 0.591
C 123 (74.1) 54 (65.9) 34 (70.8) 113 (72.4)
Total 166 (100) 82 (100) 48 (100) 156 (100)
Legend: A: Adenine; C: Cytosine; EMH: Eutrophic metabolically healthy; EMU: Eutrophic metabolically unhealthy; G: Guanine; OMH: Obese metabolically healthy; OMU: Obese metabolically unhealthy; T: Thymine; a – p value in the comparison between OMU and OMH, b – p value in the comparison between OMH e EMU.


Regarding the FTO gene, in the evaluation of the obese subgroups, we observed that the wild homozygous (TT) genotype is present in 37.5% of the metabolically healthy group (OMH) and 29.5% of the metabolically sick group (OMU) (p=0.02).

Regarding the DRD2 gene, in the evaluation of the obese subgroups, the homozygous genotype for the non-risk allele (AA) is more prevalent in the healthy subgroup – OMH than in the subgroup with two or more CRF-OMU (32.5%×15.4%, p=0.053). In patients with obesity, the genotypes with the presence of the risk allele of the DRD2 gene (GG+AG) increased the risk for metabolic disease by 2.65 times (p=0.031).

Regarding the ANKK1 gene, when we compared the “healthy obese” group with the “unhealthy eutrophic” group, we observed that the homozygous genotype for the risk allele (TT) was twice as frequent in the EMU group as in the OMH group (20.8%×9.8%, p=0.031).

DISCUSSION

The polygenic nature of common obesity discovers risky genes and their variants a challenging task. Genome-Wide Association Study (GWAS) studies have brought new insights into the understanding of polygenic obesity, but even today, specific genes’ contribution to BMI variability is still poorly understood.6 No GWAS study has included the Brazilian population, and studies in the pediatric age group are scarce. Although carried out with a small number of patients and with groups composed following the simple random sampling strategy without replacement, the present research contributed to the knowledge of genetic factors that interfere in the phenotype of pediatric obesity in Brazilians.

The presence of higher-levels of parent’s BMI of the obese children corroborates studies that indicate a vital genetic component in human obesity.49,50,51 In addition to the genetic factor, these children live in the same environment as their family, therefore, they are exposed to their lifestyle. It is known that children whose both parents are obese have an 80% possibility of being obese, 50% when one parent is obese, and 9% when the parents are not obese.52 It is worth mentioning that the father’s average BMI is above normal in both groups. The group of eutrophic children has overweight fathers, a fact consistent with the advancement of overweight and obesity in Brazilians, which affects 56.9% of the adult population.53

Both obese and eutrophic groups had similar blood glucose levels. The obese group, however, showed higher-levels of insulin and HOMA-IR. These insulin sensitivity changes are attributed to obesity per se, which is a significant risk factor for diabetes mellitus (DM) type 2. The worsening of the situation of the pancreatic malfunction is related to obesity evolves to DM.54,55,56

We observed that TG levels were higher in the obese group, an expected result since these children also had elevated insulin and HOMA. Hypertriglyceridemia is a pervasive alteration in patients with obesity and is related to insulin resistance: obese patients with IR, even without DM2 installed, have selective hepatic IR: insulin cannot suppress hepatic glucose production while continuing to perpetuate lipogenesis, resulting in hypertriglyceridemia.57,58

The other lipid profile parameters, the mean TC, high-density cholesterol (HDL), and low-density cholesterol (LDL), did not show a statistical difference. The mean levels of TC and LDL were higher in the obese group but still within the normal range, while the mean value of HDL was lower in the obese group and was in the sub-normal range. When assessing the number of individuals in each group with LDL and HDL outside the normal range (Table 1), a significantly higher proportion of obese people was in this condition. Indeed, a similar means between the obese and eutrophic groups might be due to the presence of 33.1% of “Healthy Obese” (OMH group) and 23.5% of “Sick Eutrophic,” also called “false thin” or “obese eutrophic,” that composed the EMU group.

It was observed that the risk allele of the three genes was more frequent in the obese group and that the homozygous genotype for the non-risk allele of the FTO and ANKK1 genes was more frequent in the eutrophic, but none of these differences reached statistical significance. The small number of participants evaluated may justify the lack of statistical significance.

When evaluating the effect of the presence of the risk alleles within the obese group, we observed that the higher the number of risk alleles, the greater the Z-BMI for the FTO and ANKK1 genes alone, and in the sum of the 3 genes studied. The upward curve of the lowest number of alleles and lowest Z-BMI for the highest number of alleles and the highest Z-BMI, with a statistically significant difference for all ranges of the number of risk alleles considered, indicate that the studied polymorphisms have an additive effect on the outcome of childhood-onset obesity. This result is unprecedented in the literature.

Considerations Regarding the FTO gene rs9939609

The rs9930506 polymorphism of the FTO gene is the SNP that shows the most significant association with human polygenic obesity: a recent meta-analysis study after evaluating 3337 obese and 3159 controls confirms its correlation with obesity in European populations.27 Few studies have evaluated this SNP in the Brazilian population, and only seven were carried out in the pediatric population of our country, five have found an association with adiposity59,60,61,62,63 and 2 showed no difference between patients with or without obesity.64,65

Our study showed that in the Eutrophic group, the presence of wild homozygous genotype (TT) associates with insulin sensitivity, and the presence of the risk allele (A) associates with an increase of 2, 29 times in the risk for IR. This SNP has already been associated with insulin sensitivity changes in insulin sensitivity.66 but this is the first time this result is presented in Brazilian children. Within the obese group, the TT genotype was more frequent in the OMH group (37.5%) than in the OMU group (29.5%); this difference is statistically significant, so we can say that the T allele is associated with the absence of CRF, which can be considered a protective factor within the obese group, a result also unprecedented in the literature for the Brazilian population.

Considerations Regarding the DRD2 gene rs6277

The rs6277 is a poorly studied SNP: only six scientific studies have evaluated the rs6277 variant of the DRD2 gene in children or adolescents to assess cognitive control and behavioral nuances67,68,69,70,71 and choke risk.72

From the metabolic point of view, the rs6277 polymorphism of the DRD2 gene was evaluated in only four articles, all performed in adults. This SNP was associated with compulsive eating disorder,17,18 weight gain,19 and higher sugar consumption.73,74 The prevalence of the GG genotype varied between 12 and 21% in these studies. Our series found a higher frequency of genotypes with the risk allele (G), GG-36.4 and 29%, AG-42.4%, and 50% in obese and eutrophic individuals respectively, and AA – 21% for both groups. The highest frequency of the G allele found in our study is probably due to the great miscegenation of the Brazilian population, data corroborated by the 1000 Genome Project,75 which shows a frequency of the G allele of 12.5% in Europeans, 8% in Asians, and 93% in Africans.

Ramos-Lopez et al73 associated the GG genotype with significantly higher-levels of TG in adults. The present study associated the G allele of the SNP rs 6277 of the DRD2 gene with CRF in obese children and adolescents, which was an unprecedented result in the literature.

Considerations Regarding the ANKK1 gene rs1800497

We observed that the frequency of the homozygous genotype for the wild allele (CC) was slightly higher in the eutrophic group (57.8%) than in the obese group (53.2%). However, there was no statistically significant difference in the allelic or genotypic distribution. This result disagrees with a previous study carried out by our team that found an association of the T-allele with the presence of obesity in children.74,75 However, when assessing the evolution of the mean Z-BMI in the obese group, we observed that the higher the number of risk alleles, the higher the Z-BMI, corroborating the previous finding that the T allele is associated with increased BMI.

Few studies have been carried out to verify the association of the rs1800497 polymorphism of the ANKK1 gene in children and adolescents. A considerable variation in allele frequencies was observed in the literature, even within populations of the same country, and inconsistency regarding the association with metabolic outcomes.12,76,77,8,79

In evaluating the subgroups using the HOMA values criterion, the risk allele’s homozygous genotype (TT) was associated with insulin resistance in eutrophic individuals. This result corroborates the finding of previous research carried out by our group, which for the first time in the literature, associated the T-allele of the ANKK1 gene with alteration of glycemic homeostasis.76

Clinical and animal studies evidence the relationship between DRD2 receptors and glucose metabolism. Clinical research conducted in diabetic patients80 and animal study81 demonstrated improved glycemic control using Bromocriptine, a dopaminergic agonist that acts via DRD2 receptors. In 2005, RUBI et al82 demonstrated for the first time that DRD2 receptors are expressed in the pancreatic beta-cell and modulate insulin secretion. A study carried out in knockout rats for the DRD2 gene revealed that DRD2 receptors play a crucial role in insulin secretion and glycemic homeostasis; rats with no DRD2 receptor showed a failure in insulin response in the face of glucose overload, higher fasting glucose, glucose intolerance, and reduced beta-cell mass.83 Such results show that DRD2 is essential for the proliferation of beta cells and insulin secretion and can be considered a growth factor essential for glycemic homeostasis.83

Regarding the presence of CRF, the risk allele of the ANKK1 gene was associated with the presence of two or more CRF, as shown by the presence of the homozygous risk genotype (TT) in 20.8% of EMU and only 9.8% of OMH, a result also found to be unprecedented in the literature.

CONCLUSION

In conclusion, our results found that the risk alleles of the FTO, DRD2 and ANKK1 genes interfered with the outcome of pediatric obesity in Brazilian children:

• The higher number of the risk alleles of FTO and ANKK1 genes and the 3 genes combined significantly increased the mean Z-BMI of the obese group.

• The risk alleles of the FTO and ANKK1 genes were positively associated with IR in eutrophic children.

• The T allele of the FTO gene has a protective effect against CRF in children with obesity

• The risk alleles of the DRD2 and ANKK1 genes conferred a higher risk of CRF in children with obesity and normal weight, respectively.

For being a case-control, our findings cannot ascribe causality, only association. Further studies are needed, with a more significant number of patients and longitudinal follow-up, to confirm the possible causality between the risk alleles and our findings.

It is hoped that in the future, more excellent knowledge of the specific contribution of each genetic variant will be a useful tool in clinical practice, being able to guide preventive measures and specific treatment according to genetic risk scores.

ACKNOWLEDGEMENTS

This research was supported by grants of CAPES and FAPEG/ DECID/MS

• RMP and ADC designed the research (project conception, development of overall research plan, and study oversight).

• RMP conducted the clinical evaluation JSF, RVM, and LBM conducted the genetic protocols (hands-on conduct of the experiments).

• RMP, LBM, and ADC analyzed data or performed statistical analysis.

• RMP, MPC, and ADC interpreted data findings.

• RMP, JSF, MPC, and ADC wrote the paper.

• RMP and ADC had primary responsibility for final content. All authors have read and approved the final manuscript.

CONFLICTS OF INTEREST

The authors declare that they have no conflicts of interest.

1. World Health Organization (WHO). Obesity preventing and managing the global epidemic. Report of a WHO Consultation (WHO Technical Report Series 894). 2000. Website. https://www. who.int/nutrition/publications/obesity/WHO_TRS_894/en/. Accessed April 10, 2020.

2. World Health Organization (WHO). Ten threats to global health in 2019. Website. https://www.who.int/news-room/spotlight/ten-threats-to-global-health-in-2019. Accessed April 10, 2020.

3. NG M, Fleming T, Robinson M, Thomson B, Graetz N, Margono C, et al. Global, regional, and national prevalence of overweight and obesity in children and adults during 1980-2013: Asystematic analysis for the Global Burden of Disease Study 2013. Lancet. 2014; 30: 766-781. doi: 10.1016/S0140-6736(14)60460-8

4. Weihrauch-Blüher S, Schwarz P, Klusmann J-H. Childhood obesity: increased risk for cardiometabolic disease and cancer in adulthood. Metabolism. 2019; 92: 147-152. doi: 10.1016/j.metabol.2018.12.001

5. O’Rahilly S, Farooqi IS. Human obesity: A heritable neurobehavioral disorder that is highly sensitive to environmental conditions. Diabetes. 2008; 57: 2905-2910. doi: 10.2337/db08-0210

6. Pinto RM, Steinmetz LS, Barbosa JMG, Mendes AFCS, Curado MP, da Cruz AD. The role of genetics in the pathophysiology of obesity: A systematic review. Obes Res Open J. 2019; 6(1):11-17.

7. Larqué E, Labayen I, Flodmark C-E, Lissau I, Czernin S, Moreno LA, et al. From conception to infancy — early risk factors for childhood obesity. Nat Rev Endocrinol. 2019; 15: 456-478. doi: 10.1038/s41574-019-0219-1

8. Schwartz MW, Seeley RJ, Zeltser LM, Drewnowski A, Ravussin E, Redman LM, et al. Obesity pathogenesis: An endocrine society scientific statement. Endocr Rev. 2017; 38 (4): 267-296. doi: 10.1210/er.2017-00111

9. Oussaadaa SM, van Galena KA, Cooimanb MI, Kleinendorstc L, Hazebroekb EJ, van Haelst MM, et al. The pathogenesis of obesity. Metabolism. 2019; 92: 26-36. doi: 10.1016/j.metabol.2018.12.012

10. Gordon EL, Ariel-Donges AH, Bauman V, Lisa J Merlo. What Is the Evidence for “Food Addiction?” A Systematic Review. Nutrients. 2018; 10(4): 477. doi: 10.3390/nu10040477

11. King BM. The modern obesity Epidemic, ancestral huntergatherers, and the sensory/reward control of food intake. Am Psychol. 2013; 68(20): 88-96. doi: 10.1037/a0030684

12. Pinto RM, Cominetti C, da Cruz AD. Basic and genetic aspects of food intake control and obesity: Role of dopamine receptor D2 TAQIA polymorphism. Obes Res Open J. 2016; 2(4): 119-127. doi: 10.17140/OROJ2-119

13. Böttcher Y, Körner A, Kovacs P, Kiess W. Obesity genes: Implication in childhood obesity. Pediatrics and Child Health. 2011; 22(1): 31-36. doi: 10.1016/j.paed.2011.08.009

14. Ford CP. The role of D2-autoreceptors in regulating dopamine neuron activity and transmission. Neuroscience. 2014; 282(12): 13-22. doi: 10.1016/j.neuroscience.2014.01.025

15. Blum K, Chen ALC, Giordano J, Borsten J, Chen TJH, Hauser M, et al. The addictive brain: All roads lead to dopamine. J Psychoactive Drugs. 2012; 44(2): 134-143. doi: 10.1080/02791072.2012.685407

16. Stice E, Yokum S, Bohon C, Marti N, Smolen A. Reward circuitry responsivity to food predicts future increases in body mass: moderating effects of DRD2 and DRD4. Neuroimage. 2010; 50: 1618-1625. doi: 10.1016/j.neuroimage.2010.01.081

17. Davis C, Levitan RD, Yilmaz Z, Kaplan AS, Carter JC, Kennedy JL. Binge eating disorder and the dopamine D2 receptor: Genotypes and sub-phenotypes. Prog Neuropsychopharmacol Biol Psychiatry. 2012; 38: 328-335. doi: 10.1016/j.pnpbp.2012.05.002

18. Davis C, Levitan RD, Kaplan AS, Carter J, Reid C, Curtis C, et al. Reward sensitivity and the D2 dopamine receptor gene: A casecontrol study of binge eating disorder. Prog Neuropsychopharmacol Biol Psychiatry. 2008; 32(3): 620-628. doi: 10.1016/j.pnpbp.2007.09.024

19. Kvaløy K, Holmen J, Hveem K, Holmen TL. Genetic effects on longitudinal changes from healthy to adverse weight and metabolic status—The HUNT Study. PLoS One. 2015; 10(10): e0139632. doi: 10.1371/journal.pone.0139632

20. Gluskin B, Mickey BJ. Genetic variation and dopamine D2 receptor availability: A systematic review and meta-analysis of human in vivo molecular imaging studies. Transl Psychiatry. 20016; 6(3): e747. doi: 10.1038/tp.2016.22

21. Epstein LH, Temple JL, Neaderhiser BJ, Salis RJ, Erbe RW, Leddy JJ. Food reinforcement, the dopamine D2 receptor genotype, and energy intake in obese and nonobese humans. Behav Neurosci. 2007; 121: 877-886. doi: 10.1037/0735-7044.121.5.877

22. Clifton IJ, McDonough MA, Ehrismann D, Kershaw NJ, Granatino N, Schofield CJ. Structural studies on 2-oxoglutarate oxygenases and related double-stranded beta-helix fold proteins. J Inorg Biochem. 2006; 100: 644-669. doi: 10.1016/j.jinorgbio.2006.01.024

23. Speakman JR, Rance KA, Johnstone AM. Polymorphisms of the FTO gene are associated with variation in energy intake, but not energy expenditure. Obesity (Silver Spring). 2008; 16: 1961-1965. doi: 10.1038/oby.2008.318

24. Haupt A, Thamer C, Staiger H, Tschritter O, Kirchhoff K, Machicao F, Häring H-U, et al. Variation in the FTO gene influences food intake but not energy expenditure. Exp. Clin. Endocrinol. Diabetes. 2009; 117: 194-197. doi: 10.1055/s-0028-1087176

25. Tanofsky-Kraff M, Han JC, Anandalingam K, Shomaker LB, Columbo KM, Wolkoff LE, et al. The FTO gene rs9939609 obesity-risk allele and loss of control overeating. Am J Clin Nutr. 2009; 90: 1483-14889. doi: 10.3945/ajcn.2009.28439

26. Wardle J, Llewellyn C, Sanderson S, Plomin R. The FTO gene and measured food intake in children. Int J Obes. 2009; 33: 42-45. doi: 10.1038/ijo.2008.174

27. Doaei S, Jarrahi SAM, Moghadam AS, Akbari ME, Kooshesh SJ, Badeli M, et al. The effect of rs9930506 FTO gene polymorphism on obesity risk: a meta-analysis. Biomol Concepts. 2019; 10: 237-242. doi: 10.1515/bmc-2019-0025

28. Jacobsson JA, Schiöt HB, Fredriksson R. The impact of intronic single nucleotide polymorphisms and ethnic diversity for studies on the obesity gene FTO. Obes Ver. 2012; 13: 1096-1109. doi: 10.1111/j.1467-789X.2012.01025.x

29. Cha SW, Choi SM, Kim KS, Park BL, Kim JR, Kim JY, et al. Replication of genetic effects of FTO polymorphisms on BMI in a Korean population. Obesity (Silver Spring). 2008; 16: 2187-2189. doi: 10.1038/oby.2008.314

30. Hong KW, Oh B. Recapitulation of genome-wide association studies on body mass index in the Korean population. Int J Obes. 2012; 36: 1127-1130. doi: 10.1038/ijo.2011.202

31. Villalobos-Comparán M, Flores-Dorantes MT, VillarrealMolina MT, Rodríguez-Cruz M, García-Ulloa AC, Robles L, et al. The FTO gene is associated with adulthood obesity in the Mexican population. Obesity (Silver Spring). 2008; 16: 2296-2301. doi: 10.1038/oby.2008.367

32. Wing MR, Ziegler J, Langefeld CD, Ng MCY, Haffner SM, Norris JM, et al. Analysis of FTO gene variants with measures of obesity and glucose homeostasis in the IRAS Family Study. Hum Genet. 2009; 125: 615-626. doi: 10.1007/s00439-009-0656-3

33. Dong C, Beecham A, Slifer S, Wang L, McClendon MS, Blanton SH, et al. Genome-wide linkage and peak-wide association study of obesity-related quantitative traits in Caribbean Hispanics. Hum Genet. 2011; 129: 209-219. doi: 10.1007/s00439-010-0916-2

34. Sun X, Luquet S, Small DM. DRD2: Bridging the genome and ingestive behavior. Trends Cogn Sci. 2017; 21 (5): 372-384. doi: 10.1016/j.tics.2017.03.004

35. Sevgi M, Rigoux L, Kühn AB, Mauer J, Schilbach L, Hess ME, et al. An obesity-predisposing variant of the FTO gene regulates D2R-dependent reward learning. J Neurosci. 2015; 35 (36): 12584- 12592. doi: 10.1523/JNEUROSCI.1589-15.2015

36. World Health Organization (WHO). Physical Status: the use and interpretation of antropometr, report of a WHO expert committee. 1995. Website. https://apps.who.int/iris/handle/10665/37003. Accessed April 10, 2021.

37. Bresolin NL. Hipertensão arterial na infância e adolescência: Manual de Orientação do Departamento Científico de Nefrologia [In: Portuguese]. Rio de Janeiro: Sociedade Brasileira de Pediatria. 2019.

38. Flynn JT, Kaelber DC, Baker-Smith CM, Blowey D, Carroll AE, Daniels SR, et al. Clinical practice guideline for screening and management of high blood pressure in children and adolescents. Pediatrics. 2017; 140 (3): e20171904. doi: 10.1542/peds.2017-1904

39. Freedman DS, Serdula MK, Srinivasan SR, Berenson GS. Relation of circumferences and skinfold thicknesses to lipid and insulin concentrations in children and adolescents: The bogalusa heart study. Am J Clin Nutr. 1999; 69: 308-317. doi: 10.1093/ajcn/69.2.308

40. Sociedade Brasileira de Pediatria (SBP). Guia pratico de avaliação: Novas orientações sobre o jejum para determinação laboratorial do perfil lipídico [In: Portuguese]. Sociedade Brasileira de Pediatria. 2017

41. American Diabetes Association. Children and adolescentes: standards of medical care in diabetes. Diabetes Care. 2018; 41(Suppl 1): S126-S136. doi: 10.2337/dc18-S012

42. Araz NC, Nacak M, Balci SO, Benlier N, Araz M, Pehlivan S, et al. Childhood obesity and the role of dopamine D2 receptor and cannabinoid receptor-1 gene polymorphisms. Genet Test Mol Biomarkers. 2012; 16(12): 1408-1412. doi: 10.1089/gtmb.2012.0244

43. Matthews DR, Hosker JP, Rudenski AS, Naylor BA, Treacher DF, Turner RC. Homeostasis model assessment: insulin resistance and beta-cell function from fasting plasma glucose and insulin concentrations in man. Diabetologia. 1985; 28: 412-419. doi: 10.1007/BF00280883

44. de Almeida CAN, Pinho AP, Ricco RG, Pepato, Iguatemy Lourenço Brunetti. Determination of glycemia and insulinemia and the homeostasis model assessment (HOMA) in schoolchildren and adolescents with normal body mass index. J Pediatr (Rio J). 2008; 84(2): 136-140. doi: 10.2223/JPED.1767

45. Ford ES, Li C. Defining the metabolic syndrome in children and adolescents: will the real definition please stand up? J Pediatr. 2008; 152(2): 160-164. doi: 10.1016/j.jpeds.2007.07.056

46. Zimmet P, Mm Alberti KG, Kaufman F, Tajima N, Silink M, Arslanian S, et al. The metabolic syndrome in children and adolescents – an IDF consensus report. Pediatr Diabetes. 2007; 8(5): 299- 306. doi: 10.1111/j.1399-5448.2007.00271.x

47. Magge SN, Goodman E, Armstrong SC, COMMITTEE ON NUTRITION; SECTION ON ENDOCRINOLOGY; SECTION ON OBESITY. The metabolic syndrome in children and adolescents: Shifting the focus to cardiometabolic risk factor clustering. Pediatrics. 2017; 140(2): e20171603. doi: 10.1542/peds.2017- 1603

48. Behravan J, Hemayatkar M, Toufani H, Abdollahian E. Linkage and association of DRD2 gene TaqI polymorphism with schizophrenia in an Iranian population. Arch Iran Med. 2008; 11(3): 252- 256.

49. Bouchard C. The genetics of human obesity. In: Handbook of Obesity. Nova York, USA: Marcel Dekker; 1998.

50. Rankinen T, Pérusse L, Weisnagel SJ, Snyder EE, Chagnon YC, Bouchard C. The human obesity gene map: The 2001 update. Obes Res. 2002; 10(10): 196-243. doi: 10.1038/oby.2002.30

51. Hainer V, Zamrazilová H, Spálová J, Hainerová I, Kunesová M, Aldhoon B, et al. Role of hereditary factors in weight loss and its maintenance. Physiol Res. 2008; 57(s. 1): S1-S15. doi: 10.33549/physiolres.931485

52. Borgeson M. The aetiology of obesity in children . A study of 101 twin pairs. Acta Paediatr. Scand. 1976; 65(3): 279-287. doi: 10.1111/j.1651-2227.1976.tb04887.x

53. Instituto Brasileiro de Geografia e Estatística (IBGE). Pesquisa Nacional de Saúde 2013 Ciclos de vida Brasil e Grandes Regiões. 2015.

54. Field AE, Coakley EH, Must A, Spadano JL, Laird N, Dietz WH, et al. Impact of overweight on the risk of developing common chronic diseases during a 10-year period. Arch Intern Med. 2001; 161 (13): 1581-1586. doi: 10.1001/archinte.161.13.1581

55. Jaeger C, Brendel MD, Hering BJ, Eckhard M, Bretzel RG. Progressive islet graft failure occurs significantly earlier in autoantibody-positive than in autoantibody-negative IDDM recipients of intrahepatic islet allografts. Diabetes. 1997; 46(11): 1907-1910. doi: 10.2337/diab.46.11.1907

56. Kavaler S, Morinaga H, Jih A, Fan WQ, Hedlund M, Varki A, et al. Pancreatic beta-cell failure in obese mice with human-like CMPNeu5Ac hydroxylase deficiency. FASEB J. 2011; 25(6): 1887-1893. doi: 10.1096/fj.10-175281

57. Brown MS, Goldstein JL. Selective versus total insulin resistance: A pathogenic paradox. Cell Metab. 2008; 7(2): 95-96. doi: 10.1016/j.cmet.2007.12.009

58. Han T, Cheng Y, Tian S, Wang L, Liang X, Duan W, et al. Changes in triglycerides and high-density lipoprotein cholesterol may precede peripheral insulin resistance, with 2-h insulin partially mediating this unidirectional relationship: A prospective cohort study. Cardiovasc Diabetol. 2016; 15: 154. doi: 10.1186/s12933-016- 0469-3

59. da Silva CF, Zandoná MR, Vitolo MR, Bó Campagnolo PD, Rotta LN, Almeida S, et al. Association between a frequent variant of the FTO gene and anthropometric phenotypes in Brazilian children. BMC Med Genet. 2013; 14: 34. doi: 10.1186/1471-2350-14-34

60. Lourenço BH, Qi L, Willett WC, Cardoso MA, ACTION Study Team. FTO genotype, vitamin D status, and weight gain during childhood. Diabetes. 2014; 63: 808-814. doi: 10.2337/db13-1290

61. Reuter CP, Burgos MS, Bernhard JC, Tornquist D, Klinger EI, Borges TS, et al. Association between overweight and obesity in schoolchildren with rs9939609 polymorphism (FTO) and family history for obesity. J Pediatr. 2016; 92(5): 493-498. doi: 10.1016/j. jped.2015.11.005

62. do Nascimento GA, Teixeira MD, Furtado-Alle L, Leite N, de Souza RLR, Saliba LF, et al. FTO rs9939609 A allele influences anthropometric outcome in response to dietary intervention, but not in response to physical exercise program. Eur J Nutr. 2019; 58(1): 325-334. doi: 10.1007/s00394-017-1596-7

63. Todendi PF, de Moura Valim AR, Klinger E, Reuter CP, Molina S, Martínez JA, et al. The role of the genetic variants IRX3 rs3751723 and FTO rs9939609 in the obesity phenotypes of children and adolescents. Obes Res Clin Pract. 2019; 13: 137-142. doi: 10.1016/j.orcp.2019.01.005

64. de Araújo Pereira P, Alvim-Soares AM Jr, Sandrim VC, Lanna CMM, Souza-Costa DC, de Almeida Belo V, et al. Lack of association between genetic polymorphism of FTO, AKT1 and AKTIP in childhood overweight and obesity. J Pediatr (Rio J). 2016; 92 (5): 521-527. doi: 10.1016/j.jped.2015.12.007

65. Rodrigues LDS, Santos AMD, Lima MIS, Simões VMF, Pereira SR. Association between the FTO gene polymorphism and obesity in Brazilian adolescents from the Northeast region. J Pediatr (Rio J). 2020; 96(5): 630-637. doi: 10.1016/j.jped.2019.05.006

66. Heni M, Kullmann S, Ahlqvist E, Wagner R, Machicao F, Staiger H, et al. Interaction between the obesity-risk gene FTO and the dopamine D2 receptor gene ANKK1/TaqIA on insulin sensitivity. Diabetologia. 2016; 59: 2622-2631. doi: 10.1007/s00125-016-4095-0

67. Stock A-K, Arning L, Epplen JT, Beste C. DRD1 and DRD2 genotypes modulate processing modes of goal activation processes during action cascading. J Neurosci. 2014; 34(15): 5335-5341. doi: 10.1523/JNEUROSCI.5140-13.2014

68. Beste C, Stock A-K, Epplen JT, Arning L. Dissociable electrophysiological subprocesses during response inhibition are differentially modulated by dopamine D1 and D2 receptors. Eur Neuropsychopharmacol. 2016; 26(6): 1029-1036. doi: 10.1016/j.euroneuro.2016.03.002

69. Colzatoa LS, Steenbergena L, Sellaroa R, Stockb A-K, Arningc L, Beste C. Effects of l-Tyrosine on working memory and inhibitory control are determined by DRD2 genotypes: A randomized controlled trial. Cortex. 2016; 82: 217-224. doi: 10.1016/j.cortex.2016.06.010

70. Torre OHD, Paes LA, Henriques TB, de Mello MP, Celeri EHRV, Dalgalarrondo P, et al. Dopamine D2 receptor gene polymorphisms and externalizing behaviors in children and adolescents. BMC Med Genet. 2018; 19(1): 65. doi: 10.1186/s12881-018-0586-9

71. Zink N, Bensmann W, Arning L, Colzato LS, Stock A-K, Beste C. The role of DRD1 and DRD2 receptors for response selection under varying complexity levels: Implications for meta control processes. Int J Neuropsychopharmacol. 2019; 22(12): 747-753. doi: 10.1093/ijnp/pyz024

72. Mohammadi H, Joghataei MT, Rahimi Z, Faghihi F, Farhangdoost H. Relationship between serum homovanillic acid, DRD2 C957T (rs6277), and hDAT A559V (rs28364997) polymorphisms and developmental stuttering. J Commun Disord. 2018; 76: 37-46. doi: 10.1016/j.jcomdis.2018.08.003

73. Ramos-Lopez O, Panduro A, Rivera-Iñiguez I, Roman S. Dopamine D2 receptor polymorphism (C957T) is associated with sugar consumption and triglyceride levels in West Mexicans. Physiol Behav. 2018; 194: 532-537. doi: 10.1016/j.physbeh.2018.07.004

74. Eny KM, Corey PN, El-Sohemy A. Dopamine D2 receptor genotype (C957T) and habitual consumption of sugars in a freeliving population of men and women. J Nutrigenet Nutrigenomics. 2009; 2(4): 235-242. doi: 10.1159/000276991

75. 1000 Genomes Project Consortium; Auton A, Brooks LD, Durbin RM, Garrison EP, Kang HM, et al. A global reference for human genetic variation. Nature. 2015; 526(7571): 68-74. doi: 10.1038/nature15393

76. Pinto RM, e Silva DM, Queiroz FJ, Godoy FR, Teodoro LS, Lacerda I, et al. Reward deficiency syndrome in children: obesity and metabolic disorders are associated with the SNP TaqIA C32806T of the DRD2 gene. Obes Res Open J. 2015; 2(2): 64-72. doi: 10.17140/OROJ-2-111

77. Yeh J, Trang A, Henning SM, Wilhalme H, Carpenter C, Heber D, et al. Food cravings, food addiction, and a dopamine-resistant (DRD2 A1) receptor polymorphism in Asian American College Students. Asia Pac J Clin Nutr. 2016; 25(2): 424-429. doi: 10.6133/apjcn.102015.05

78. Obregón AM, Valladares M, Goldfield G. Association of the Dopamine D2 receptor rs1800497 polymorphism with eating Behavior in Chilean children. Nutrition. 2017; 35: 139-145. doi: 10.1016/j.nut.2016.11.005

79. Cardel MI, Lemas DJ, Lee AM, Miller DR, Huo T, Klimentidis YC, et al. Taq1a polymorphism (rs1800497) is associated with obesity-related outcomes and dietary intake in a multiethnic sample of children. Pediatr Obes. 2019; 14(2): 12470. doi: 10.1111/ijpo.12470

80. Pijl H, Ohashi S, Matsuda M, Miyazaki Y, Mahankali A, Kumar V, et al. Bromocriptine a novel approach to the treatment of type 2 diabetes. Diabetes Care. 2000; 23(8): 1154-1161. doi: 10.2337/diacare.23.8.1154

81. de Leeuw van Weenen JE, Parlevliet ET, Maechler P, Havekes LM, Romijn JA, Ouwens DM, et al. The dopamine receptor D2 agonist bromocriptine inhibits glucose-stimulated insulin secretion by direct activation of α2-adrenergic receptors in beta cells. Biochem Pharmacol. 2010; 78: 1827-1836. doi: 10.1016/j.bcp.2010.01.029

82. Rubí B, Ljubicic S, Pournourmohammadi S, Carobbio S, Armanet M, Bartley C, et al. Dopamine D2-like receptors are expressed in pancreatic beta cells and mediate inhibition of insulin secretion. J Biol Chem. 2005; 280(44): 36824-36832. doi: 10.1074/jbc. M505560200

83. García-Tornadú I, Ornstein AM, Chamson-Reig A, Wheeler MB, Hill DJ, Arany E, et al. Disruption of the dopamine D2 receptor impairs insulin secretion and causes glucose intolerance. Endocrinology. 2010; 151(4): 1441-1450. doi: 10.1210/en.2009-0996

84. Epstein LH, Dearing KK, Erbe RW. Parent–child concordance of Taq1 A1 allele predicts similarity of parent–child weight loss in behavioral family-based treatment programs. Appetite. 2010; 55(2): 363-366. doi: 10.1016/j.appet.2010.06.006

85. Ergun MA, Karaoguz MY, Koc A, Camurdan O, Bideci A, Yazici AC, et al. The apolipoprotein E gene and Taq1A polymorphisms in childhood obesity. Genet Test Mol Biomarkers. 2010; 14(3): 343-345. doi: 10.1089/gtmb.2010.0002

86. van Strien T, Snoek HM, van der Zwaluw CS, Engels RCME. Parental control and the dopamine D2 receptor gene (DRD2) interaction on emotional eating in adolescence. Appetite. 2010; 54: 255-261. doi: 10.1016/j.appet.2009.11.006

87. Duran-Gonzalez J, Ortiz I, Gonzales E, Ruiz N, Ortiz M, Gonzalez A, et al. Association study of candidate gene polymorphisms and obesity in a young Mexican-american population from South Texas. Arch Med Research. 2011; 42: 523-531. doi: 10.1016/j.arcmed.2011.10.010

88. Roth CL, Hinney A, Schur EA, Elfers CT, Reinehr T. Association analyses for dopamine receptor gene polymorphisms and weight status in a longitudinal analysis in obese children before and after lifestyle intervention. BMC Pediatrics. 2013; 13: 197. doi: 10.1186/1471-2431-13-197

LATEST ARTICLES

Chest X-ray Showed a Hazy Left Upper Lung Infiltrate

A Noteworthy Case of Myasthenic Crisis Induced by Levofloxacin

Ada Young*, Ramya Ramesh and Milind Awale

doi.

The Right Thigh Anterior Compartment was Swollen, and the Skin was Ulcerated due to the Traditional Cautery

Primary Skeletal Muscle Lymphoma: A Case Report and Literature Review

Solomon Bishaw*, Addisu Alemu and Abel Tefera

doi.

An Unusual Presentation of Encephalitis in a Patient with Lyme Neuroborreliosis

Maithily Patel*, Jazmin Jatana, Ramya Ramesh and Milind Awale

doi.

Practical Pointers for Drug Development and Medical Affairs

Gerald L. Klein*, Roger E. Morgan, Shabnam Vaezzadeh, Burak Pakkal and Pavle Vukojevic

doi.

10.17140/CTPOJ-7-125

Prevalence and Risk Factors of Subclinical Mastitis of Goats in Banadir Region, Somalia

Omar M. Salah*, Yasin H. Sh-Hassan, Moktar O. S. Mohamed, Mohamed A. Yusuf and Abas S. A. Jimale

doi.10.17140/VMOJ-9-184

LATEST ARTICLES