INTRODUCTION
Obesity is a multifactorial disease arising from an at-risk genetic profile, and environmental risk factors, such as physical inactivity, insufficient sleep, excessive caloric intake, medications, socioeconomic status, endocrine disruptors and the gastrointestinal microbiome.1,2,3,4,5
Some emerging strategies to help individuals successfully change their health behaviors include using personalized health programs that incorporate one’s physiological information and lifestyle coaching.6 Researchers have also recently begun to explore whether relationships and social support networks can be leveraged to help individuals achieve healthier lifestyles, weight loss and improve health outcomes.7
According to the World Health Organization (WHO), overweight and obesity are defined as abnormal or excessive fat accumulation that presents a risk to health, including diabetes and cardiovascular disease.8 The National Heart, Lung, and Blood Institute (NHLBI) define a body mass index (BMI) of more than 25 as overweight and an individual is considered obese if the BMI is above 30, and severely obese if the BMI is above 40.9 Over 70% of adults in the United States were considered overweight or obese in the Centers for Disease Control and Prevention (CDC) 2015-2016 report.10 Today almost 2 out of 3 adults are considered overweight or obese.11
The 2018 data brief on the National Health and Nutrition Examination Survey (NHANES) showed that 49.1% of U.S. adults tried to lose weight in the 2013-2016 time period. A higher percentage of women (56.4%) than men (41.7%) tried to lose weight. Within each age group, 20 and over, 20-39, 40-59 and 60 and over, the percentage of women trying to lose weight was higher within each age group and overall for all age groups. The percentage of adults who tried to lose weight increased with increasing BMI, with the highest percentage of men and women trying to lose weight in the obese category. The results showed that 66.7% of adults with obesity, 49.0% of overweight adults, and 26.5% of underweight or normal weight adults tried to lose weight. The most commonly reported methods used amongst adults to lose weight were exercising (62.9%) and eating less food (62.9%), followed by consuming more fruits, vegetables, and salads (50.4%). Participants could report more than one method used to lose weight. Most individuals (88.3%), reported using two or more methods.12
Obesity is associated with major health risks.1,13 Individuals are motivated for a variety of reasons to lose weight, including improving health and appearance. On the basis of these epidemic dimensions, the issue of overweight and obesity cannot be taken lightly. There is currently an abundance of research demonstrating that an individuals’ genetic and gut microbiome makeups are intrinsically linked to their metabolisms; for example, people with certain genotypes are able to lose weight faster when on diets high in fat compared to peers with different genetics. Others respond better to short bursts of intense activity as opposed to long sessions of moderate activity.14,15,16 Certain ethnic groups, for example, populations of Asian or African origin, have shown a propensity for obesity and diabetes even when following a diet deemed nutritious by the United States Department of Agriculture (USDA).17 Following dietary recommendations curated to an individual’s biology may help to optimize people’s health.15 Even more so, is the support from a spouse when one embarks on a personalized weight loss program.
Couples, especially cohabiting couples, are known to be a strong influence on each other’s health, and concordance in health behavior increases over time. Several studies suggest couple-focused interventions for health behavior change may be more effective than individual interventions (Table 1).18,19,20,21
| Table 1. Past Studies Conducted amongst Couples Focusing on Behavioral Change Outcomes |
| Couple Studies |
Study Population |
Results |
| Longitudinal study in 2015 by Jackson et al18 |
Researcher looked at the influence of a partner’s behavior on health behavioral change in 3722 couples that were either married or cohabiting |
Men and women are more likely to make a positive health behavior change, such as increased physical activity and weight loss, if their partner does too, and with a stronger effect than if the partner had been consistently healthy in that domain. |
| Literature review study in 2016 by Perry et al19 |
Researchers analyzed data of 401 families from the Networks and Obesity: Relationships and
Mechanisms Study (NORMS). They examined the impact of obesogenic relationships on individual behaviors and outcomes looking at three potential social mechanisms influencing obesity; normative body size, social control and behavior modeling |
People observe and may adopt the behaviors of those around them, whether healthy or unhealthy.
Research suggests that a person who makes a healthy behavior change has a larger impact on others’ positive health behaviors and that adoption of exercise or diet modifications in one individual is likely to spread to others. |
| Literature review study in 2007 by Monden C20 |
Researchers analyzed data of almost 12,000 couples using data from the annual Netherlands Health Interview Survey (NethHIS) |
Respondents whose partner reports poor health are almost three times more likely to report poor health than respondents whose partner is in good health. |
| Cross sectional literature study of ARIC cohort in 2016 by Cobb et al21 |
Researchers analyzed the data of BMI changes in 3,889 spousal pairs |
As the men or women’s BMIs in the study increased, their spouses BMIs also increased. Spousal BMI similarities might be driven by the impact of living in a shared obesogenic environment and by the influence of one spouse on the other. |
Studies often suggest that adoption of diet modification and physical exercise in one individual may spread to proximate others, such as partners, creating a social environment characterized by mutual reinforcement of healthy behavior and weight loss.18,19,20 Given the amount of time cohabiting couples spend with one another, it is logical to assume that modeling of health behaviors would occur, such as high-levels of sedentary behavior and low-levels of physical activity. Also, a strong attachment between couples may heighten identification with his or her experiences and the motivation to conform.18,19 The other issue to take into consideration, is that couples are often eating the same food together, but the same foods may be wrong for the individual genetic profiles which could end up resulting in poor weight loss maintenance.
Involving partners in behavior change interventions and encouraging partners to lose weight together may help improve health outcomes. Having couples adopt healthy behaviors together may be a promising approach, especially when weight gain is not a consequence of medications or comorbid conditions. Having positive reinforcement from a partner or spouse is invaluable when tackling obesity and weight loss.18,19 Using a program that sets a person up for weight loss success through personalized nutrition, such as the Digbi Health program, is a key component to improving health and weight loss maintenance. In the instance of the couple in this case report, this was found to be true.
CASE STUDY
A 58-year Caucasian male with type 2 diabetes and hypertension was not happy with his primary care physician’s management of his chronic conditions. He had been receiving treatment from the same physician for many years and decided to make a change. His new physician wanted him to make dietary changes to reduce his weight and increase his physical activity routine.
At the time of the appointment with his new physician he reported the following:
• Weight=251 pounds
• BMI=35
• A1c level=9.4
• BP reading=140/90
• Diabetes medication: Januvia; Metformin 500 mg twice a day
• Hypertension medication: Atenolol; Terazosin; Valsartan
• Acid reflux medication: Omeprazole
• Other medications: Aspirin; Multivitamins
The patient also reported suffering from sleep apnea, digestive disorders and acid reflux. He also complained of fatigue and reported that he had an injured ankle at the time so increasing physical activity would be difficult. The doctor advised incorporating a fitness routine and referred him to a fitness center close to his house.
After an initial assessment at the fitness center his fitness expert advised him to use the Digbi Health personalized obesity management program. Due to his injured ankle, he was not able to start a full fitness routine, but started a low intensity cardio routine consisting of light walking daily. He signed up for the Digbi Health program. Next, he sampled his deoxyribonucleic acid (DNA) and gut microbiome and started working with the Digbi Health coaches. His spouse, a 65-year-old Caucasian female, whom he had been married to for over five years, did not suffer from any chronic conditions, but she did take omeprazole for heartburn and had her right knee replaced 3-years prior. Occasionally she experienced slight knee and joint pain. She reported gaining over 15 pounds in the last five years and wanted to lose weight to look and feel better.
At the time of the initial appointment at the fitness center, she weighed 197 pounds and had a BMI of 32.8. She reported trying a variety of diets over the years with quick results, but often resulted in gaining the weight back. Being a supportive spouse, and wanting to make a change herself, she decided to also sign up for the Digbi Health program and go through the program together with her husband.
The Digbi Health program is a 24-week program which uses metabolic markers, body metrics, gut microbiome and genetic profiles to offer more than a one-size-fits-all food and lifestyle recommendation weight loss program. Participants use the Digbi Health app to input 10 key lifestyle and wellness markers, including weight, sleep, hunger, cravings, stress, meditation, superfoods, morning energy, foods to avoid and exercise on a daily basis and take photos of the food they consume.
Individuals will receive a personalized wellness report after sampling their blood, DNA and gut microbiome. The report provides a better understanding of an individual’s unique biology and metabolism and how it interacts with food and lifestyle to impact your health and quality longevity. It also provides a breakdown of obesity risk based on an individual’s DNA and gut microbiome profile.22 The program takes the guesswork out of healthy eating for an individual’s body, lifestyle, gender and age.
Each individual is also assigned a lifestyle coach who will work personally with the individual through 12 guided sessions at various intervals. Both the husband and wife went through the full coaching component of the program. The coaches worked with the individuals based on their results and advised them on how to best structure their diet. Individuals have the ability to view a personalized integrative nutrition plan based on their biophysiological individuality and work with the Digbi Health lifestyle coaches to produce modified behavioral changes and favorable weight loss results.
Personalized integrative nutrition,23 such as the personalized plan from Digbi Health, is important because no two human beings have the same genetic code. An individual’s genes not only determine how one looks, height, skin type, but also influences disease risk, obesity risk, as well as one’s energy and immunity levels. Genes play a key role in how effectively an individual is processing carbohydrates, fat, protein and converting them into energy, creating vitamins, hormones and steroids.24 Our genes also play a role in how we fight disease, metabolize medication one consumes and body detoxification and rebuilding cells.25
METHODS
The analysis of the saliva DNA sample and fecal gut microbiome sample is completed after the samples are processed in clinical laboratory improvement amendments (CLIA) accredited laboratory. Fecal and saliva DNA extraction, purification, next-generation sequencing (NGS) library preparation and sequencing is performed as per the Illumina standard protocol.26
DNA Interpretation
The outcome presented in the DNA report are determined by the number of markers and risk genotypes present in the genome raw data. Only a few human health conditions are dependent on a single gene marker. The vast majority of human traits are influenced by multiple gene markers. In addition, there is significant interaction between genes and environment such as dietary and lifestyle factors.
The outcome is a subjective measure and not a clinical measure. It is the percentage of risk markers present in the genome data among the maximum possible risk markers in the genome data. The genetic risk score (GRS) is calculated by analyzing a large number of risk variants. Unless several of these high-risk variants are present in the data the outcome could be low or moderate.
For the obesity risk DNA profile of an individual we profile the genes that have been shown to influence nutritional traits such as, diet and weight management, micronutrient requirements, food intolerance and several other attributes relevant to nutritional well-being. The word “likely” is used often in this study. “Likely” means, it is more likely that one will see the outcome, but other factors may modify it. The term “average” is also used in this study. Average implies neither high nor low, rather an intermediate outcome. For example, average likelihood of injury is an intermediate level between high and low likelihood. Average can also be understood in the context of “Normal” or “Typical” or “Moderate”.
The risk status of an individual’s markers is typically indicated as low, moderate and high risk. Attributes that are advantageous in nutritional well-being are indicated in green, or as a low risk, and those are not advantageous, or high risk are in red. Moderate or neutral outcomes are indicated in yellow.
Gut Microbiome Interpretation
The 16s paired fastq reads of the gut microbiome samples were quality checked and merged to generate the amplicons. Amplicons were further processed to calculate the bacterial genus abundance in each sample using automated data analysis pipeline based on the Parallel-META 3 pipeline.27 The sample values are compared with that of a healthy cohort value. The determined abundance of each bacterial genus was further analyzed to compute the diversity index using the in house developed python code. Further biochemical annotation of identified bacterial genera was performed based on our in-house database.
The associated bacteria are, Akkermansia, Bacteroides, Bifidobacterium, Anaerostipes, Coprococcus, Roseburia, Eubacterium, Ruminococcus and Christensenella. A higher abundance of associated bacteria helps to combat weight gain, inflammation, regulates weight, appetite, fat accumulation. These are associated with weight loss and leaner body types. A lower abundance of associated bacteria is detrimental and increases the risk of gaining weight and increases inflammation.
The negatively associated bacteria are Alistipes, Clostridium, Faecalibacterium, Lactobacillus, Prevotella and Blautia. A higher abundance of negatively associated bacteria promotes weight gain, inflammation and metabolic disorders. A lower abundance of negatively bacteria is beneficial and reduces the risk of gaining weight and inflammation (Tables 2 and 3).
| Table 2. Percentile Range for High to Low Risk Associated Bacteria Used in the Digbi Health Database |
| Associated Bacteria |
|
|
| Risk Status |
Percentile Range |
Remarks |
| High Risk |
0 to 59.9% |
Low Abundance of Good Bacteria |
| Moderate Risk |
60 to 79.9% |
Moderate Abundance |
| Low Risk |
80%-99.9% |
Normal Abundance |
| Table 3. Percentile Range for High to Low Risk Negatively Associated Bacteria Used in the Digbi Health Database |
| Negatively Associated Bacteria |
|
|
| Risk Status |
Percentile Range |
Remarks |
| High Risk |
Above 80% |
High Abundance of Bad Bacteria |
| Moderate Risk |
60 to 79.9% |
Moderate Abundance |
| Low Risk |
0 to 59.9% |
Low Abundance |
| Table 4. Male and Female Subject’s Obesity Risk (DNA) Profile |
|
|
Male Subject |
Female Subject |
| Markers |
Genes |
Risk/Status |
Remarks |
Risk/Status |
Remarks |
| Tendency to gain weight |
MAF, MC4R, MTCH2, SEC16B, NPC1, LEP, PCSK1, NEGR1, KCTD15, STK33, BDNF, ADRB21, ADRB2, ADIPOQ, TMEM18, UCP3, ADRB1, UCP2, GNPDA2, SH2B1, ETV5, FTO |
Moderate Risk |
Likely to gain weight |
Moderate Risk |
Likely to gain weight |
| Tendency to overeat |
FTO, TAS2R38, MC4R, DRD2, CLOCK |
Low Risk |
Less likely to overeat |
Moderate Risk |
Likely to overeat |
| Tendency to prefer fatty foods |
CD36, CD361 |
Moderate Risk |
Likely to over consume high fat foods |
Low Risk |
Less likely to over consume high fat |
| Tendency to prefer sweet foods |
TAS1R2, TAS2R381, TAS1R21, TAS1R3, TAS2R38, GLUT2, TAS1R31, TAS2R382 |
Moderate Risk |
Likely to over consume sweet foods |
High Risk |
Highly likely to over consume sweet foods |
| Tendency to prefer bitter foods |
TAS2R38, TAS2R382, TAS2R381 |
Moderate Risk |
Normal bitter vegetable preference |
Moderate Risk |
Normal bitter vegetable preference |
| Carbohydrate intake and weight gain tendency |
SEC16B, RBJ, FTO1, FTO, FLJ35779, FAIM2, FABP2, AMY1, LRRN6C, TCF7L2 |
Moderate Risk |
Likely to gain weight on high carb intake |
Moderate Risk |
Likely to gain weight on high carb intake |
| Saturated fats intake and weight gain tendency |
FTO, APOA2 |
Low Risk |
Less likely to gain weight on high SFA intake |
Low Risk |
Less likely to gain weight on high SFA intake |
| Mono unsaturated fats intake and weight gain tendency |
NR1D1, ADIPOQ, PPARG |
High Risk |
Highly likely to gain weight with high MUFA intake |
High Risk |
Highly likely to gain weight with high MUFA intake |
| Poly unsaturated fats intake and weight gain tendency |
BDNF |
Low Risk |
Less likely to gain weight with high PUFA intake |
Low Risk |
Less likely to gain weight with high PUFA intake |
| Protein intake and weight loss tendency |
FTO |
Low Risk |
Highly likely to lose weight on high protein intake |
Low Risk |
Highly likely to lose weight on high protein intake |
| Tendency to regain weight |
TFAP2B, PPARG, ADIPOQ, BDNF |
Moderate Risk |
Likely to regain weight after weight loss |
Moderate Risk |
Likely to regain weight after weight loss |
| Weight loss or weight gain
with exercise |
INSIG2, FTO, ADRB2 |
High Risk (Unfavorable) |
May not experience much weight loss |
Low Risk (favorable) |
Likely to experience higher weight loss |
| Exercise motivation |
BDNF |
Moderate Risk |
Moderate inclination towards exercise |
Moderate Risk |
Moderate inclination towards exercise |
| Obesity Risk Index |
|
1.84 (1=Lowest risk; 3=Highest risk) |
Moderate Risk |
1.76 (1=Lowest risk; 3=Highest risk) |
Moderate Risk |
Male Subject
The male subject’s eating pattern prior to starting the program was slightly high in carbohydrates and processed foods such as chips, pretzels at snack times late in the evening and he would drink 35 cups of coffee per week.
The results revealed the male subject had a genetic moderate obesity risk of 1.84 with 3 being the highest risk. According to the genetic markers on genes NR1D1, ADIPOQ, PPARG assessed, he showed a genetic tendency for a higher BMI on a monounsaturated fatty acids (MUFA) diet, but less likely to gain weight on high polyunsaturated fatty acids (PUFA) diet according the markers assessed on the BDNF gene. His results also revealed he was highly likely to lose weight with a low carbohydrate intake and high protein intake according to the markers assessed on the following genes SEC16B, RBJ, FTO1, FTO, FLJ35779, FAIM2, FABP2, AMY1, LRRN6C and TCF7L2. According to the CYP1A2 gene, the results revealed that the male subject was a slow metabolizer of caffeine and was advised to reduce his coffee intake to two cups a day to reduce inflammation and cardiac risk. The male subject did significantly reduce his caffeine intake.
The report of the male subject in this case study also revealed that he was an unfavorable candidate to experience much weight loss with exercise, based on his genetic markers. So, he was advised to continue to exercise, but to focus on dietary means to reduce weight. His diet included focusing on complex carbohydrates such as fruits, vegetables, legumes and whole grains, as well as increasing intake in grape seed oil, chia seeds, tuna and mackerel which are rich in polyunsaturated fatty acids (PUFA). The male subject in this case study, had a moderate obesity risk according to his gut microbiome report and his microbiome diversity score was 8.16 out of 10. A greater microbiome diversity score is associated with good health.28 The microbiome diversity score is calculated by normalizing the inverse form of Simpson’s Diversity Index to 10. Scores range from 0 to 10, with 10 being the most diverse.
Female Subject
The female subject’s eating pattern prior to starting the program was high in carbohydrates and processed foods such as chips, pretzels and protein bars. She also drank 14 cups of coffee a week before starting the program.
| Table 5. Male and Female Subject’s Obesity Risk (Gut Microbiome) Profile |
|
Male Subject |
Female Subject |
| Markers |
Risk |
Remarks |
Risk |
Remarks |
| Akkermansia |
High Risk |
This genus has shown potential to combat weight gain and inflammation |
High Risk |
This genus has shown potential to combat weight gain and inflammation |
| Bacteroides |
Low Risk |
This genus has shown potential to combat weight gain |
Low Risk |
This genus has shown potential to combat weight gain |
| Bifidobacterium |
High Risk |
This genus has shown potential to combat weight gain |
High Risk |
This genus has shown potential to combat weight gain |
| Anaerostipes |
High Risk |
Associated with weight loss and leaner body types |
High Risk |
Associated with weight loss and leaner body types |
| Coprococcus |
High Risk |
Associated with weight loss and leaner body types |
High Risk |
Associated with weight loss and leaner body types |
| Roseburia |
Low Risk |
Associated with weight loss and leaner body types |
Low Risk |
Associated with weight loss and leaner body types |
| Eubacterium |
High Risk |
Regulates weight and appetite |
High Risk |
Regulates weight and appetite |
| Ruminococcus |
High Risk |
Regulates weight and appetite |
High Risk |
Regulates weight and appetite |
| Alistipes |
Low Risk |
This genus has shown to promote weight gain and
inflammation |
Low Risk |
This genus has shown to promote weight gain and inflammation |
| Clostridium |
Low Risk |
This genus has shown to promote weight gain and
inflammation |
High Risk |
This genus has shown to promote weight gain and inflammation |
| Faecalibacterium |
Low Risk |
High abundance increases Obesity/metabolic disorder |
High Risk |
High abundance increases Obesity/metabolic disorder |
| Lactobacillus |
Low Risk |
High abundance increases Obesity/metabolic disorder |
Low Risk |
High abundance increases Obesity/metabolic disorder |
| Prevotella |
Low Risk |
High abundance increases Obesity/metabolic disorder |
Low Risk |
High abundance increases Obesity/metabolic disorder |
| Firmicutes/
Bacteroidetes Ratio |
1.1:1 (ideal range is less than 0.9:1) |
Your gut microbiome’s Firmicutes/Bacteroidetes Ratio
suggest moderate risk of chronic inflammatory risk-
weight gain, aches and pains and headaches. |
1.69:1 (ideal range is less than 0.9:1) |
Your gut microbiome’s Firmicutes/Bacteroidetes Ratio suggest moderate risk of chronic inflammatory risk-weight gain, aches and pains and headaches. |
| Obesity Risk Index |
2 (1=Lowest risk; 3=Highest Risk) |
Moderate Risk |
2.28 (1=Lowest risk; 3=Highest Risk) |
High Risk |
| The markers are individual traits that ether positively or negatively associate with obesity based on single nucleotide polymorphisms (SNPs) or bacterial genus abundance. Results are qualitative relative to the uBiome healthy cohort. |
After taking her sample the results revealed that she had a genetic moderate obesity risk 1.76. Her results also revealed that she had a genetic tendency for rapid weight regain after a weight loss program according to the genetic markers on the genes ADIPOQ, PPARG, TFAP2B and BDNF. She was advised to follow a healthy lifestyle and eating pattern to ensure better weight maintenance. She was also advised to not skip breakfast, but rather to eat a nutrient dense breakfast, avoid processed foods and sugar sweetened beverages and include more whole grains, nuts, fruits and vegetables in her diet. According to the genetic markers on the genes TAS1R2, TAS2R381, TAS2R38, TAS2R382, GLUT2, TAS1R21, TAS1R3, TAS1R31 her results revealed a genetic tendency for lower sweet taste perception and overconsumption of sweet foods. She was advised to drink more water and try to consciously reduce intake of sweets, which she did, and this helped with her weight loss.
Her genetic report also revealed a favorable response to weight loss when engaging in regular exercise according to the genetic markers assessed on the genes FTO, ADRB2, INSIG2. Interestingly, similar to her husband, she also showed a genetic tendency for a higher BMI on a MUFA diet, but less likely to gain weight on high PUFA diet which would help to make meal planning and food preparation together as a couple more aligned. Eating the right food types for their genetic profiles helped with their weight loss.
The results of the first gut microbiome sample revealed that the female subject in this case study had a high obesity risk and her microbial diversity score was 8.22 out of 10.
RESULTS
Male Subject
After 16 weeks on the program the husband went from 251 pounds to 207 pounds, achieving a 15.94% weight loss. He went from an XXL size shirt to a large and lost four inches on his waist going from a size 38 to 34-inch waist size. He also reported significant health improvements after visiting his physician at the end of August 2019:
- A1c level was 5.7
- BP reading was 109/80
- Total change in weight loss of 15.94%
- New BMI was 28.05 after program completion (reduced from obese to overweight)
- Dosage change of his metformin-from 2 tablets daily to 1 tablet at night daily
- Stopped taking omeprazole due to relief of heartburn symptoms
- The dosages of the other medication still remain the same and will be reviewed by his physician in 6-months.
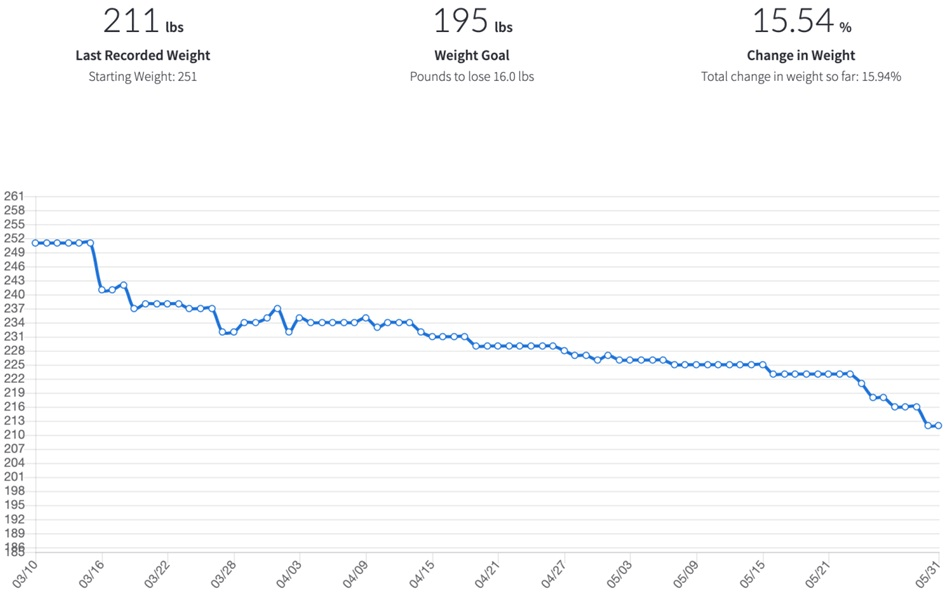
After completing 16 weeks on the program the husband reported being easily able to maintain his weight because he knows what foods are good for him and he knows the best way to prepare his foods based on his genetic and gut microbiome profile. He felt more energized and was able to incorporate strength training into his fitness routine. He now goes to the gym daily (Figure 1).
Figure 1. Graph Showing Three-Month Weight Trend of Male Subject from the Start of the Program, Data from the Digbi Health App
A second gut fecal swab sample was taken by both the husband and wife around the fourth month in the program and the gut microbiome comparative profile was discussed during the coaching session.
The results of the second gut microbiome sample revealed that there was a substantial gain in the relative abundance of “good” probiotic microbes in the gut and this resulted in a decreased obesity risk for the male subject. The bacterial microbial diversity of the gut was largely unchanged (Figure 2).
Figure 2. Graph Showing That the Probiotic Abundance had Increased between Sample 1 and Sample 2 of the Male Subject, Data from the Digbi Health App
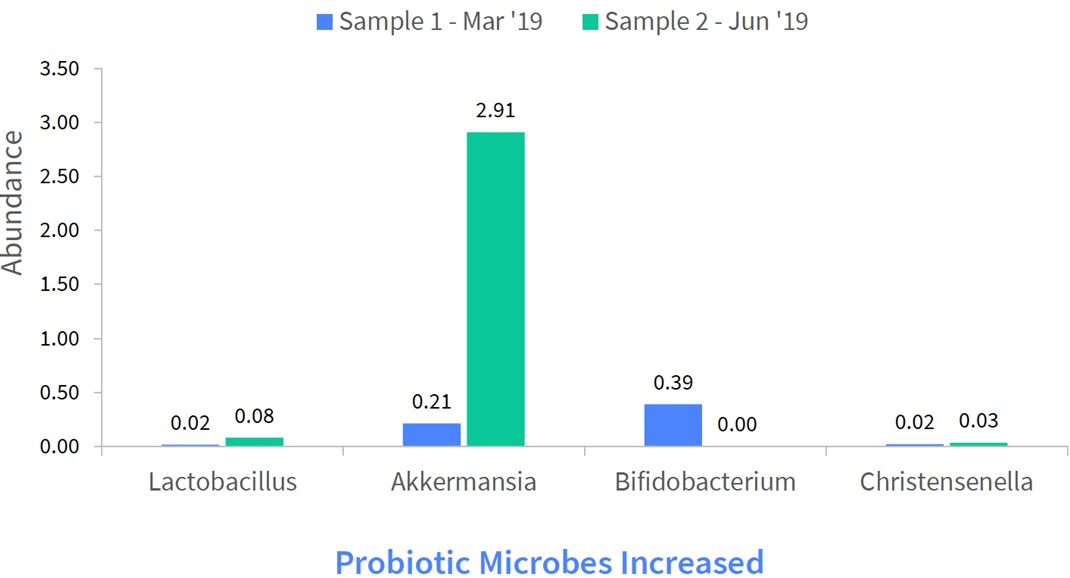
An increased abundance of Lactobacillus and Christensella were noted in sample 2. Christensenella limits fat accumulation. A significantly high increase in abundance of Akkermansia was noted in sample 2. Akkermansia is associated with an increased metabolism.
Female Subject
The wife went from a starting weight of 197 to 170 and lost over 6 inches on her waist going from a size 16 to a size 10 and a total change in weight loss of 13.65 percent. At the end of the program she reported having more energy to take longer walks, around 45 minutes 4-5 times a week and has incorporated strength training into her fitness routine when she goes to the gym, now three days a week. Her genetic profile also reveals she is more likely to lose weight with regular exercise. She also reported experiencing less pain in her knees after the weight loss and she stopped taking the omeprazole because she rarely suffers with heartburn (Figure 3).
Figure 3. Graph Showing Three-Month Weight Trend of Female Spouse from the Start of the Program, Data from the Digbi Health App

The results of the second gut microbiome sample revealed her bacterial microbial diversity of the gut was largely unchanged, but her obesity risk moderately decreased, and her probiotic abundance remained relatively unchanged. Her results also revealed a reduced inflammation risk due to a substantial drop in the short chain fatty acid producing microbe butyrate. She was encouraged to increase her intake of fermented food and prebiotic fiber-rich food including, chicory root, dandelion greens, Jerusalem artichokes, lettuce, endive, asparagus, garlic, onions and leeks help increase her probiotic abundance. Research has also revealed that regular exercise can also improve your gut microbiome (Figure 4).29
Figure 4. Graph Showing That the Probiotic Abundance was Relatively Unchanged between Sample 1 and Sample 2 of the Female Subject, Data from the Digbi Health App

A Decrease in Abundance of Lactobacillus and Christensella were Noted in Sample 2. An Increase in Abundance of Akkermansia was Noted in Sample 2
DISCUSSION
A big challenge of obesity management is not weight loss, but long-term weight loss maintenance.30 Weight loss maintenance is often hindered by a complex interaction of biological, behavioral, and cognitive factors.31 The number of couple-based studies were limited for this case study. More methodologically analyzed couple-focused interventions are therefore required in order to determine added benefits of couple-based interventions relative to evidence-based individual interventions based on gut microbiome and genetic profiles. Most obesity studies have either focused on genetic profiles alone or gut microbiome alone, not a combination. Studies, ideally randomized controlled trials, are still needed looking at a combination of DNA and gut microbiome together. The Digbi Health program is the only program that provides the individual with an obesity risk profile based on their genetics and gut microbiome.
If one is equipped with all the tools needed for successful maintenance and encouraged in a supportive environment, the chances of regaining weight upon program completion is reduced. The couple are now in the maintenance phase of their program and have reported they both feel more energized, are exercising more regularly, including playing golf together, spending more time outdoors and feel very empowered to know how to prepare the right foods for themselves and their bodies. They believe the coaching sessions were invaluable because it made them feel accountable for what they were eating and when they were eating. They also reported that having a complete DNA and gut microbiome profile was empowering to help them understand what foods can be eaten and which ones should be avoided based on their unique data. They believe that the Digbi Health App helps them to stick to their goals and stay engaged and focused on their weight loss journey to improved health. They also realized that following a one-size-fits-all diet does not benefit individuals because everyone is different. Five months after completing the program, they continue to maintain their weight.
This case study was limited to the assessment of one couple who completed the Digbi Health program. The couple also had a similar gene nutrition profile so food preparation and eating the same foods benefited both for weight loss. More investigations will need to be conducted to evaluate the potential of weight loss amongst other cohabiting couples on the same program.
CONCLUSION
Since the sequencing of the human genome through the Human Genome Project (HGP), the progress of “omics” techniques, including gut microbiome analysis, personalized nutrition has been extended to diseases mediated by gene-environment interactions such as obesity and metabolic-related diseases such as type 2 diabetes. Growing studies have found that changes in adiposity, sugar-related blood markers and metabolic response to low-calorie weight loss diets might be modified by genetic variants related to obesity, metabolic status, and preference to nutrients.1,4,22,23,30
The gut microbiome has been identified in the past decade as an important factor in obesity and diabetes and the magnitude of its contribution to obesity and its related comorbidities has aroused curiosity in the scientific community.25 Among the vast quantity of factors attributed to obesity, environmental, dietary, lifestyle, genetic, and others including the microbiome continues to play an important role in the multifactorial approach to its management.1
In conclusion, we have come to realize there are many factors that may help an individual lose weight. In particular cohabiting couples’ close relationships, following a weight loss program personalized to their gene and gut microbiome profile, may provide a more supportive environment for overweight or obese men and women to initiate the pursuit of weight loss and maintain healthy dietary practices and increased physical activity.
ACKNOWLEDGEMENT
We would like to acknowledge the Prescribe Fit team, a partner in the Digbi Health Precision Care Network, for their referral of the couple in this case study to the Digbi Health program.
CONFLICTS OF INTEREST
Dr. Singh-Rambiritch reports that fees for the Digbi Health program were collected from the couple through the institution, Prescribe Fit, who is one of the Digbi Health partners that supplies the program to at cost.


