INTRODUCTION
Hepatitis C virus (HCV) is one of the most prevalent cause of liver diseases with estimates placing nearly 3% of the world population, roughly 150 million people, as HCV-infected.1 Persistent HCV infection eventually develops into liver cirrhosis or hepatocellular carcinoma and more than 700,000 people die every year from hepatitis C-related liver diseases.2 On the other hand patients with chronic liver disease tend to be complicated with metabolic disturbance of trace element, namely the decrease of zinc and the increase of iron and copper.3 We have reported zinc supplementation additively enhanced the effect of interferon (IFN) on the eradication of HCV.4,5 Zinc is the component not only of non-structural protein NS3 of HCV but also of an inducer of metallothionein, which is an anti-oxidant and a chelating agent of metals. As for iron, phlebotomy could improve the liver function due to iron depletion through the reduction of oxidative stress.6 Copper increases and deposits the hepatocytes as liver disease progresses not only in Wilson’s disease but chronic viral hepatitis.3,7 In vitro assay of HCV has long been difficult to establish because no cell culture system could replicate HCV until Bartenschlager developed in vitro HCV-replication system called “replicon” which cannot produce the complete virion of HCV but efficiently expressed a part of structural and nonstructural proteins of HCV in Huh-7 hepatoma cell line.8 This system is useful for pharmacological assessment of drug effect on HCV but in order to reproduce the cellular event by HCV replicon, we used the full genome HCV replicon founded by Kato N et al HCV-O.9 A genome-length HCV RNA replication system may reflect the phenomenon that HCV-infected human liver undergoes. This replicon is more similar to HCV itself than the original one which does not contain core region but non-structured region.9 In Gunma, Japan we have an innovative system to analyze the trace element, micro-particle induced X-ray emission, PIXE. Our aim is to clarify the relationship between trace element and HCV replication in replicon system using in air micro particle-induced X-ray emission (PIXE) system which is introduced precisely in the references.10 The quantitative analysis is available only by using PIXE system in one cell.10 Metallothionein which is the main zinc reserve in the cell11,12 was also quantitatively analyzed by Cd-hem assay.13
MATERIALS AND METHODS
HCV-Replicon and Control Cell
HCV replicon was kindly provided from Professor Kato N, Okayama University as infected in Huh-7 cell lines, designated as O cells.9 Briefly, O cells were introduced genome length HCV RNA into Huh-7 and real-time reverse transcriptase polymerase chain reaction detected HCV RNA in the cell and culture supernatant.9 O cells were positively selected by neomycin and cultured in Dulbecco’s modified Eagle’s medium GIBCO Cat No.12320-032 (Gibco-BRL, Invitrogen Life Technology, Carlsbad, CA, USA) supplemented with 10% fetal calf serum, Bio-West (NW, USA) Cat No S1820, penicillin, and streptomycin, Gibco Cat No 15070-063 (complete DMEM).
Analysis of the Intracellular Zinc by in-Air micro-PIXE
Preparation of the samples for in-air micro-PIXE
Replicon cells and control cells were cultured with 1 ml of medium on Mylar foil (Graphix Plastics, OH, USA) overnight. Then the cells were pretreated with 100 microM of zinc chloride for 9 hours and were rinsed seven times with tris-hydroxymethylaminomethane (THAM, Sigma, Saint Louis, MO, USA) solution and were cryofixed with liquid nitrogen and dried in a vacuum for 24 hours. Finally, the samples were mounted onto the sample holder. Non treated cells were served as control.
Analysis of cellular trace elements using PIXE
A 3.0 meV proton beam, 1 micrometer spot size, accelerated by Takasaki Ion Accelerator for Advanced Radiation Application (TIARA) single-ended accelerator at JAEA-Takasaki, was used to analyze the subcellular elemental distribution in the cell samples. Micro-beam less than 1 micrometer makes an electron in the inner shell jump out from the orbit and another electron in outer shell moves to an inner orbit. Then characteristic X-ray having the particular energy is emitted and detected by the X-ray detector. An ion beam can be focused in a spot as small as 1 mm in a specimen with a set of quadruple magnets. Period and dimensions of the scan were set at 30 minutes and 70×70 micro square meter (µm2) areas, respectively. Precise measurement conditions were reported previously.11 Net count of element yield was calculated by the PC soft ware program. Because sulfur (S) count is regarded as the representative of the whole cell number.10
Cd-hem Assay
Metallothinein (MT) concentrations in HCV-O cells and control were assayed by a modified Cd-hem method described by Onosaka and Cherian.12 In brief, 1×10⁶ cells/mL of both cells was cultured in plastic dish with a diameter of 10 cm. At 90% confluent, the cells were treated with Zn 100 micro M-alone, IFN50 U/mL+Zn100 micro M, IFN100 U/mL+Zn100 micro M or IFN100 U/mL-alone. Non-treated cells were used for control. In 24 h after the treatment, the cells were rinsed with phosphate-buffered saline (PBS), then were harvested and resolved with 1.0 ml of 0.25 M sucrose. The cells were ultra-sonicated, and then centrifuged 20,000 g for 30 min. Following the protein concentration assay, the recovered supernatant was used for MT assay. The 0.2-ml supernatant sample was mixed with 1.0 ml of 0.03 M Tris–HCl buffer (pH 7.8) containing 1 micro gram Cd and was incubated for 10 min. For removing non-MT-conjugated Cd, the sample was added 0.1 ml of 5% bovine–hemoglobin and was heated for 90 s at 95 centigrade. After cooling on ice, the sample was centrifuged at 10,000 g for 5 min. The addition of bovine-hemoglobin and the heart treatment were repeated three times. MT-conjugated Cd in the supernatant was determined by inductively coupled plasma/mass spectroscopy (ICP-MS) (ELAN6100, Perkinelmer, Japan). Mass-to charge ratio was 114. MT concentration was calculated by assuming that 1 mole of MT (6600) binds 7 mole Cd, and was described per milligram of protein. MT in control cells and O cells with and without additional zinc was compared as duplicate.
Statistical Analysis
Statistical analysis was performed by two-way analysis of variance. p<0.05 was accepted as statistically significant.
RESULTS
Analysis of the Intracellular Zinc by In-Air Micro-PIXE
In air micro-PIXE analysis revealed the peak of phosphorus, potassium, iron, copper zinc treated differences of metal component between the two cells were observed for 30 minutes analysis. Cellular distribution of phosphorus shows the micro-PIXE exactly hits and detects the cells (Figure 1). Although iron and zinc located compatible with phosphorus contour, no significant differences were visually observed between HCV replicon-infected cells and control (Figure 2). Calibration of zinc concentration using control showed enhanced zinc incorporation was observed in HCV-O cells than control Huh-7. As for the quantitative analysis, the comparison of the densitometry counts of additional zinc and O cells to non treated Huh-7 was shown in Figure 3 and analyzed. Zinc tended to increase in non treated O cells compared to controls, it was not statistically significant. On the other hand, zinc was significantly increased in zinc treated O cells compared to zinc treated controls and non treated O cells. This change of zinc might demonstrate that HCV infection itself increases zinc and additional zinc further enhance zinc content in HCV infected cells concomitantly increased MT compared with control (Figure 4).
Figure 1: P, K, Fe and Zn content in HCV-O and Control (Huh7) analyzed by air micro-PIXE.
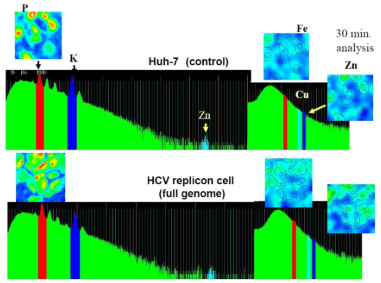
Figure 2: Zinc distribution detected by air micro-PIXE compared with P as cytoplasm, Br as nucleus in HCV-O and Control (Huh7).
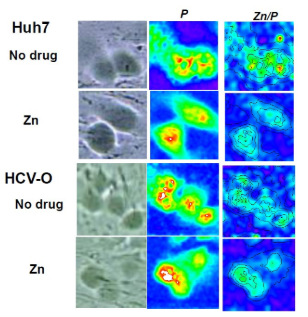
Figure 3: Calculation of zinc content by air-micro-PIXE callibrated by the control.
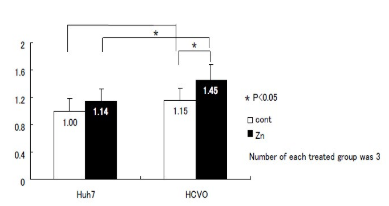
Figure 4: Quantification of metallothionein by Cd-hem assay.
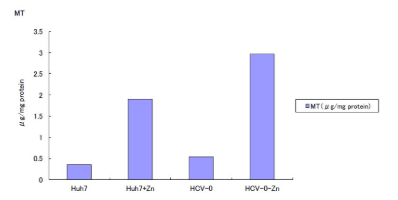
Cd-hem Assay for MT (Figure 4)
Intracellular MT was calculated by Cd-hem assay. Baseline expression of MT is higher in HCV-O cells than control cells. MT induction by zinc was 1.6 µg/mg proteins in Huh-7 and 2.4 µg/mg proteins in HCV-O. These increases are not statistically analyzed because the quantification was repeated twice.
DISCUSSION
In patients with chronic liver disease, trace element in the liver and serum is changed in accordance with the severity of the disease.1 In the trace elements, we focused on zinc because zinc is a key metal of HCV replication.13 We have already revealed the zinc ion suppressed the HCV replication in HCV replicon13 and zinc could be the possible treatment option for hepatitis C.4,5 Until now, few precise report of metal distribution in one cell has been published because no dynamic observation of intracellular metal has been available. Micro-PIXE can overcome this technical difficulty. Nagamine et al14 first reported zinc and MT distribution in hepatoma cell, line, HepG2 using micro PIXE. They concluded that zinc and interferon-beta collaboratively enhanced the MT expression and zinc in hepatoma cells. We have first demonstrated enhanced zinc in HCV replicon and using micro PIXE in this study. Micro PIXE analysis revealed the elevated zinc in the HCV replicon cells and the additional zinc more increased the zinc content in HCV replicon cells than control.
Non-structure coding region of HCV, namely, NS2/3 and NS3 protease contained zinc in their structure.15 One of the reasons of zinc elevation in HCV infected cells may be the existence of zinc containing virus but those of more MT induction in HCV infected cells have not been clarified. In vivo studies have shown that MT expression was enhanced in chronic hepatitis C and interferon treatment decreased MT expression.16 Our results are compatible with these reports that HCV itself can evoke MT expression in replicon cells.
The other possible mechanism of zinc increment in O cells might be the change of zinc transporter. Zinc transporter zip14 is reported to be up-regulated by interleukin-6.17 The relationship of HCV and zinc transporter could be some keys of trace element disturbance.
Because serum zinc concentration decreased in the advanced stage of hepatitis C,18 the increase of zinc in O cells might be the results of homeostatic HCV suppression in infected cells, such as hepatocytes. Anyhow further study is needed to elucidate the precise relationship of zinc and HCV.
Zinc distribution and relative concentration in one cell was visualized and quantified by air micro-PIXE analysis. According to the results, zinc is enhanced in HCV infected cells and further enhanced by additional zinc administration in cell culture. This enhancement is accompanied by metallothionein increase. These results might be preliminary but further study using this system will elucidate the relationship between HCV and trace element especially zinc.
CONCLUSION
This paper first demonstrated the zinc increase in HCV infected cells than control by micro-PIXE. One possible mechanism of this increment is MT enhancement.
ACKNOWLEDGEMENT
This study was supported by 21st Century Center of Excellence Program, Japan Society for the Promotion of Science, Japan.
CONFLICTS OF INTEREST
The authors declare that they have no conflicts of interest.


