INTRODUCTION
Malnutrition is a widespread nutritional disorder in most of the developing countries. About 146 million children under five are underweight in the developing world and more than half of them live in South Asia including India. India has 49% underweight children, which share 39% of the world’s underweight children. Numerically, 57 million children are underweight in India. Under nutrition during infancy and childhood substantially raises vulnerability to infection and disease and increases the risk of premature death. Among children in developing countries, malnutrition is an important factor contributing to illness and death.1 Growth during childhood is widely used to assess adequate health, nutrition and development of children, and to estimate overall nutritional status as well as the health status of a population. Early childhood malnutrition is a serious public health problem in India including West Bengal. The nutrient requirement of an individual is largely determined by age, gender and body weight. Body weights and heights of children reflect their state of health, nutrition, rate of growth and weight and height of adults represent what can be attained by an individual with normal growth.2
Malnutrition during childhood can also affect growth potential and the risk of morbidity and mortality in later years of life.1 Therefore, growth during childhood is widely used to assess adequate health, nutrition and development of children, and to estimate overall nutritional status as well as the health status of a population. Undernutrition can be considered as the most important cause of death in this age group in developing countries including India, where high rates of under-five morbidity and mortality are present. Seven out of ten childhood deaths in India are due to respiratory infections diarrhoea and malnutrition.3
Malnutrition is a pathological state resulting from a relative or absolute deficiency or excess of one or more essential nutrients.4 Thus, the term “malnutrition” refers to undernutrition, over nutrition, specific nutrient deficiencies or imbalance.4 Undernutrition can be divided into protein-energy malnutrition and micronutrient deficiencies.
Jacquemont et al5 showed that reciprocal duplication in a part of chromosome 16 is associated with being underweight. They characterized about 140 duplication carriers who showed significantly reduced postnatal weight and BMI.
The assessment of nutritional status of population has attracted the attention of not only the nutritionists and other biological scientists, but also the economists and other social scientists with a view to understanding the health and socio-economic status of the population.6 Due to its simplicity and low cost, anthropometric evaluation give, further, a simple and a reliable estimation of under nutrition prevalence.7 Nutrition is concerned with social, economic, cultural and psychological implication of food and eating. Poor nutrition as evidenced by poor growth and small stature could affect development, intellectual performance and intellectual achievement.8 Nutrition security is about an access to all people at all times to sustain a healthy and active life. Poor nutrition of children do not only affects the cognitive development of children but also likely to reduce the work capacity in future.9 Body mass index (BMI) has been widely used for assessing nutritional status of adults and thinness in adolescents and more recently in children aged 0-5 years.10
The integrated child development services (ICDS) scheme is the largest national programme in the world for promotion of mother and child health and child development. It was launched on 2nd October, 1975. The ICDS is the symbol of India’s commitment to her children. The beneficiaries of ICDS scheme include preschool children, pregnant and lactating mothers, and other women in the age group 15-44 years. The package of services provided by the ICDS scheme includes a) immunization, b) supplementary nutrition, c) health check-up, d) referral services, e) preschool non-formal education and also f) nutrition and health information. The scheme’s services are provided through workers called “Anganwadi workers” at village “Anganwadi” centres.11
To evaluate the importance of the said service scheme programme, there is an urgent need to evaluate the nutritional status of children at ICDS centres to conclude whether they have low rates of thinness. Low rate of thinness would imply that the supplementary nutrition being administered to the children is helpful in dropping the rates of thinness undernutrition.
The aim of the present research was to evaluate the different grades of thinness among 3-5 year old ethnic Bengalee preschool (ICDS) children of Sagar Block, in the Sunderbans area of South 24 Parganas, West Bengal, India. We utilized age and sex specific international12 cut off values based on body mass index (BMI) for thinness. The uniqueness of our study was that, hitherto, to the best of our knowledge, no previous study has been undertaken which has evaluated the prevalence of thinness among preschool children of this region.
MATERIALS AND METHODS
The Settings
This present cross-sectional study was undertaken at 28 ICDS centres at Sagar Block of South 24 Parganas District, West Bengal, India. The study area is situated at Gangasagar, Sundarban area of Kakdwip Subdivision. This is located at approximately 130 km far away from Kolkata, the provincial capital of West Bengal. Total areas of Sagar Island are 194.60 miles (504 km2 ) and it has the population of 2,06,890 according to 2011 census. This block has a population density of 1063.155 (410.49 per km2 ) per square mile. Growth rate is 20.38% during 2001-2011 but decadal growth rate of South 24 Parganas is 20.89% where this block decadal growth rate is 17.84%. The area is remote and mostly inhabited by Hindu. All preschool children (3-5 years old) living in Sagar Block are enrolled at these centres. The data was collected in several phases during November 2015 to January 2017. To the best of our knowledge, hitherto, there are no previous published investigations dealing with thinness among pre-school children from Sunderban area of West Bengal, India. This is the uniqueness of our study.
The Study Sample
The subjects were randomly selected from 28 ICDS centres of DS2 Gram Panchayat of Sagar block, South Parganas district, West Bengal, India. A total number of 656 children (boys=326; girls=330) aged 3-5 years were measured. The distribution of the children is presented in Table 1. Ages of the children were ascertained from the “Anganwadi” registers, immunization cards and also subsequently confirmed by parents of the children. For analysis, age was grouped into 6 months intervals. Formal ethical and administrative approvals were obtained from Vidyasagar University as well as ICDS authorities prior to the commencement of the study.
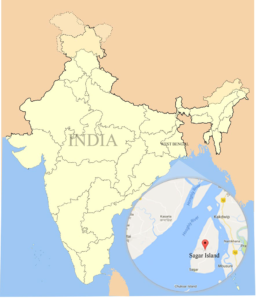 Sagar Island, West Bengal, India
| Table 1: Age and Sex Distribution of the Subjects. |
|
Age in Years
|
Number of Boys |
Number of Girls |
Total (Sex combined) |
| 3.0 |
76 |
64 |
140
|
|
3.5
|
43 |
56 |
99 |
| 4.0 |
57 |
50 |
107
|
|
4.5
|
46 |
60 |
106 |
| 5.0 |
63 |
64 |
127
|
|
5.5
|
41 |
36 |
77 |
| Total (Age combined) |
326 |
330 |
656
|
Anthropometric Measurements
Anthropometric measurements of height (cm) and weight (kg) of each subject were made by one investigator (SPG) using Martin’s anthropometer and standard spring balance weighing machine respectively, according to standard techniques.13 Height (cm) and weight (kg) of the subjects were measured to the nearest 0.1 cm. and 100 g, respectively.
Statistical Analysis
The data were analysed using SPSS (Version 16.00) and MS Excel software. Sex differences (age-specific) were determined using Student’s t-test. One-way ANOVA (Scheffe’s procedure) analyses was undertaken to test for age variations of these variables.
Evaluation of Nutritional Status
There are several parameters to assess the nutritional status among the preschool children. Universally accepted age and sex specific international11 cut off values of BMI (Table 2). This table shows age and sex specific cut off values of mild, moderate and severe grades of thinness as described by Cole et al.12
| Table 2: International Cut off Point for BMI (kg/m2) of Thinness Grade, I, II, and III for the Ages 3.0-5.5 Years.12 |
|
Age in years
|
Boy’s Thinness |
Girl’s Thinness |
| Grade-III |
Grade-II |
Grade-I |
Grade-III |
Grade-II |
Grade-I
|
|
3.0
|
13.09 |
13.79 |
14.74 |
12.98 |
13.60 |
14.47 |
| 3.5 |
12.97 |
13.64 |
14.57 |
12.86 |
13.47 |
14.32
|
|
4.0
|
12.86 |
13.52 |
14.43 |
12.73 |
13.34 |
14.19 |
| 4.5 |
12.76 |
13.41 |
14.31 |
12.61 |
13.21 |
14.06
|
|
5.0
|
12.66 |
13.31 |
14.21 |
12.50 |
13.09 |
13.94 |
| 5.5 |
12.58 |
13.22 |
14.13 |
12.40 |
12.99 |
13.86
|
BMI was computed following the internationally accepted standards formula,14 which is: BMI=Weight (in kg)/ [Height (in m)]2 and the unit is kg/m2
RESULTS
Table 3 presents the anthropometric characteristics of the studied children. It was found that age combined mean height for boys and girls were 99.29 (3.67) cm and 98.48 (3.50) cm respectively. It was also found that there was a significant increase in mean height with increasing age (boys: F=191.34, p<0.001; girls: F=156.09, p<0.001). The age combined mean weight for boys and girls were 13.31 (1.36) kg and 12.91 (1.17) kg respectively. Mean weight also increased significantly with age (boys: F=59.45, p<0.001; girls: F=62.00, p<0.001). The age combined mean BMI (kg/m2) were 13.48 (SD=0.92) for boys and 13.30 (sd=1.00) for girls. The sex combined mean BMI (kg/m2) was 13.39 (0.96). Mean BMI kg/m2 decreased with age up in both sexes, except at age of 5 year (means, boys=13.19; SD=0.78) and 13.20 (SD=0.61). Over all (age combined) sex difference in mean BMI was observed (t=2.37; p<0.05) and age specific sex differences in mean BMI were also noticed at the age of 3.0 (t=2.27; p<0.05) and 3.5 (t=3.02; p<0.05) years. Overall and sex specific age variations in mean BMI were also observed (boys: F=21.76, p<0.001; girls: F=7.43, p<0.001).
Table 3: Anthropometric Characteristics of the Subjects.
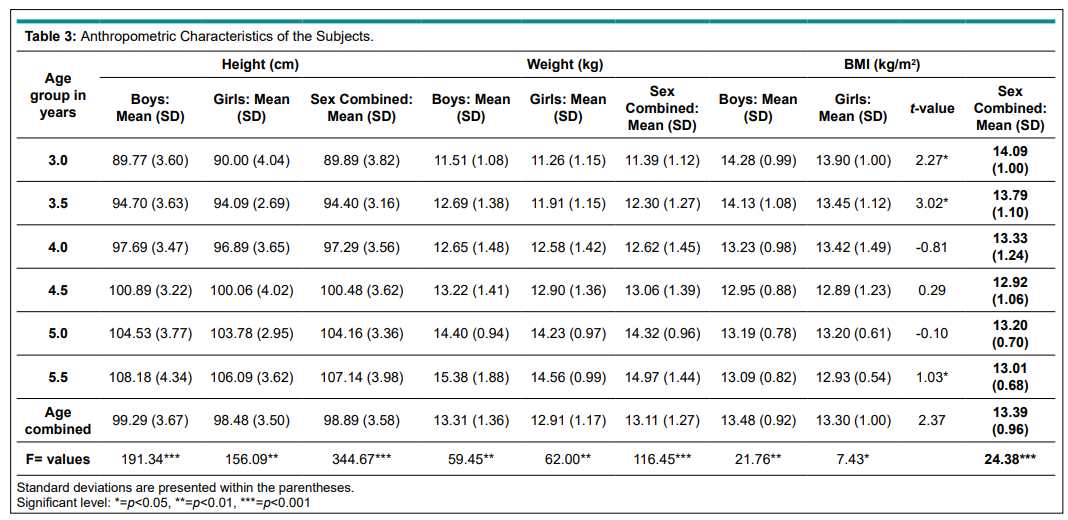
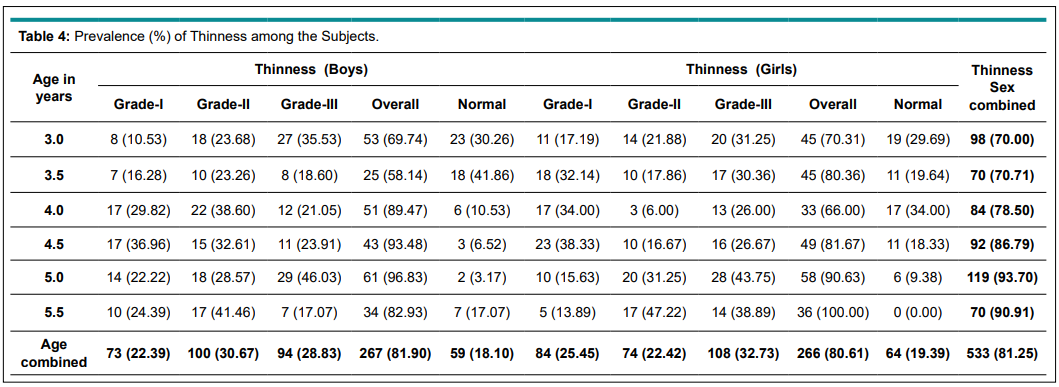
Table 4 shows the prevalence of thinness among the subjects. The age combined prevalence of thinness among the boys and girls were 81.90% and 80.61%, respectively (Figures 1 and 2). Age and sex combined prevalence of thinness was 81.25%. The highest prevalence rates of thinness were found in the age group of 5 years for boys (96.83%) and in the age group of 5.5 years among girls (100%).
Figure 1: Prevalence of Thinness (%) Among Boys.
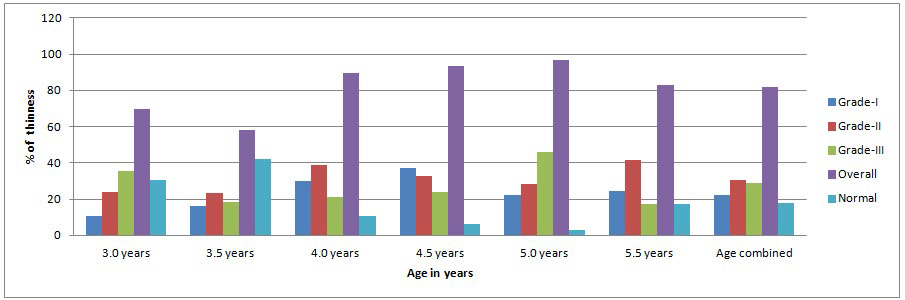
Figure 2: Prevalence of Thinness (%) Among Girls.
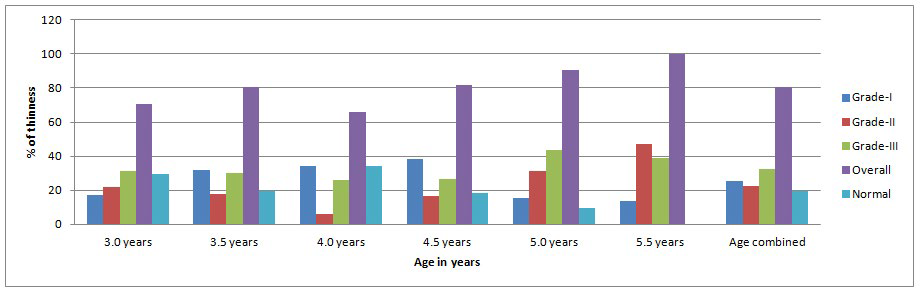
Table 4: Prevalence (%) of Thinness among the Subjects.
It is well established that undernutrition among the children is a serious global public health problem, especially in developing countries.15 The underfed still outnumbered in the developing world among Asian, African and Latin American populations.16 In spite of the economic development in that region, undernutrition remains an important public problem in many Asian countries.17 Previously, estimation of the level of under nutrition for preschool children based on BMI was not suitably possible due to the lack of appropriate cut-off points. Cole and others12 have developed suitable thinness cut-off points for children aged 2-18 years. Based on this cut-off point, our study showed that the prevalence of thinness among the Bengali preschool ICDS children was 83.54% which was slightly lower than the ICDS children (85.20%) of Bali-Gram Panchayat, Hooghly, Arambag, West Bengal, India.18 However, it was much higher than the prevalence of thinness among ICDS children of Chapra (50.70%),19 Barui ICDS children (65.30%) of Purulia, West Bengal,20 ICDS children of Vadodara (63.00%), Gujarat21, ICDS children of Patashpur, East Medinipur, West Bengal (59.10%)22 and Santal children of Purulia, West Bengal (56.40%).23 All these discussed (Table 5; Figure 3) studies were conducted in agricultural based rural areas. The prevalence of thinness among them was only 4.2%. Thus, the nutritional condition of these Indian children is worse than preschool children of Gaza Strip.24 Therefore, the results of the present study clearly indicated that, irrespective of sex, very high rates of thinness was observed indicating an unsatisfactory nutritional situation.
Figure 3: Comparison in Prevalence (%) of Thinness with other Studies.
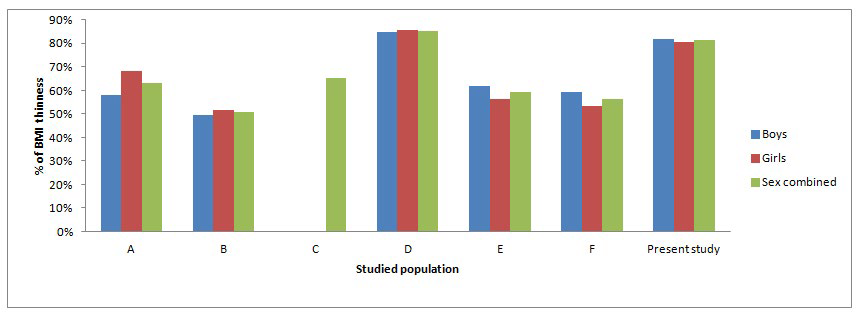
A= ICDS children of Vadodara, Gujrat, India.21
B= ICDS children of Chapra, Nadia, West Bengal, India.19
C= Barui scheduled cast children of Purulia West Bengal, India.20
D= ICDS children of Bali-Gram Panchayat, Hooghly, Arambag, West Bengal, India.18
E= ICDS children of Patashpur, East Medinipur, West Bengal, India.22
F= Santal children from Purulia, West Bengal, India.23
Present study=ICDS pre-school children from Sagar Block, Sunderbans, South 24 Parganas, West Bengal, India.
| Table 5: Prevalence of Thinness among Preschool Children: A Comparison with Other Studies. |
|
Studied population
|
Prevalence of Thinness |
| Boys (%) |
Girls (%) |
Overall (%) |
Studied By
|
| ICDS children of Vadodara, Gujrat, India. |
58.00
|
68.20 |
63.00 |
Bhalani and Kotecha21
|
| ICDS children of Chapra, Nadia, West Bengal, India. |
49.68 |
51.57 |
50.70 |
Biswas et al19
|
|
Barui scheduled cast children of Purulia West Bengal, India.
|
– |
– |
65.30 |
Das et al20 |
ICDS children of Bali-Gram Panchayat, Hooghly, Arambag,
West Bengal, India. |
84.80 |
85.60 |
85.20 |
Mandal et al18
|
|
ICDS children of Patashpur, East Medinipur, West Bengal, India.
|
61.80 |
56.50 |
59.10 |
Mandal et al22 |
| Santal children from Purulia, West Bengal, India |
59.50 |
53.30 |
56.40 |
Das et al23
|
|
ICDS children from Sagar Block, South 24 Parganas,
West Bengal, India.
|
81.90 |
80.61 |
81.25 |
Present Study
|
CONCLUSION AND RECOMMENDATIONS
Although, one of the limitations of our study was a relatively small sample size, we can conclude that Bengalee preschool children of both sexes in Sagar Block, Sunderbans, South 24 Parganas, West Bengal, India, were found to be under serious nutritional stress. A recent study25 from a rural area of Karnataka has highlighted the importance of studying thinness to evaluate nutritional status among ICDS children. Our paper reports new findings on the prevalence of thinness among preschool children of Sunderbans. These findings are very useful not only as a source of database but they can also be utilized for comparisons with other regional, national and international studies. Herein lies the uility of our investigation. Thus, in the Indian context, we suggest that similar studies be undertaken amongst other ethnic preschool children, especially in rural areas, to determine the prevalence of thinness using these new international cut-off points. Such studies would help us to generate new data which can be used for comparison with the prevalence of thinness in the regional, national and global context. Better health and nutritional intervention policies can be formulated based on the findings of these investigations.
ACKNOWLEDGEMENT
The authors would like to thanks all the concerned ICDS staff and also parents of the subjects for their assistance. We owe our thanks to the children who participated in this study. Special thanks are due to the ICDS authority of Sagar Block. South 24 Parganas.
COMPETING INTEREST
The authors declared that they have no conflict of interest with respect to the research, and publication of this article.


