INTRODUCTION
Spatial epidemiology is the description and analysis of geographic distributions and developmental changes in disease risk or incidence with geographical information system and geospatial analysis.1,2 Since the use of geographic analysis in characterizing the spread and possible causes of outbreaks of infectious diseases dating back to the 1800s,1 progress has been made in many aspects of spatial epidemiology, including disease mapping,3,4 risk assessment in relation to point or line sources,5,6,7 geographical correlation studies,8 and cluster detection and disease clustering.9,10
Some studies have reviewed the related literature on spatial epidemiology and summarized the progress in this research field. Advances in approaches to investigate local spatial variations in diseases have been analyzed, and developments in exposure modeling and mapping, enhanced study designs, and new methods of surveillance of large health databases were keys to understand the complex relationships of environment to health.1 Since the impacts of landscape structure on epidemiological processes have been often neglected, a true integration of landscape ecology with epidemiology was considered to be fruitful.2 Exposure assessment was improved with developing geospatial analysis techniques to enable the visualization of uncertainty and ensure that more meaningful inferences are made from data.11 Spatial methods, including geocoding, distance calculations, residential mobility, spatial aggregation, clustering, spatial smoothing and interpolation, and spatial regression, were widely used in epidemiology.12,13
Statistical analysis of the relationships between these data could highlight correlations between environmental variables and epidemiological variables, thus making it possible to better understand and possibly quantify the modes of transmission of a pathogen according to environmental conditions. This approach to analyzing patterns of transmission constitutes landscape epidemiology.14,15,16 Landscape epidemiology describes how the dynamics of populations of hosts, vectors and pathogens interact spatially in an environment that makes transmission possible.15 In general, different types of factors are involved in the evolution of animal diseases, whether genetic, biological, but also environmental, climatic, or political, economic, demographic and societal factors.17
Moreover, considering spatially distributed factors, spatial epidemiology has provided a valuable modeling framework for investigating the dynamics mediating the transmission of emerging diseases.18 With the growing popularity of these studies, spatial measurement errors were found to be ubiquitous threats to the validity of spatial epidemiological studies, and so the various mechanisms generating these errors should be revealed.19 In the last 10-years, although several spatial decision support systems have been developed to facilitate data collection, analysis, and decision making, standardization for functionality and system development and flexible interfaces, they all still need to be addressed. Moreover, real-time distributions of the causative agents and their vectors can be updated rapidly by connecting remotely-sensed environmental records with terrestrial-captured data.20
Broadly speaking, the various studies carried out on the determinants of rabies in Morocco; contribute to a better understanding of the influence of these factors on the transmission of rabies. The contribution of an analytical approach to describe the patterns of transmission of the rabies virus according to environmental characteristics is detailed from examples from a previous research work. Based on the hypothesis by which landscape characteristics can explain the spatial heterogeneity of transmission of the rabies virus in Morocco, we illustrate this approach with a study on the alignment between dog habitat, socio-economic environmental characteristics and epidemiological data. A multiple correspondence analysis (MCA) statistical analysis followed by a linear regression to set an ascending hierarchical classification has first highlighted the existence of four determinants of animal rabies in Morocco, which can be interpreted to be risk factors of the disease.21
The multivariate logistic regression analysis method was chosen because the variable to be explained was binary and the explanatory variables were quantitative and qualitative. Qualitative risk assessment and disease mapping have been in particular useful in data-scarce environments, often encountered in developing countries, with little available quantitative data on potential risk factors.22,23,24
Despite being subjective and with a tendency to overestimate the risk,25 the qualitative risk assessment approach has proven to be transparent and efficient to estimate the likelihood of animal disease occurrence when limited data are available.26 Over the last few decades, different methods for risk assessment and risk mapping have been widely used to support targeted and cost-effective animal disease surveillance.27
While considering that national veterinary services are severely understaffed and suffering limited resources to keep up the quality of the data, there has been ultimately very relevant effort to identify geographic clusters of the disease to better focus control on high-risk areas. The research hypothesis that emerges from this is: will the qualitative risk assessment analysis be able to reduce uncertainty in terms of disease knowledge, try to draw up a geographical distribution of the disease which approaches the field situation and give then oriented control actions of the disease?
This is the starting point in this research study on risk assessment methods of animal rabies. The specific objectives and emergent research questions are to: (1) understand the changes on spatial epidemiology of rabies by using the determinants of the disease; (2) identify the burst of areas at risk and explore new pathways of rabies control related to spatial epidemiology.
Data Sources
In order to study the spatial epidemiology of animal rabies in Morocco, a data set have been collected to cover a broad range of indicators of environment and human activities as well as to reflect field reality. Using qualitative risk assessment methodologies enabled an in-depth profiling of animal rabies to be made. These data are as follow:
– A data collection from national information system (SIPS) covering the period from 2004 to 2017. A total of 1 346 animal rabies cases were recorded.
– A data set of 3 528 records on habitat, human, social and economic related to 168 counties from the Moroccan “High commission of planning” (Census records of 2014).
– Data on animal rabies risk factors highlighted in previous study taking into account several factors as geographical affiliation, socio-economics and demographic characteristics of the environment in which dogs evolve in Morocco.
– A shapefile data that represents the 1,542 counties of Morocco that we collected from the high commission of planning.
METHODOLOGY
The data were prepared for use by following the steps outlined in the methodological model figure: Importation of data in quantum geographic information system (QGIS), data analyse on QGIS and mapMCDA.
Importing Data into QGIS
We have started by importing the Excel table which contains the data of the various risk factors in addition to the cases of rabies in affected dogs and animals spread over 168 counties using the delimited text tool. Then, we have imported the shapefile of the counties of Morocco using the vector tool.
Data Processing on QGIS
The risk factors are represented geographically by points which constitute the centroid of the municipalities. In order to use the data found in the attribute table of this layer, we have joined the attributes by location with the shapefile of the municipalities to allow the visualization of each risk factor. However, while using these factors each one separately at the mapMCDA tool, we have applied the rasterization tool (vector to raster).
MapMCDA
MapMCDA is an estimation method currently using linear functions for scaling that helps producing risk factor weighted risk maps using expert knowledge. The typical use case is the lack of reliable data on disease outbreaks, but the information available on risk factors is well-known.
In order to design a stratified sampling or surveillance campaign, a preliminary risk map based on expert judgment is needed. This package (and method) provides a systematic and guided approach to constructing such maps.
The set includes a graphical user interface (Glossy) that assists in the treatment and the weighting of risk factors.
The mapMCDA package facilitates the weighting of several risk factors to produce an epidemiological risk map.
Nevertheless, the expertise of the user is crucial and it is expressed at three levels:
1. Choice of relevant risk factors.
2. For each factor, common risk scaling (e.g. between 0 and 100).
3. Two-by-two assessment of the risk factors relative importance.
In accordance with the research design, methods described above are organized in terms of coverage and in-depth analysis. We first conducted a mapMCDA analysis, initially approached to characterize rabies spatial variability using qualitative risk assessment framework. We then applied a cross-validation using rabies data collection for a period from 2004 to 2017 to appreciate alignment meaning. Finally, we estimated the exposure effect to risk categories through rabies occurrence risk relative.
RESEARCH RESULTS
Analysis of Rabies Spatial Evolution in Morocco
Overall, the geographic distribution of animal rabies does not seem to have any particular shape because it does not only affect most of the provinces but its incidence at the provincial level also varies from year to year. However, it should be noted that the geographic pattern of rabies has changed significantly over the past 20-years. The rural environment accounts for the majority of the cases of animal rabies declared with 81% of the cases against 19% of the cases in the urban environment, thus testifying the imposing rural predominance of the disease (Figure 1).
Figure 1. Rabies Geographic Distribution–Period: 2004-2017

Furthermore, another important determinant of the spatial heterogeneity of the transmission of dog mediated rabies, listed in another research work, concerns aspects related to municipal infrastructure. Indeed, the existence of local veterinary services, municipal hygiene offices, dog poundages, fenced and controlled landfills as well as slaughterhouses is a must for waste management of carcass seizures. Hence, this will make it possible to avoid dog and animal rabies in this well-endowed geography, and in particular to contribute to better understand the determinants that transmit the rabies virus. In rural areas, slaughterhouses and livestock markets have not been under strict enforcement of regulations requiring policies for proper waste management, and are thus ideal gathering places for dogs. Therefore, elected spots of major contamination for free roaming dogs as well as for other animal species are subsequently developed in these areas. It appears that throwing away seizures of vicera and carcasses from these establishments into the wild without denaturing or incineration, or catering waste within livestock markets, constitute feed resources of choice for ownerless and stray dogs. This provides them with conditions of survival as well as good reproductive health. This context promotes then an excellent dynamic survival of the canine population and thus enhancing the transmission risk of rabies virus within and between animal species in areas with these determining factors (rural habitat, lower county development index (CDI), livestock markets, rural slaughterhouse, etc).21
Epidemiology of Rabies Using mapMCDA Tools
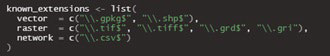
The mapMCDA tool uses as source data type: Vector, Raster and Network (CSV) (Figure 2).
Figure 2. Data Types for MapMCDA
The risk factors on which this study is based are the four ones mentioned above (rural habitat, lower CDI, livestock markets, rural slaughterhouse).21 We have compared their relative importance 2-by-2 on a scale of 0 to 9 and represented these relationships in a matrix which must have 1 in its diagonal. The system calculates the most consistent weights with these pairwise valuations, with the function “compute_weights”. In this step, weights are assigned according to the impact of each factor which is precisely related to the OR calculated in previous research work (Table 1). In such way, the factor of row ‘’i’’ is x [i,j] times greater than the factor of column ‘’j’’.
| Table 1. Results of the Modeling of Risk Factors Associated with Canine Rabies [Khayli et al21] |
|
ORMac
|
p |
OR |
p
|
|
Weekly Rural Markers
|
1.95 |
0.001 |
7.50 |
0.006 |
| Rural Habitat |
1.92 |
<0001 |
9.07 |
0.003
|
|
Human Density
|
2.05 |
0.003 |
8.76 |
0.003 |
| Slaughter House |
l.92 |
0.01 |
2.58 |
0.04
|
For this study comma-separated values (CSV) tables will not be used mainly because there is no research interest for this study on dog mobility data, but also due to the shapefile format created which takes only into account the geometry and cannot specify which column of the attribute table would be considered as a risk factor (Table 2).
| Table 2. Risk Factors Included in mapMCDA Interface |
|
|
Name_orig |
Name_New |
Type |
Admin_unit |
| 1 |
Counties_2015 |
Admin_unit |
Vector |
☑
|
|
2
|
Density_CDI |
Human Density/CDI |
Raster |
□ |
| 3 |
Habitat_rur |
Rural Habitat |
Raster |
□
|
|
4
|
esslghthouserur |
Rural slaughterhouse |
Raster |
□
|
|
5
|
Ess_live_stock_market |
Rural livestock market |
Raster |
□
|
To convert data into usable risk factors on mapMCDA, each risk factor was represented in the form of a choropleth map, and then we rasterized (vector to raster).
Moreover, the layer we want to use as base vector layer was cheked in this layer. A column of the mapMCDA risk, obtained by combining the different risk factors is included in its attribute table.
In this step, the tool harmonizes original scales into a common risk scale between 0 and 100, to subsequently combine different factors using a specific weight.
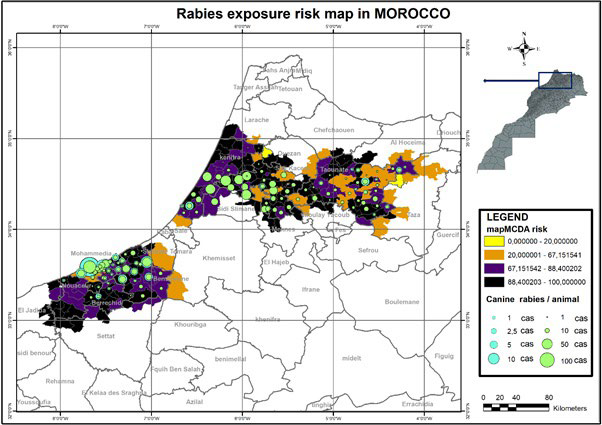
Results provided by the package are series of risk maps based on risk factors weighting method (Figure 3). This analysis methods combination is able to fully reveal the influence of animal rabies distribution on veterinarian’s ability to effectively implement enforcement activities against the disease in Morocco. For our study area, we model data with a risk map and here is what it looks like in Figure 4.
Figure 3. Weighing Risk Factors in mapMCDA Interface
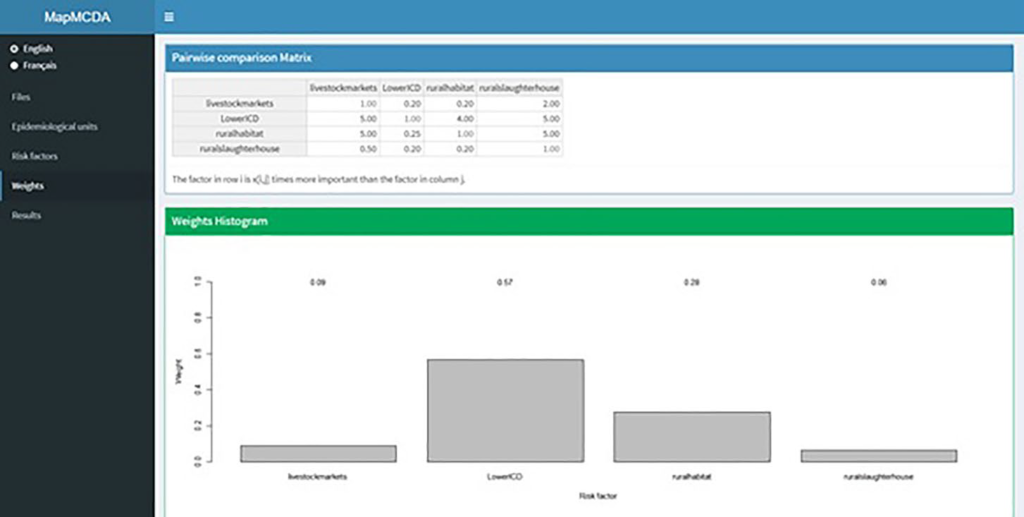
Figure 4. mapMCDA Risk Map of Animal Rabies

Validation step of mapMCDA findings requires the use of the rabies cases notified during the period 2004-2017. The substantiation process iterates through all the output areas generated by the mapMCDA tool (Figure 5).
Figure 5. Validation of mapMCDA Risk Map with Rabies Reported Cases
Then, it creates a summary graph presenting the relationship between rabies cases locations and corresponding risk levels (Figure 6).
Figure 6. Proportion of Area and Rabies Cases in each Level of Exposure
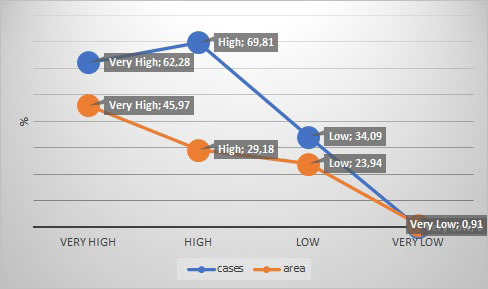
This figure shows how robust our quantitative risk assessment model really is and how close are identified areas to the real context. In other words, it expresses how well the model fits the data.
Interpretation
The rabies spatial distribution appears pointless and unclear given probably the underreporting of rabies cases. Spatial analysis does not allow concluding definitively on rabies hotspot locations. Nevertheless, a risk assessment analysis over a long period contributes to better understand involved processes and highlights importance of socio-economic factors, in addition to dog habitat determinant. This has been carried out in order to explain the rabies geographic distribution.
MapMCDA analysis over a period spread of 13-years allows establishing risk maps with more precision of the disease spatial distribution, in particular with the disease geographic clusters identified as well as validation process. At a glance, one of study results reveals the identification of animal rabies clusters in this environment which are dependent on the factors mentioned above. Results obtained of the disease geographic patterns during the study period show a clear discrimination of cases.
From this observation, this allows us to assess the impact of these factors, in terms of rabies maintenance in areas that were not previously a stronghold of the disease. It seems obvious that these risk areas can take over in terms of contamination and constitute a source for the spread of rabies throught the country.
As mentioned previously, the outcome in the model validation was the number of rabies cases in each risk area. This illustrated empirically a good alignment between the evaluation of risk estimates and the field situation.26 To put all this in perspective, we have checked the proportion of area and rabies cases in each level of exposition, as it should be with a close significant association for very high and high. In addition, the number of rabies cases notified in low and negligible levels is shown to be so small. Out of 168 counties involved in this study, 32.21% were at very high-risk, 16.52% at high-risk, 15.44% at low risk and 24.85% at negligible risk of rabies exposure (Figure 5).
Clustering of rabies risk estimates is decisive and highly reliable; hotspots areas are related to epidemiological data. Very high and high-level risk have been validated by a proportion of 62.28% and 69.81% rabies cases, respectively (Figure 5). Using a Mantel-Haenszel test, a significant alignment between the very high and high-risk estimates was demonstrated. The risk relative estimated for very high and high-level was 3.01 higher than very lower and lower-level (95 % credible interval: [1.90-4.79], p value< 0.0000001), and thus is closely connected to field situation.
DISCUSSION
This article reports on risk assessment study considering the potential of reflective practice in animal rabies control and its impact on exploring new control approaches. Findings suggest that the understanding of animal rabies distribution in Morocco, as inferred from data analysis relates initialy to geographic patterns identification.
Specific biological, ecologic, environmental, and societal factors have been identified that precede emerging infections. Improved understanding and assessment of the complex factors associated with disease emergence and spread will lead to better management and thus reduction of risk for disease occurrence.23 In fact, the application of a statistical model obtained by a linear regression shows that these models have a high capacity for discrimination but cannot be used for predictive purposes in new geographic areas except in a qualitative way (in terms of relative risk).28 Therefore, coupling the results of these analyses with the results of spatial analyses makes it possible to determine whether an identified spatial aggregate results from greater transmission due to specific environmental conditions, or simply reveals greater vulnerability of populations (socio-economical conditions) at this location.29
Being able to review a larger number of risks and possible risk management strategies in one analysis gives the risk manager a better aerial view of the problem, and helps strategize at a more global level.30 Nonetheless, all forms of risk assessment require the greatest possible collection and evaluation of data available on the risk issue, and require indepth knowledge in a variety of scientific disciplines.
Risk assessment can be either quantitative, (i.e., providing a numeric estimate of the probability of risk and the magnitude of the consequences), or qualitative, using a descriptive approach basing its assessment on the opinions of scientific panels.31 Qualitative risk assessment has been used with great success in various arenas of project and military risk for over a decade, and has found interest in animal health-related areas.30 Owing to the lack of relevant data and the very short period of time usually allowed to assess animal health risks on particular topics, this panel has been using a qualitative risk method for evaluating animal health risks or crises for the past few years.31 In the absence of data, qualitative risk assessment frameworks have proved useful to assess risks associated with animal health diseases.22
Squarzoni-Diaw et al,26 claimed that expert elicitation is crucial to identify the relevant risk factors for each risk pathway in the framework, but the method reveals possible uncertainty by the subjectivity of experts or the quality of data. In fact, some mathematical properties of risk matrices show that they have the following limitations: They can assign identical ratings to quantitatively very different risks, or can mistakingly assign higher qualitative ratings to quantitatively smaller risks. Inputs to risk matrices and resulting outputs (i.e., risk ratings) require subjective interpretation, and different users may obtain opposite ratings of the same quantitative risks.25 For these reasons, little research rigorously validates their performance in actually improving risk management decisions, and some limitations suggest that risk matrices should be used with caution, and only with careful explanations of embedded judgments.25 This approach has flaws and better methods are needed.27 Nevertheless, scope exists to elaborate the current standards and guidance, which better serve the principle of science based decision-making.27
In a previous study on animal rabies in Morocco, the environmental and anthropogenic data have been included as explanatory variables in the analysis related to dog habitat (urban or rural), level of municipal and community equipments (CDI) in terms of public health management infrastructures: pond or landfill, slaughterhouse, livestock market.21 This condition was verified upstream of the statistical analysis (by verifying the independence of the variable to be explained by statistics measuring spatial dependence).32
Based on a MCA statistical analysis related to the study mentioned above, risk factors guidance was established. The rabies determinant’s factor odd ratio (OR) have been already estimated in Morocco and a classification for weighing and evaluating risks with a score, allows to have an objective position and to avoid expertopinion subjectivity. The original feature of this approach lies in the combination of epidemiological data and risk factors within the same framework. The graphic representation of the processed data is a series of hotspots of the study areas. Rabies determinants have been assessed for specific risk questions. The resulting hierarchical risk estimates have been determined by authors based on existing data and not through expert opinion elicitation.
The advantage of looking to risk assessment is that its large body of research has been conducted primarily on livestock animal diseases. Its ideas are based not on intuition, but on systematic observations and empirically supported conclusions that have withstood rigorous scientific testing. Our risk assessment study, as described here, can be included in both qualitative and quantitative rationale, but this may understate the important differences between both methods in their structure and their relative levels of objectivity. An Food and Agriculture Organization (FAO) report specific to semi-quantitative risk characterization claimed that it demands as prerequisites some statistical skills (e.g. multiple correspondence factor analysis) as quantitative risk assessment but it does not require the same amount of data; which means it can be applied to risks and strategies where precise data are missing. The integration of analytical epidemiology to obtain risk estimations opens a path for better analysis.
Authors describe a new set of levels and give more precise enumeration of categories that cover broad ranges of probability as well as the items considered when addressing animal health consequences.31 This research study offers an improved level for the textual evaluation of qualitative risk assessment since it gives more consistent and rigorous approach to assessing and comparing risks than does conventional qualitative risk assessment. Using mapMCDA method offers sound evidence that can be applied toward increasing sharp analysis. So, then it avoids some ambiguities and will be able to reduce considerably the uncertainty.
For a normative process aiming to enhance objectivity of mapMCDA analysis, we suggest to conduct initially a statistical multiple correspondence analysis that will provide quantified estimates of risk factors. The obtained scores through OR or RR will be the key elements for weighing risk factors. This will be a fundamental step to avoid subjectivity of the expert-opinions on the spatial trends and to increase accuracy of the risk assessment analysis.
Through this risk assessment model, simulation of different epidemic geographic patterns of animal rabies shows the importance that certain municipalities influence the magnitude and severity of the epidemic. This illustrates empirically a good alignment between the evaluation of risk estimates and the field situation26 and suggests that an oriented control on these areas would prevent large epidemics of rabies to spread at a large scale.
LIMITATIONS
This study may contribute to a better understanding of animal rabies spatial distribution of in Morocco, and in particular, the importance of rabies and associated environmental variables. It also highlights limits of an analysis approach based on incomplete epidemiological data. Proportion of risk estimates areas that could not be validated by rabies occurrence is essentially due to unreported rabies cases. This highlights that the existing knowledge still not sufficient to fully understand field situation and can only give some cross-understanding of the disease.
As we evolve in contexts where data are severely missing- which could be considered as a limitation for this study, it is therefore imperative to explore and develop decision support tools adapted to rabies. Interpolative methods might be of a great benefit to build reliable spatial data of the disease and lead to implement robust risk-based control approach. The main purpose is to bring strength evidence on rabies geographic distribution to advocate for resources in line with the thoughts of risk-based approach and alternative cost-effective control possibilities.
CONCLUSION
The aim of this paper was to describe the improved risk assessment method taking into account the limitations of the conventional version. In conclusion, it can be said that mapMCDA is valued and is seen as an interesting qualitative risk assessment tool analysis when it addresses needs to identify rabies clusters. However, main rabies control challenge may lie in the dynamic interaction between new epidemiological analysis opportunities and service delivery requirements, as there maybe occasions where they vie with each other for resources.
Effectiveness of dog rabies control is inextricably linked to any improvements in required rabies data collection quality for epidemiological analysis. Use of risk assessment method such as mapMCDA would be more appropriate to correct gaps in epidemiological recording systems.
Development of new decision support tools, such as interpolation and prediction methods, seems to be decisive to exhibit robust spatial risk assessment of the disease, to target surveillance and finally to better streamline rabies control.
CONTRIBUTION
All authors have approved the final article. The data that support the findings of this study are available from the vet services of Morocco upon reasonable request.
ACKNOWLEDGMENTS
The data that support the findings of this study were provided upon reasonable request by the National Office of Food Safety (ONSSA)- Morocco.
The authors would also like to thank Dr. Kechna Rachid and Mr. Zrira Abdelali from the National Office of Food Safety (ONSSA), Rabat, Morocco, for contributing to the expert panel. A special thank to Ms. Galzim Naima for her priceless contribution to this research work. We also thank and highly appreciate the contribution of Professor Abdellatif Hemdaoui, English teacher, for kindly accepted to revise the linguistic aspect of the manuscript.
AUTHOR CONTRIBUTION STATEMENT
Khayli M and Kechna M conceived, designed the research study, analyzed and interpreted the data. All authors contributed materials analysis tools or data. Khayli M, Kichou F, Berrada J and Bouslikhan M wrote the paper.
FUNDING
No research funds or scholar grants.
ETHICS STATEMENT
The authors confirm that the ethical policies of the journal, as noted on the journal’s author guidelines page, have been adhered to. This is a scientific article with original research data.
CONFLICTS OF INTEREST
The authors declare that they have no conflicts of interest.


