INTRODUCTION
For several decades, various transboundary animal diseases (TADs) of domestic ruminants have continued to circulate in Africa. Among the most documented, we find the contagious ones, such as foot and mouth disease (FMD), peste des petits ruminants (PPR), sheep and goat pox (SGP) as well as contagious bovine peri pneumonia (CBPP), or even those with vector-borne transmission such as rift valley fever (RVF). Among these, three are established in Asia (Figures 1A, 1C, 2 and 3) where there are many pastoral populations like the African continent.
Figure 1. Spread of the Main Contagious (or transmissible for RVF) Diseases on the African Continent between 2005 and 2021 (Maps based on official OIE 2021 data26)
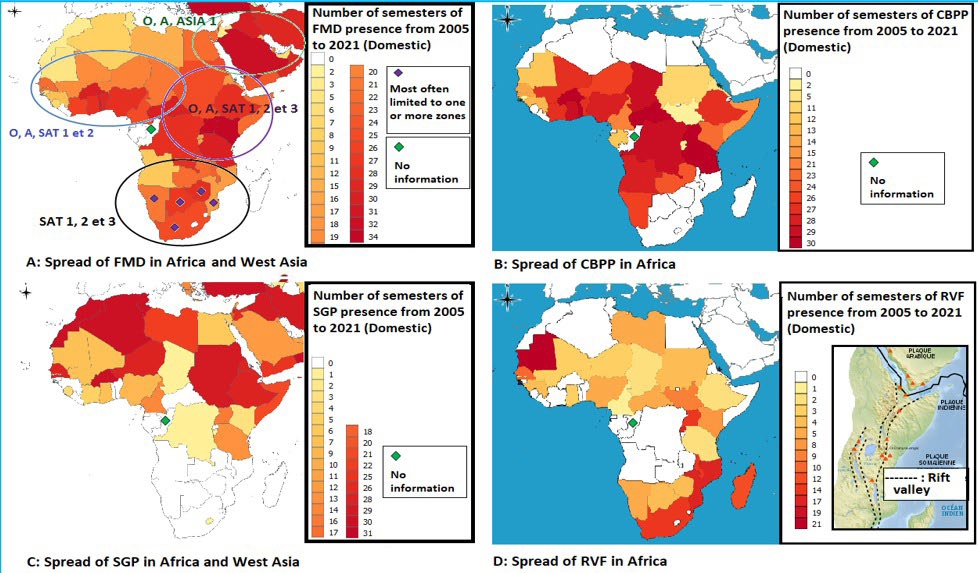
Figure 2. Spread of «Peste des Petits Ruminants» and its lineages: A-Extension from 1942 to 197227, B-Extension from 1972 to 200827, C-Extension of PPR lineages in 200828, D- PPR lineages affecting countries up to 201329
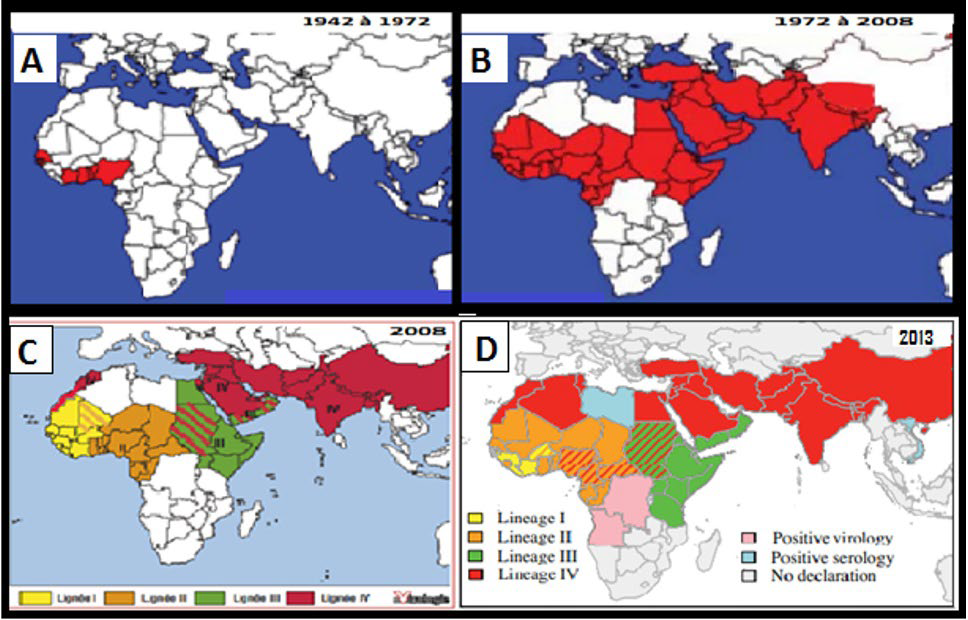
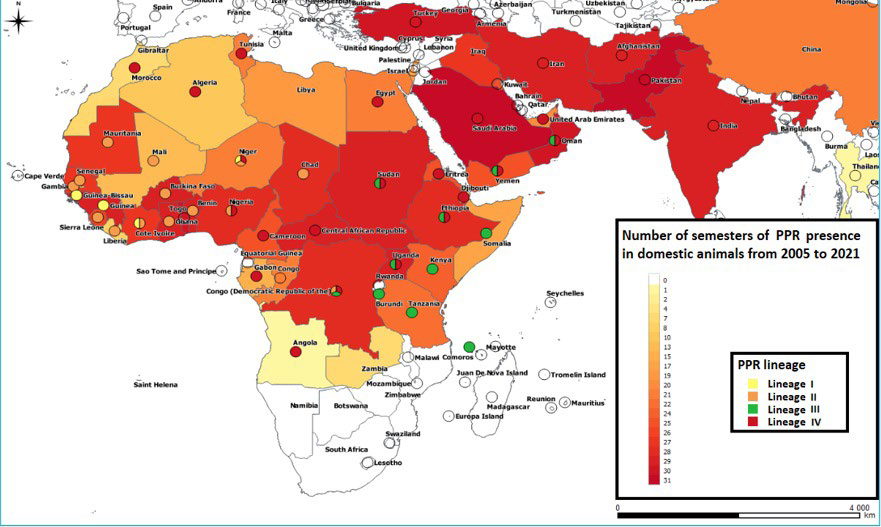
Figure 3. Occurrence of PPR between 2005 and 2021 and Lineages affecting Countries up to 2020. (Map based on Official OIE 2021 Data26, PPR Lineages were Reported by Albina29 in 2012 and by Dundon et al30 in 2020)
In Africa, where there are five major regions (according to United Nations Organisation (UNO)), these diseases are maintained in an enzootic state (occurring regularly) throughout a large area extending over three regions of the continent, ranging from Western to Eastern Africa and, passing through countries of Central Africa. Enzootics do not spare certain countries of North Africa, such as Egypt and the Sudan (Figures 1A, 1B, 2 and 3), or the countries of West Asia such as Saudi Arabia and Yemen (Figures 1A, 1C, 2 and 3), while the other countries of North Africa (Figures 1A, 1B) and those of the South African region (Figures 1A, 1B, 1C, 2 and 3) are not affected or are sporadically concerned by brief epizootics. This is not the case for invasive contagious diseases, such as sheep pox that extend not only to North Africa and West Asia (Figure 1C) but also to other regions of the Asian continent. However, curiously, certain countries in the South African region such as South Africa, Namibia, Botswana, Zimbabwe, and Mozambique seem to be spared or very lowly affected by the spread of cross-border contagious diseases (Figures 1A, 1B, 1C, 2 and 3). In the case of Rift Valley Fever, which is a vector-borne disease, several countries are out of the enzootic region recognized previously to show relatively regular epizootics events (Mauritania and Senegal for West Africa, Mozambique, Malawi, Rwanda, Uganda and Madagascar for East Africa) in the same way as South Africa and, to a lower degree, Namibia, Botswana and Zimbabwe which were until now little or not affected by the spread of contagious diseases (Figure 1D).
The practice of pastoralism and large-scale transhumance is one of the peculiarities of livestock breeding in Africa, particularly the Western region. These activities allow us to make use of seasonal grasslands, mainly in the dry season. Mixed herds show various combinations of cattle, sheep, goats, and camel species.1 The diversity in the composition of ruminant herds allows for maximizing the use of plant cover for each species since each generally requires different fodder.2 As a result, animal production in African rangelands depends essentially on the use of natural vegetation which is often coveted over long distances. Consequently, this mobility, whether transhumant or commercial, goes beyond state borders and promotes the spread of contagious diseases.3
Cross-border transhumance of ruminants in Africa has developed since the 1970s with population growth in the Sahel and the associated livestock crisis.4 This movement increased massively after the droughts of 1973 and 1984.1 It’s currently considered a major livestock system in West Africa.5 Some countries are host countries (Ivory Coast, Guinea Bissau, Togo, Zambia) while others are transit countries (Central African Republic.6,7,8 These transhumant movements are well-documented and have been cited by various sources including the Organization for Economic Cooperation and Development (OECD) in 20149 and Aubague et al10 in 2017. There are no reliable statistics to quantify the flows of animals concerned.11 However, estimates made by various breeders’ organizations report that more than two million cattle are driven annually in transhumance in Benin, Nigeria, Chad, Mali, and Burkina Faso. In Mauritania, the flow of transhumant animals towards Senegal and Mali is estimated at more than one million head, i.e., 5-10% of Mauritanian livestock.11 In the direction of Senegal, some 87,000 head of cattle were received from Mali and Burkina Faso in 2007, whereas in 2010-2011 only 2,330 cattle, 625 small ruminants, and eighty dromedaries were checked for outgoing, compared to 1,300 cattle and 148 small ruminants for entrants during the same period.1 These unexplained fluctuations highlight the difficulty of quantifying cross-border flows of ruminants in the continent.
Regarding commercial movements in Africa, several animal marketing circuits have been described.1,8,12-18 Data on the importance of trade transactions between African countries are not well-known and are often the subject of much controversy. Added to this, there are informal movements not recorded at customs. In West Africa, they can range from a few thousand to more than a million heads, mainly in Nigeria, Cote d’Ivoire, and Senegal. Indeed between 2000 and 2003, formal Senegalese imports of cattle from Mali amounted to some 6,500 head per year, while the flow of cattle from Mali and Burkina was estimated at some 85,000 head of cattle in 2007 according to the agribusiness and trade promotion project (ATP) study.19 The same study also mentioned that in 2007, the Ivorian market was supplied with 216,156 heads of cattle, 313,123 sheep and 531,281 goats from Burkina Faso, Mali and Niger. As for Nigeria, its imports from Chad via the southern axes of Lake Chad alone represented at least 200,000 to 520,000 heads in 2000, while those from Niger show official imports of the order of 100,000 to 200,000 heads according to the years. The scale of Burkinabé flows transiting through Benin towards Nigeria seems to have increased over the years since 2005 and would concern 150,000 to 200,000 heads in 2008. Thus, it is plausible to estimate the volumes of live cattle imported by Nigeria and coming from Chad and Niger, in a range going from 720,000 to more than one million heads per year, i.e., quantities of the order of 20 to 25% of the apparent consumption of the country.14
The present work sets the objectives of developing a cross-border mobility map for domestic ruminants on the African continent using a summary of the paths described in the bibliography, but also of analyzing the mobility network using the network analysis (NA) method. This aims to understand the role of the different countries involved in the movement and the different relationships and/or interactions linking them to the spread of epizootics.
Knowing that movements generally take place in mixed herds of ruminants2 and that the species composition of the flows is most often not documented, but also that for contagion or transmissibility, the diseases agents considered can be carried (FVR and PPCB)20,21 or propagated (SGP and PPR) by the various species of cohabiting ruminants in herds, the constraint of distinguishing between species in the flow of movements for the result interpretation doesn’t constitute limit for carrying out this work. The main objective of the current work was to map and analyze the routes of the different cross-border flows of ruminants in Africa, all species combined.
MATERIALS AND METHODS
Mapping and Data on Livestock Movements
Livestock movement mapping in Africa has been based on the use of Geographic Information System (GIS) software to draw movement flows, while movement analysis uses the network analysis method which is based on graph theory in mathematics, and starts from the hypothesis that the contact network has a greater influence than personal behavior on the spread of the disease.22
A network is a representation of a complex system by two elements: nodes and links. The nodes correspond to a set of actors (individuals or interest groups), and the links represent a certain type of relationship (friendly or professional for example) between two actors.23 In this study the nodes correspond to the countries and a link indicates the existence of a movement between the two.
Several databases were used in this study. Movement data were extracted from data reported by various authors on transhumance6-10 and trade circuits,1,8,12-18 The latter have been enriched by the “resource trade.earth” database, including their extensions with Asia between 2000 and 2020, accessible via the link: https:// resourcetrade.earth. 24
The different species of ruminants concerned by the movement are bovines (cattle, zebus, and buffaloes), sheep, goats, and camels. Movements to different countries include small ruminants and/or cattle, to which can be added camels such as caravans of nomads leading camels accompanied by small ruminants leaving from Mali and Niger to Algeria and Libya. Therefore, each flow can include one or more species of ruminants.
The paths identified and represented concern transhumance movements and formal commercial movements, all types combined.
Data on livestock for each country were imported from the FAO-STAT database, 2022.25
Epidemiological data on disease status and occurrence, namely SGP, FMD, RVF, PPR, and CBPP between 2005 and 2021 were imported from the databases of the official World Organisation for Animal Health (WOAH) website, «WAHIS 2021» including the second half of 2021.26 They allowed to produce the maps of Figures 1 and 3 using the Quantum Geographic Information System (QGIS) software.
The cartographic data on the PPR and its lineages from 1942 to 2008 and on the history of its lineages in 2008 and 2013, were reported respectively by Dialo,27 Minet28 and Albina29, while Lineage history data represented in Figure 3, were reported by Albina29 in 2012 and by Dundon et al30 in 2020.
Data Processing
Movements were introduced into a database with an origin (country of origin) and a destination (country of destination), to be transformed into paths using a single line per path after the elimination of duplicates. They were mapped by the geographic information software “QGIS” version 3.22.
The map coordinates of the countries are centered on the center of the polygon of these countries. They were calculated and obtained by QGIS software version 3.22. The reference coordinate system (SCR) used was EPSG: 4326, WGS 84.
The analysis of the network parameters was carried out by the “R” and “Rstudio” software using specific scripts corresponding to the «SNA», «Igraph» and «Ggplot2» packages to calculate the different parameters and indicators following their mathematical formulas.
Network Analysis Method
In epidemiology, network analysis allows an evaluation of the influence that connections between actors can have in the transmission of a given disease.22 Historically, the first example of its use in epidemiology dates back to sexually transmitted diseases. It allows to calculation of a large number of indicators and parameters, which will make it possible to qualify the network and classify the nodes according to their importance.31 Many measures have been proposed to quantitatively describe the structure of networks, but we will only cite below those used in the context of this work. Generally, these measures characterize networks from both a glob-al and local (centrality) view.32,33
a. The first category gathers the global measures that consider the whole of the network through statistical properties calculated on its entire structure and provides information on the cohesion parameters on it. They apply to all nodes and links, and allow, for example, to have an idea of how the structure of the network influences the spread of the disease.34,35,36,37
b. The second category gathers the parameters of local measurements which are interested only in the properties of the nodes and the links. This type of measurement aims to provide information on the neighbourhood of a node or to highlight certain structural properties.38-46 They include:
• Centrality parameters:
Those indicate whether a node occupies an important, central place in the network. These are parameters widely used in epidemiology to detect individuals, nodes, or key actors.
• Cohesion parameters: Who make it possible to identify the subgroups of individuals whose relationships are strong and cohesive. A definition of these indicators and their implication in epidemiology, based on deep documentation32-46 is presented in Table 1.
| Table 1. Defining Network Analysis Indicators and their Implications for Epidemiology |
|
Measurement Type
|
Concept |
Indicator |
Definition and Implications for Epidemiology
|
|
Global
|
Cohesion across the network
|
Density |
Its value, between 0 and 1, provides information on the overall connectivity within the network in relation to the percentage of links established between nodes, and gives an indication of the speed at which an epidemic would spread. |
| Mean distance |
For a graph with “n” nodes, it provides information on the proximity of nodes in the network and their ease of communication and exchange. |
| Diametre |
The diameter of a graph is the greatest distance between two nodes on the graph. This diameter, like the average distance, provides information on the ease with which network nodes can communicate. |
| Reciprocity |
Reciprocity corresponds to strong connectivity in graph theory. A graph is strongly connected if, for any pair of distinct vertices, there is a path from one vertex to the other, in both directions. Sheds light on the importance of reciprocal contamination between nodes for the spread of disease. |
| Transitivity |
Transitivity is the overall probability of the network having adjacent interconnected nodes, revealing the existence of closely connected communities at which pathogens can circulate in a loop and maintain themselves. It is calculated as the ratio between the observed number of closed triplets and the maximum possible number of closed triplets in a graph. |
|
Local
|
Inbound activity centrality |
Indegree |
Informs about incoming movements and expresses the node’s power to self-infect. |
| Outbound activity centrality |
Outdegree |
Indicates outgoing movements and expresses infectivity towards other nodes in contact with this node. |
| Intermediarity centrality |
Betweenness |
This is the number of times a node in the network connects pairs of other actors who would otherwise not be able to join. In other words, it represents the node’s ability to force flows to pass through it before reaching other nodes, and provides information about the node’s essential role as a mobility hub. |
| Proximity centrality |
Closeness |
Measures the average distance (inverse distance) from a node to all other nodes. Nodes with a high proximity score have the shortest distances to all other nodes. Proximity centrality is a means of detecting nodes capable of spreading epidemics very rapidly across a graph. |
| Spectral centrality |
Eigenvector Centrality |
Considers that the centrality of a node is determined by the centrality of the nodes to which it is directly connected. This measure gives equal importance to the actor who maintains links with other actors in the network who are themselves important, and provides information on the proba-bility of contamination from neighbors who are highly connected. |
|
Detection of cohesive subgroups
|
Cohesion
|
Component |
A component is the largest set of connected nodes. It is weak when there is no path for each node to reach the rest of the nodes in that component. This translates into epizootics that do not affect the entire component |
| Strong Components |
Strong components are commonly studied as predictors of final epizootic sizes. These are subsets of connected nodes with very strong relationships, with a path for each node to reach the rest of the nodes in its component. They therefore provide information on strongly connected establish-ments that can favor the spread of a disease. |
| Cliques |
It is a group of cohesive nodes within which each node can communicate with the others. The size of a clique “Kn” is the number of vertices “n” that make it up (for the purposes of this work, we are only interested in K3 cliques made up of 3 vertices that are interconnected in both directions, given the importance of these structures in the circulation and maintenance of pathogens). |
|
Articulation points
|
Cohesion and fragmentation |
Cutpoints |
These are critical points, when removed from the network, increases the number of components and the fragmentation degree. At articulation points with high centrality, the graph is highly vulnerable in terms of communication. These points are used to stop the spread of epidemics within the network. |
Network analysis also makes it possible to detect the existence of communities within the structure. A community is defined by a current graph as a group of nodes that are particularly linked to each other and weakly linked to the rest of the network. To highlight the communities in the context of this work, two methods (algorithms) based on modularity47 were applied. The latter, which is a partitioning quality measure, makes it possible to highlight the significant existence of homogeneous community structures with similar behavior when its value is high (>0.3)48:
• The «Edge betweenness» algorithm: Often referred to as the Girvan and Newman algorithm,47 this is a division algorithm that operates according to the hypothesis that the links connecting nodes of distinct communities will have scores of high betweenness centrality.
• The «Fast Greedy Cluster» algorithm: The Fast Greedy Cluster algorithm is an agglomerative hierarchical clustering method that optimizes modularity by merging the pair of communities at each step to produce the greatest increase in modularity.49 At the beginning, it considers each node as a community and it proceeds by analyzing the modularity of each pair of communities, to choose those with the highest modularity and unite them. It repeats this pass until all nodes are part of a single community and finally, it chooses the partition with the maximum modularity.16
ANALYSIS AND INTERPRETATION OF RESULTS
Flows Mapping
In total, 483 flows were recorded, they concerned 50 African countries and 19 Asian ones. Considering the great heterogeneity in the regularity of data collection from one year to another, it was decided to set an occurrence threshold. According to this, they were sorted into two groups of flows, one comprising irregular flows and the other comprising the most regular flows. A threshold greater than or equal to 42% was retained for a commercial flow to be considered regular.
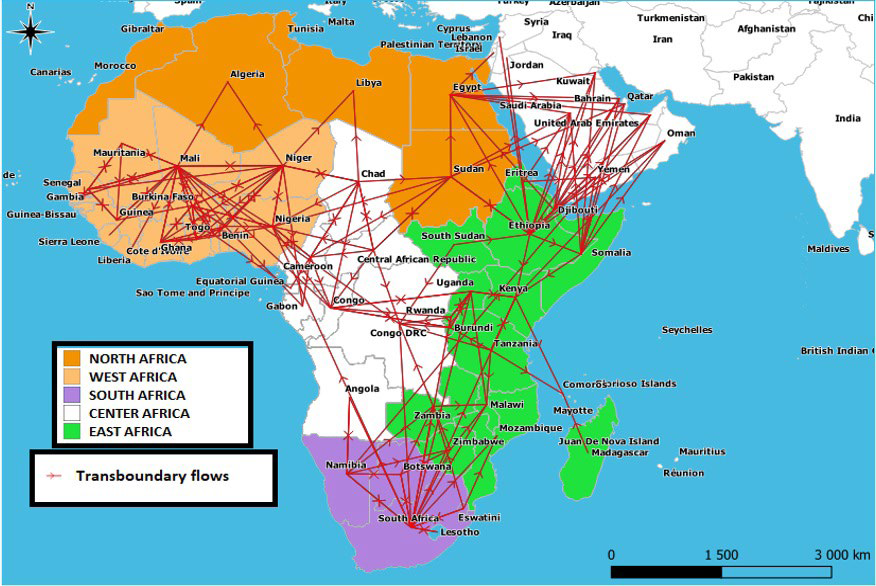
a. Irregular flows: Irregular flows include 293 routes that connect East Asia (China), South Asia (India, Pakistan, Afghanistan, Sri Lanka), West (Middle East countries), and South-East Asia (Thailand) to the African continent, they also connect regions of the continent which are very distant geographically. Thus, we observe that long-range inter-regional flows can be established between the countries of South Africa region and those of West and Central Africa regions, or even between East Africa and West, Central and North Africa. While in West Asia, we see that the Arabian Peninsula, which is supplied doubly with livestock from Asia (India and Iran) and Africa, occasionally redirects flows towards the latter. Consequently, all these flows favor the introduction of diseases into regions other than their regions of origin (Figure 4).
Figure 4. Mapping Irregular Flows of Domestic Ruminants in Africa and their Connections with Asia

b. Regular flows: The regular flows, numbering 190, are characterized by their much shorter range. Indeed, these routes, which also include transhumant movements between the Sahelian countries, connect countries with an immediate neighborhood or can even extend to other neighbors without, however, having a large reach as the previous flows. For these flows, we can note an intense exchange between West African countries as well as between the countries of the African Horn (Somalia, Ethiopia, Djibouti), Sudan, Egypt, and the West Asian countries. As for the countries of the South African region, they appear much more united among themselves and with those of East Africa which they supply, while the countries of North Africa (except Morocco which is not part of the regular movements network), receive flows from their neighbors in the Sahel, but also from East Africa to Egypt and Sudan (Figure 5).
Figure 5. Representation of Domestic Ruminants Regular Flows between African Countries and Regions (African regions according
to the UN) and their Extension to West Asia
Movement Network Analysis
The regular flow network was processed using the network analysis method, to calculate the main parameters and indicators.
a. Global and network-wide measures: In the regular flow network, a total of 190 distinct flows were identified. The nodes, numbering 57, represent the African countries concerned by the cross-border mobility of livestock as well as the countries of West Asia (Arabia, Yemen, Oman, Qatar, etc.) that receive it from Africa. The descriptive parameters of the network are described below, their respective values are recorded in Table 2.
| Table 2. Network Description Parameters |
|
Paramètre
|
Valeur
|
| Number of nodes/size (length) |
57
|
| Number of links |
190
|
| Length (average distance) |
3.64
|
| Diameter |
9
|
| Density |
0.060
|
| Réciprocity |
0.406
|
| Transitivity (Clustering coefficient) |
0.374
|
| « Kappa » heterogeneity coefficient for « indegree»(a) |
1.38
|
| «Kappa » heterogeneity coefficient for « outdegree»(a) |
2.29
|
| Number of «weak components» |
1
|
| Number of «Strong components»(b) |
28
|
| Size of the 2 largest strong components |
25 et 6
|
| Modularity «Cluster Fast Greedy» (Qcfg) |
0.55
|
| Modularity «Edge Betweenness» (Qeb) |
0.18
|
| Cutpoints |
9
|
| (a): Kappa= <K^2>/^2 where < > indicates the mean value and k is both the «indegree» and «outdegree». (b): Each isolated node not belonging to the 2 groups of strong components is also considered on its own as a strong component (57-(25+6)=26 isolated nodes+2 strong components=28 strong components). |
Density: The network has a density of around 0.060 which shows that among all the possible links that must be established between the 57 nodes of the network, only 6% are established.
Average distance: Two countries are on average separated (Average distance) by 4 (3.64) intermediate animal movements.
Diameter: The diameter of the graph with the value of 9 provides information on the maximum distance between 2 points, it is relatively low compared to regular graphs type, thus expressing the speed that epidemics can show when passing through it during their propagation.
Reciprocity: Displaying 0.406 for the present network, showing that 40.6% of cross-border movements between countries take place in both directions.
Transitivity: For this network, in 37.4% of cases, when a country is linked to two others, the latter two are also linked to each other.
• The «Components»: The network is made up of a single “Weak Component”. Within this component, however, we can find countries that are strongly connected to each other in subgroups, the “Strong components” numbering two.
b. Detection of cohesive groups
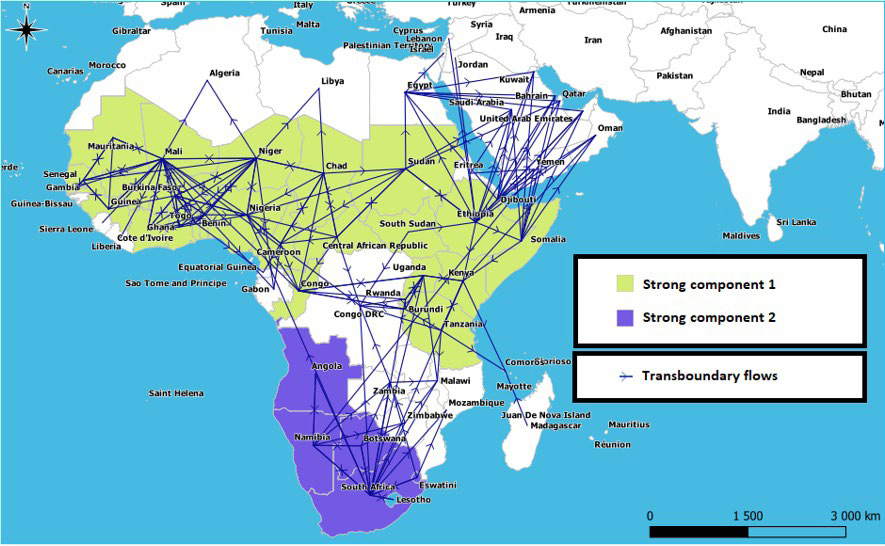
Strong components: Two strong components, each comprising several countries, were found on the African continent. The first brings together 25 countries which extend over three regions of Africa, ranging from the Atlantic coast to the coasts of the Indian Ocean, while the second brings together the 5 countries of the South African region in addition to Angola. Within each strong component the countries are very connected to each other, there is therefore a path for a given pathogen present in one of them to quickly spread to all the other countries of this same component by only following livestock movements. In Africa, these zones represent the basic space for rapid circulation and maintenance of pathogens before they can spread to other countries or regions through the movement of animals (Figure 6).
Figure 6. Map Showing the Extent of the Network’s “Strong Components”
c. Local network indicators
The nodes activity parameters “indegree” and “outdegree”:
The part of “indegree” and “outdegree” in the nodes centrality:
Considering the large number of countries studied, only the first 25 are presented in Table 2.
When looking to the part of “indegree” and “outdegree”, it appears that Mali’s outdegree value is the highest and represents more than double of its indegree value (outdegree: 16, indegree: 7) like Niger (outdegree: 12, indegree: 5), Chad (outdegree: 7, indegree: 3) and Sudan: (outdegree: 7, indegree: 3). Other countries have an “outdegree” value 3 to 4 times higher than their “indegree” value such as South Africa (outdegree: 14, indegree: 4), Ethiopia (outdegree: 13, indegree: 3), Egypt (outdegree: 8, indegree: 3), the Central African Republic (outdegree: 6, indegree: 2) and Eswatini (outdegree: 3, indegree: 1), while Extreme countries such as Djibouti (outdegree: 9, indegree: 1), Somalia (outdegree: 8, indegree: 1) and Tanzania (outdegree: 5, indegree: 1) have a high outdegree and a very low indegree. In epizootics events, leading to their livestock contamination, these countries can play an significant role in the dissemination of diseases to the countries with which they are in contact. Conversely, nodes such as Nigeria (indegree: 10, outdegree: 4) and Congo DRC (indegree: 8, outdegree: 0) have a high indegree and a very low or even null value of outdegree, which makes them very vulnerable to disease contamination from the different countries that feed their cross-border flows (Figure 7).
Figure 7. Mapping of Domestic Ruminants Cross-Border Movements in Africa, Showing the “Betweenness” Intermediarity, “Indegree”,
“Outdegree” and Livestock Numbers Per Country
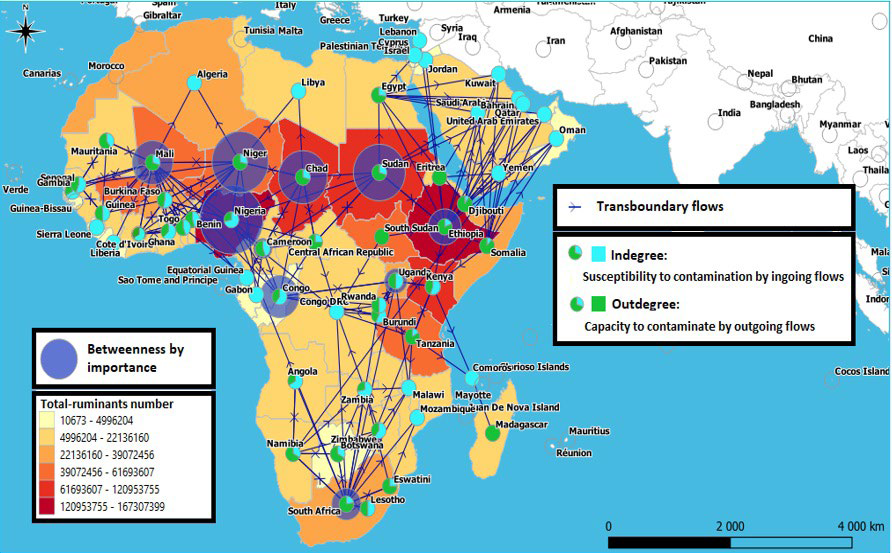
Geographically, it seems that the northern Sahelian countries from Mauritania to Sudan have a greater number of outgoing links than incoming ones, compared to their southern coastal neighbors whose number of incoming links is greater than outgoing ones. This observation also concerns the countries of the African Horn (Ethiopia, Djibouti, Somalia) in addition to Egypt and Sudan in their relations with the countries of West Asia which import livestock from the latters, but also the countries of the South African region in their relations with the countries of East Africa which they supply (Figure 7).
The nodes diffusion capacity and their susceptibility to infection:
Countries with significant outbound links are those with the highest “diffusion capacity”, since they can play a central role in the dissemination of diseases to the countries with which they are in contact. Such nodes are commonly called “Super spreaders”. We find Mali (outdegree: 16), South Africa (outdegree: 14), Ethiopia (outdegree: 13), Niger (outdegree: 12), Djibouti (outdegree: 9), Egypt (outdegree: 8), Somalia (outdegree: 8), followed by Burkina Fasso (outdegree: 7), Sudan (outdegree: 7) and Chad (outdegree: 7) constituting the most attractive origins (Figure 8A).
Figure 8. Activity Centrality Parameters in Function of Livestock Numbers per Country. A: Contaminating Power or “outdegree”, B: Susceptibility to Contamination or «indegree»
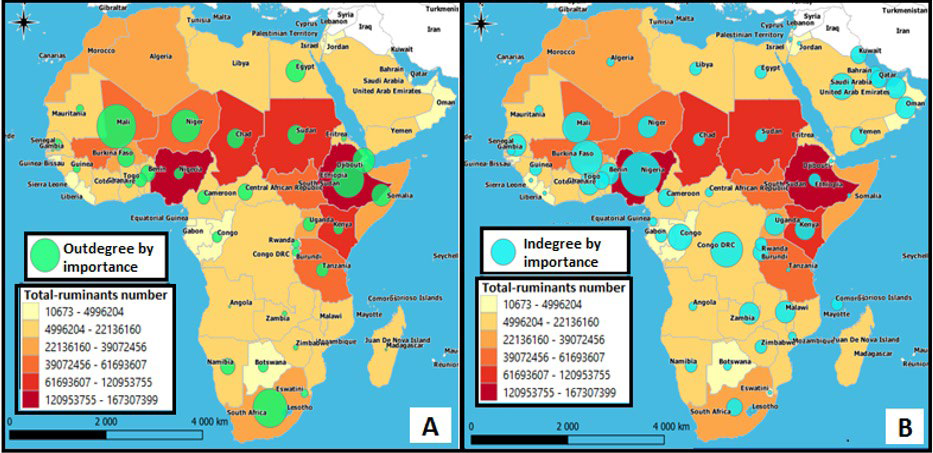
Countries with significant inbound links are those that show the highest “contamination susceptibility”, since they can become contaminated from all the countries with which they are in contact. In order of importance, we find Nigeria (indegree=10), followed by Burkina Faso (indegree=8), the DRC (indegree=8), Mali (indegree=7), Congo (indegree=6) and from Saudi Arabia (indegree=6) constituting the 6 most popular destinations for ruminants (Figure 8B).
• Network type:
The distribution of the “indegree” and “outdegree” centrality parameters is used to characterize networks and understand how connectivity is distributed within the structure. The value of the heterogeneity coefficient Kappa (Table 2) shows that it’s a heterogeneous network. This results by the fact that many nodes are weakly connected, while few concentrate a high number of connections alone.
“Betweenness” centrality:
This measurement takes into account the most central and essential countries that livestock must cross before reaching others. Consequently, these countries play a coordination and control role. The highest “betweenness” is the Nigeria one, which is the most central crossroads on the continent and which animals from different countries must cross before being able to access others, while Niger occupies the place of second essential continent crossroad, it is followed, in decreasing order of importance, by Sudan, Chad and Mali, then by Congo, Ethiopia, South Africa, Uganda, Cameroon and Kenya (Table 3 and Figures 7 and 9). We thus find one or more essential crossroads in the different regions of Africa which will promote the spread of diseases, but which will also have the capacity to control the animals movement.
| Table 3. Ranking of the Top 25 Countries According to their “Indegree”, “Outdegree”, “Betweenness” and “Eigenvector” |
|
Indegree
|
Outdegree |
Betweenness |
Eigenvector
|
| Nigeria: 10 |
Mali: 16
|
Nigeria: 516,95 |
Mali: 1
|
| Burkina Faso: 8 |
South Africa: 14
|
Niger: 461,17 |
Burkina Faso: 0,95
|
| Congo DRC: 8 |
Ethiopia: 13
|
Sudan: 425,73 |
Niger: 0,90
|
| Mali: 7 |
Niger: 12
|
Chad: 399,89 |
Benin: 0,72
|
| Congo: 6 |
Djibouti: 9
|
Mali: 331,95 |
Nigeria: 0,68
|
| Cote d’Ivoire: 6 |
Egypt: 8
|
Congo: 316,44 |
Cote Ivoire: 0,65
|
| Saudi Arabia: 6 |
Somalia: 8
|
Ethiopia: 270,16 |
Togo: 0,62
|
| Niger: 5 |
Burkina Faso: 7
|
South Africa: 239,00 |
Ghana: 0,58
|
| Benin: 5 |
Chad: 7
|
Uganda: 183,69 |
Senegal: 0,40
|
| Uganda: 5 |
Sudan: 7
|
Cameroon: 152,95 |
Guinea: 0,36
|
| Kenya: 5 |
Benin: 6
|
Kenya: 128,87 |
Chad: 0,36
|
| Senegal: 5 |
Namibia: 6
|
Burkina Faso: 126,21 |
Mauritania: 0,28
|
| Ghana: 5 |
C.A.R (*): 6
|
Egypt: 79,40 |
Cameroon: 0,27
|
| Zambia: 5 |
Uganda: 4
|
Senegal: 68,50 |
Congo: 0,26
|
| Malawi: 5 |
Cameroon: 4
|
Namibia: 56,50 |
C.A.R (*): 0,21
|
| Oman: 5 |
Togo: 4
|
Burundi: 56,50 |
Sudan: 0,17
|
| United Arab Emirates: 5 |
Tanzania: 5
|
Benin: 24,10 |
Algeria: 0,17
|
| South Africa: 4 |
Nigeria: 4
|
Ghana: 13,53 |
Gabon: 0,17
|
| Cameroon: 4 |
Congo: 4
|
Togo: 12,86 |
Gambia: 0,16
|
| Togo: 4 |
Kenya: 4
|
Cote Ivoire: 11,61 |
Congo DRC: 0, 14
|
| Burundi: 4 |
Senegal: 4
|
C.A.R (*): 8,41 |
South Africa: 0,12
|
| Bahrain: 4 |
Botswana: 4
|
Tanzania: 8,25 |
Libya: 0,12
|
| Kuwait: 4 |
Cote d’Ivoire: 3
|
Zambia: 4,5 |
Uganda: 0,10
|
| Qatar: 4 |
Ghana: 3
|
Rwanda: 4,33 |
Liberia: 0,09
|
| Yemen: 4 |
Burundi: 3
|
Guinea: 1,5 |
Sierra Leone: 0,09
|
| (*) C.A.R: Central African Republic |
Proximity centrality or “closeness”:
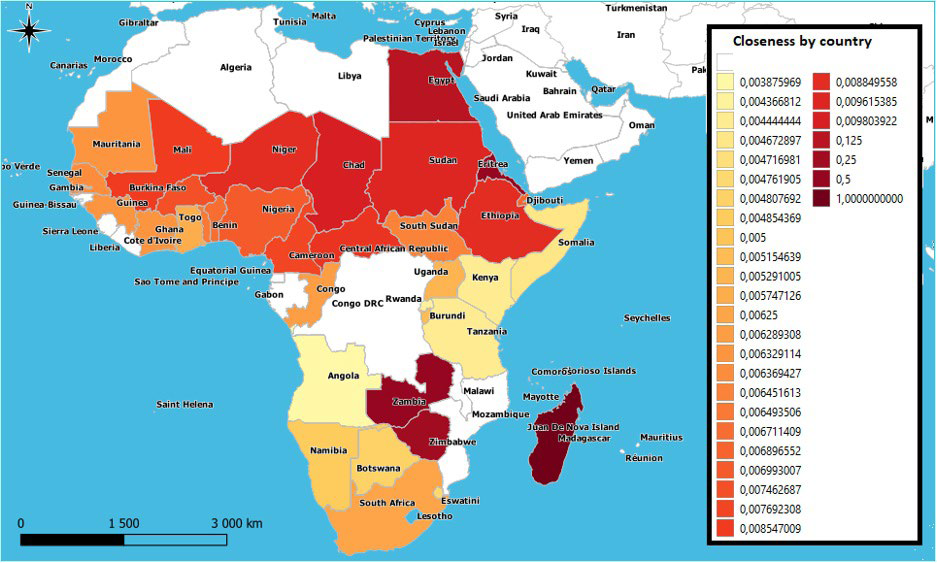
Countries with high closeness centrality are the closest (their average distance is the shortest) to other countries on the continent in terms of the number of paths connecting them. In Africa, it turns out that epizootics spread most quickly from East to West, while observing that Chad (Closeness=0.0098) has a slightly more pronounced power of diffusion than Sudan (Closeness=0.0096). Epizootics continue to spread at a slower speed from North to South. It is also observed that the South African region would allow the rise of pathogens from South Africa to Angola in the event of infectious pressure, while Zambia, Zimbabwe and Madagascar can play the role of the first spreaders of the disease when they are contaminated. As for certain countries in North Africa (Morocco, Algeria, Tunisia and Libya) or in West Asia which are geographically located at the ends of the network, their broadcasting power is almost zero as long as they are mainly destinations of the movements (except when irregular flows take place, particularly informal ones allowing them to communicate with each other) (Figure 10).
Figure 10. Closeness» Indicator Map for African Countries
Spectral centrality or “eigenvector centrality”:
In Africa, it appears that West African countries are the most susceptible to contamination since their contacts are very linked. Indeed, table III shows that Mali (Eigenvector=1) is undoubtedly the country which has the most relations with countries on the continent that themselves have a significant number of relations with other African countries, followed by Burkina Fasso (0.95) and Niger (0.90), then Benin (0.72), Nigeria (0.68), the Ivory Coast (0.65), Togo (0.62), Ghana (0.58), Senegal (0.40), Guinea (0.36), Chad (0.36) and Mauritania (0.28). Susceptibility to contamination then progresses towards the East, the South then the North. Countries showing lower values are those in West Asia and East Africa. At the Maghreb level, Mauritania has the highest “Eigenvector” coefficient, it is 6.57 times higher than Egypt, 2.43 times higher than Libya and 1.66 times higher than Algeria, due to its relations with Mali, Senegal and Guinea which respectively have the 1st, 8th and 9th Eigenvector coefficient of the network, while Algeria has a coefficient of Eigenvector higher 1.46 times than Libya and 3.94 times than Egypt, due to its relations with Mali and Niger which themselves have an Eigenvector coefficient counting among the three most important in the network. This may explain why some North African countries are more susceptible to the introduction of epidemics from West Africa than others. Finally, Morocco and Tunisia have a zero Eigenvector coefficient which protects them from contamination from West Africa, as long as irregular or informal flows do not take place.
d. Cliques and structures detection within the network:
An interconnected K3 clique is a subgroup of 3 countries that are cohesive with each other through bidirectional links so that each country can communicate with the other. Following the introduction of pathogens, this type of structure provides information on the speed of their dissemination and their circulation in a bidirectional loop between the countries constituting the triplet. Eleven interconnected triplets were identified at the network level, 9 are located in West Africa, only one in the South African region and a last one between East Africa and Central Africa. West Africa includes the following interconnected triplets: “Mali- MauritaniaSenegal”, “Mali- Senegal- Guinea”, “Mali- Ivory Coast- Burkina Faso”, “Mali- Burkina Faso- Niger”, “Mali- Burkina Faso- Togo”, “Burkina Faso-Ivory Coast- Ghana”, “Burkina Faso- Togo- Benin”, “Burkina Faso- Benin- Niger” and “Burkina Faso- NigeriaNiger”. The South African region is distinguished by the triplet “South Africa- Namibia- Botswana”, while East Africa and Central Africa have the “Burundi- Congo- Uganda” triplet in common. It should be noted that Mali, Burkina Faso and Niger are at the center of several triplets. Five are centered on Mali, seven on Burkina Faso, three on Niger and finally one on Nigeria (Figure 9).
Figure 9. Representation of Interconnected Cliques, Betweenness Centrality, Cohesive Country Communities, Cutpoints and their Links to Communities
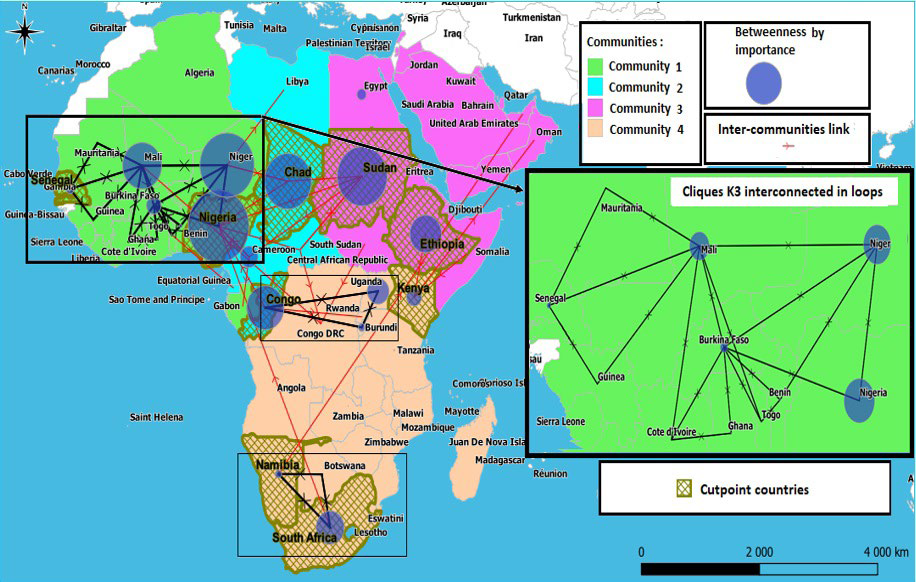
e. Community detection: The community’s detection within a network can be approached by different measures, including: the links centrality measurement “Edge-betweenness”47 and the “fast greedy cluster” algorithm.48 The division of the network into communities was studied by these two algorithms. The “fast greedy cluster” algorithm having provided a better “Q” modularity (Qcfg=0.55 above 0.3) than the “Edge-betweenness” algorithm (Qeb=0.18 below 0.3) (Table 2), its results have been reported in Figure 9.
This method allowed to detect four distinct communities. The resulting division traced the different regions of Africa into new communities united through movement and informs us about the crossroads and pathways ensuring communication between them. Thus, it appears that West Africa is a community with great cohesion between its countries in addition to Algeria and Congo, while the northern half of Central Africa is much more united with Libya, whereas the countries of the African Horn in addition to Sudan, South Sudan and Egypt form the same community with the countries of West Asia, and finally, the last community brings together the countries of the South African region, those of the southern half of Central African region and those of East Africa located in the south of the African Horn. Communication between these communities is ensured through outgoing and/or incoming links at their various mobility hubs, the main ones are Nigeria, Niger, Chad, Cameroon, Congo, Sudan, Ethiopia, South Africa, Uganda and Kenya (Figure 9).
f. «Cutpoints»: The articulation points or “cutpoints” are points when removed from the network allows it to be fragmented in a precise way, leading to the suppression of the movements at the origin of the spread of epidemics between its different parts. Nine nodes were detected for Africa: Senegal, Nigeria, Chad, Sudan, Ethiopia, Kenya, Congo, Namibia and South Africa (Figure 9), these nodes play a key role for diffusion between communities. They can be considered as indicators of a high-risk of transmission of the pathogen which should be neutralized depending on the situations and regions.
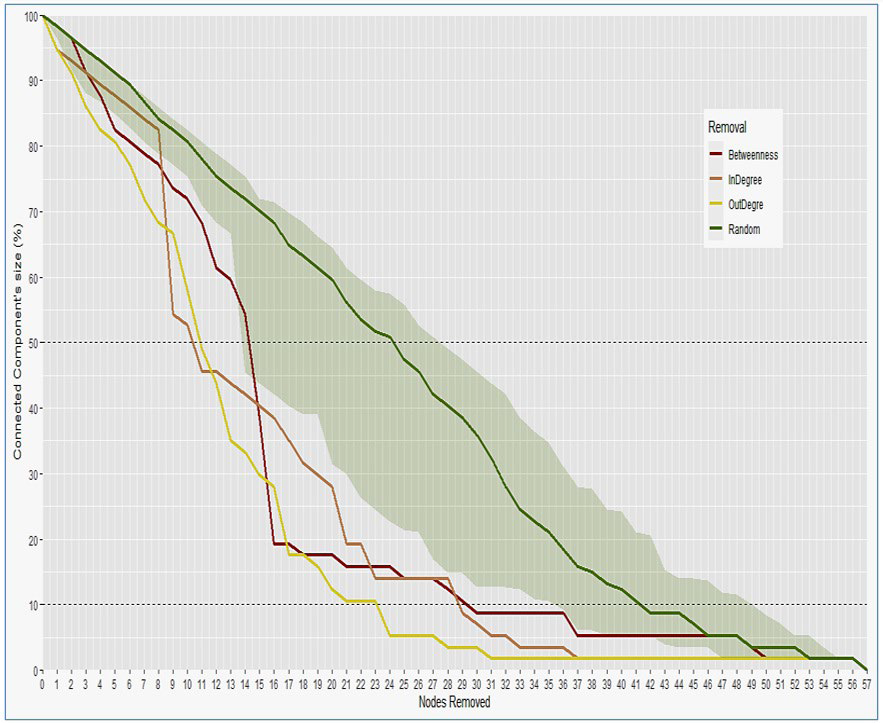
g. Robustness of the network against attacks on central nodes or resilience:
When we need to fragment the network as a whole, Figure 11 compares the effect of the optimal neutralizing action which acts on its nodes. Thus, removing nodes by decreasing importance of their centrality allows it to be fragmented more quickly than if the nodes were taken randomly. Indeed, it turns out that acting on the nodes with the most “outdegree” outgoing links allows it to be fragmented more quickly. This action allows the network to lose 10% of its components from the removal of the 3rd node (action on Mali, South Africa and Ethiopia) and 32% of its components from the 9th node (Action on Niger, Djibouti, Egypt, Somalia, Burkina Faso and Chad). Then, the action on the “indegree” incoming links makes it possible to amputate 50% of its components from the 11th node (Kenya and Senegal) compared to the “outdegree” outgoing links which allows this from the 12th node. Then it’s again the action on its outgoing links which quickly allows its fragmentation. Action on nodes with high betweenness centrality is only optimal between the 15th and 17th nodes (Namibia, Burundi and Benin) to contribute to causing the network to lose 81% of its components. In the end, it is the action on the 21 countries with the most outgoing links (Table 3 and Figure 11) which makes it possible to amputate 90% of its components the most quickly.
Figure 11. Network Behavior Face to Suppressive Action on its Nodes (countries)
DISCUSSION
The cross-border mobility network of domestic ruminants in Africa presents a heterogeneous structure for which few nodes are connected to many others and strongly influence their movements. Its density appears low (0.060) but remains relatively high compared to the values found in the literature, whose spatial extent limited to a single country did not allow comparison.31,34,50 The average distance of the network (3.64) and its diameter (d=9) suggest that diseases have a shorter distance to travel and spread to other distant countries. Reciprocity shows that contamination can only happen 40.6% of times in both directions due to the unavailability of reverse paths throughout the network, while in 37.4% of cases, when a country is linked to two others, the latter two are also linked to each other. Thus, by considering the heterogeneous structure, the low but relatively high density for this type of network, the relatively short average distance, the small diameter and the non-negligible reciprocity of contamination, a proven ease of diseases spread can be predicted. However, as these values express an overall average, it is expected that certain regions or zones may be more at risk than others.
The African mobility network is made up of two independent “strong components”. The first brings together 25 countries which extend over three regions of Africa starting from the Atlantic coast to the Indian Ocean coasts, while the second brings together the 5 countries of the South African region in addition to Angola (Figure 6). Each of these zones represents a basic space for diffusion and maintenance of pathogens due to the existing cohesion between its countries, before they can spread to other countries or regions of Africa through animal’s movements. The first “strong component” makes it possible to explain the reason for the maintenance of enzootics of contagious diseases such as FMD, CBPP and PPR in this area, while the second makes it possible to explain why countries from the South African region share their own circulating FMD serotypes and most often escape from the epizootics spread (Figures 1A, 1B, 1C, 2 and 3).
Very heterogeneous networks can show an early occurence of diseases with subsequent virulent spread, but for a relatively short duration compared to other types of networks.38 It’s thus noticed that a limited number of countries control strongly the distribution of the movement in terms of outgoing links, including Mali (16), South Africa (14), Ethiopia (13), Niger (12), Djibouti (9), Egypt (8) and Somalia (8), while other countries control strongly its reception through ingoing links such as Nigeria (10), Burkina Faso (8), Democratic Republic of the Congo (DRC) (8), Mali (7), Congo (6) and Saudi Arabia (6). Countries with high ingoing links are the most sensitive to contamination, while countries with high outgoing links are those with the highest disease diffusion capacities and are qualified as “super spreaders”, as the case of Niger which allows the spread of diseases to different countries including Benin.51 In this regard, the role of the countries of the north of the Sahel in supplying the coastal countries of the South8 is clearly highlighted through the “indegree” and “outdegree”. Indeed, most countries with high outbound links are in this northern zone. Conversely, the majority of countries with high inbound links are located in coastal areas, which exposes them to the spread of diseases from the North Sahel countries. In an extreme situation, we find Nigeria which has a high “indegree” and an exceptionally low “outdegree” value, which makes it very vulnerable to contamination by diseases from the different countries that supply its cross-border flows. We also note that the north Sahel countries from Mauritania to Chad in continuity with Sudan, Ethiopia, Somalia and Djibouti are mainly exporting countries and/or whose livestock joins other countries for transhumance referring to their “outdegree” greater than their “indegree” (Figure 7).
Compared to national livestock numbers, it appears that it’s not necessarily the countries with the largest numbers of ruminants that are the most active nodes on the continent. Indeed, with the exception of Ethiopia (167.3 million head), countries like Mali (61.6 million head), Niger (50.4 million head), South Africa (39.07 million head), Djibouti (1.3 million head) emerged as the largest “Super spreaders” in the network, have significantly smaller numbers of ruminants than countries like Nigeria (152.4 million head), Chad (120.9 million head) and Sudan (109.8 million head).25
The “closeness” centrality map of proximity superimposed on the extent of the first strong component provides information on the epizootics diffusion direction in Africa, which occurs most quickly from East to West of this component and a slightly late towards its southern parts (Figure 10). The progression from East to West was notably reported by Salami who reconstructed the geographical movements of PPR viruses and who noted the East-West movement of lineage II between African borders,18 but it was also observed during the rinderpest epizootic which affected Africa in 1888,52 for which North-South progression was also reported.53 The cohesive communities identified, retraced the different regions of Africa into four communities very linked by the movement, they are represented from East to West, by the African Horn countries, Sudan, South Sudan and Egypt which forms the same community with the Arabian Peninsula countries, while the northern half of Central Africa forms another community with Libya, whereas a third community includes the countries of West Africa, Algeria and the Congo, and finally a last community brings together the countries of the South African region, those of the southern half of Central Africa and those of East Africa located south of the African Horn (Figure 9). Communication between these communities is ensured through links passing across transit countries. The main ones are Nigeria, Niger, Chad, Congo, Sudan, Ethiopia, South Africa, but also the Center African Republic which communicates with all these communities. The last country appears to be a pivotal node for the reception and redistribution of movements and pathogens between communities, which is consistent with the findings of various authors in animal mobility who qualify the Central African Republic as a land of transit.6,7,8
The search for cliques connected in the bidirectional direction made it possible to identify eleven of these structures at the continental level, nine of which are grouped in West Africa, one located in the South African region, and finally, a last one located between East and Central Africa (Figure 9). Their high number in the West African region makes it vulnerable to the spread and maintenance of pathogens, particularly through their looping circulation in both directions and their establishment. This vulnerability is all the more accentuated by the fact that the summits of these structures are centered on the sources of introduction which are among the most active nodes in the network, that are Mali, Niger, Nigeria and Burkina Faso, for which several centrality parameters were considered the highest (they are connected to a very large number of countries (in and outdegree), they are essential crossroads for livestock passage from the center and the East (Betweeness), they are connected to countries which are themselves connected to numerous countries (Eigenvector) and finally, they are among the first countries to capture pathogens in the network and to redistribute them (Closeness)) and which are therefore countries at proven risk of introducing pathogens to these triplets.
The combination of mapping and network analysis method made it possible to carry out an in-depth analysis of the cross-border exchange ruminants circuit in Africa. Certain groups of countries which are very connected to each other predict a significant pathogens diffusion when the network is subject to infectious circulation. Due to this connectivity, but also to the multitude of irregular links between countries which can be established from one year to the next, several diseases have made incursions into territories other than the initial area of appearance. Indeed, the examples below illustrate this observation:
Séry and al54 reported that the reintroduction of contagious bovine pleuropneumonia (CBPP) in 2012 in Gambia and Senegal after a disappearance of 27-years (1978 to 2005), was probably linked to the introduction of cattle from the neighbor’s countries, mainly Mali. This is perfectly explained by the corresponding cliques found, whose summit starts from Mali to reach Senegal directly, or pass through Mauritania or Guinea before reaching it, but also by the exceptionally highest centrality parameters of the Mali which allow it to capture pathogens through the movement coming from various origins (mainly from the East through Niger, or through Nigeria via Burkina Faso or Ghana) and to redistribute them (Figure 9). Thus, for this disease whose highest occurrences are recorded in the Central Africa countries, it appears that the majority of West African countries nearby and extending as far as Mali, Burkina Faso and Ivory Coast are also regularly affected (Figure 1B). This constitutes an introduction risk for Senegal and Gambia, especially since the significant transhumant and commercial flows from Mali to Senegal make this receiving country particularly at high-risk.11,19
Foot-and-mouth Disease
Apolloni and al55 report that in 1999, the outbreaks declared in Algeria, Morocco and Tunisia were caused by strains closely related to those isolated in sub-Saharan countries such as Guinea, Ivory Coast and Ghana. The investigation carried out during the Algerian epizootic revealed the presence of animals imported from Mali and Mauritania at the origin of the disease introduction into the Maghreb. Indeed, these movements can be explained on the one hand by the cliques present in this region which allow pathogens to circulate between these countries (Ivory Coast, Guinea, Ghana, Mauritania) and Mali (Figure 9) and by the exceptionally high centrality parameters of Mali on the other hand. These movements can also be explained by the very high “Eigenvector” coefficients present in this area which are the highest in Africa, such as Mali (1), Burkina Faso (0.94), Niger (0.90), Ivory Coast (0.65), Ghana (0.57), Senegal (0.48), Guinea (0.41) and Mauritania (0. 28), but also Algeria (0.16) for which this coefficient remains higher than other North African countries. This is one of the reasons why some countries in this region are more susceptible to the introduction of epizootic agents than others. These high coefficients which attest the importance of the neighbor’s centrality make the nodes susceptible to contamination from these neighbors highly exposed to risk. Thus, the connection of Algeria and Mauritania with Mali gives them a remarkably high “Eigenvector” coefficient compared to their neighbors in North Africa, which exposes them to a great risk of contamination and at a proven risk of spreading diseases to the countries they can serve.
Concerning the distribution of the disease serotypes, the absence of serotypes A and O in South African countries can fully support our results concerning the independence of their incoming movements circuit from other countries on the continent, while the presence of serotypes A, O, Southern African Territory (SAT) 1, 2 and 3 in East African countries proves that movement flows are most often from South African countries to East African ones, except for possible exceptions allowing the implementation of reverse paths via irregular flows, while the absence of the SAT3 serotype in West African countries suggests a limited articulation of the latter’s movement circuit with those of East and South Africa, which in fact only occurs through Nigeria for flows from South Africa or the DRC when irregular flows do not occur (Figure 9). Finally, the presence of the ASIA1 serotype in certain countries of North Africa such as Egypt and Sudan, attests to the close relationship of exchange between these countries and the Asian countries.
Peste des Petits Ruminants
For the PPR whose extension in 2008 overlaps with the extent of the first strong component found, the introduction of lineage II in the western half of West Africa from 2008 and its extension to its different countries in 2013 (Figure 2C and 2D), can be explained by the presence of interconnected loop cliques which would have allowed this lineage to circulate between countries and to establish itself. This introduction was most likely made via Mali from the East through Niger and Nigeria, both present in the geographical area of lineage II and being part of the triplets (Figures 2C and 9). Indeed, the cluster fast greedy (CFG) Algorithm allowed to highlight these two countries as the main articulation points allowing flows to access West Africa from other regions of Africa. Figure 3 allows to note the almost disappearance of lineage I from West Africa in favor of lineage II as observed by Dundon et al30 and by Salami.18 This author, who worked on the reconstruction of the geographical movements of PPR viruses in Senegal, confirms in this regard that in West Africa, the trans-African movements at the origin of the East-West lineage II movement find their origin in the livestock trade at the cross-border.18 In addition, Niger’s position as the second most essential crossroads on the continent means that it was able to host lineages I, II and IV (Figure 3) due to the relationships maintained with its neighbors, in particular, Chad, Nigeria and Mali for lineages II, IV and I respectively (Figures 3 and 7).
The introduction of lineage IV in Egypt is explained by the ruminant’s flows coming from Sudan to supply this country, while its extension towards the Central African Republic, Cameroon and Nigeria is due to the strong relations that Sudan maintains with these three countries as immediate neighbors (only 1 movement of distance), but also those that the Central African Republic maintains with Cameroon and Nigeria (Figure 7). It’s the same for the introduction of this lineage in Ethiopia which receives cattle from Sudan, while in Angola, the introduction of lineage IV more likely took place from irregular flows which link it to the Central African Republic, the DRC and Uganda where this lineage does exist and which are the only possible flows to this country, while the diversity of lineages found in the DRC (lineages II, III and IV) can be easily explained by its incoming flows from the Central African Republic (lineage IV), Tanzania (lineage III) and by its neighborhood with the Congo (lineage II) whose outgoing flows cross it towards Rwanda, Burundi and Uganda. The latter in turn, most likely having received lineage IV through the flows passing across the DRC before serving it. Finally, given the diffusion profile of lineage IV of PPR in Africa, we can say that it was more probably introduced from West Asia via irregular flows towards Sudan, whose outgoing flows were responsible for disseminating it throughout the continent (except Morocco for which the Asian-North African informal paths are more plausible if considering under-reporting in Africa), which is very probable knowing that the latter constitutes a united community with this region of Asia and that it was the first to host this lineage in Africa29 (Figures 2C and 9).
Rift Valley Fever
Typical disease of the East African rift, rift valley fever (RVF) manages to spread in the direction of the North and the South (Figure 1D) towards the two strong components of the network. Indeed, despite the relative independence of these components, the multitude of irregular flows highlighted (Figure 4), made it possible to confirm the establishment possibility of movements going back from the countries of East Africa (Kenya, Uganda, Ethiopia, Somalia) to North African countries such as Sudan and Egypt. The latter as well as the previous ones in addition to Tanzania, ensure the transmission of ruminants flows towards the West Asian countries including Saudi Arabia and Yemen, which explains the historical epizootics of RVF described by Bird in all these countries.56The irregular flows found in this study also made it possible to identify several entry routes to the South African region countries, mainly towards South Africa, then secondarily towards Botswana, coming from the countries of East Africa such as Mozambique, Malawi, Zambia, Zimbabwe, Tanzania, Uganda and Burundi, all known for their regular (Figure 1D) or historical56 occurrences of the disease. The Satellite map in the legend of figure 1D illustrates the extent of the Great African Rift corridor which begins to tighten from South-West Ethiopia passing through Kenya, widening over Tanzania, and narrowing at the level of Mozambique, and Malawi, to the limits of South Africa. Another corridor of the Great Rift passes through Uganda, Rwanda and Burundi. According to the mapping, it’s the countries located along these choke corridors which express the greatest occurrence of the disease in the region in addition to Madagascar which is linked to them by the movement.
RVF has also a maximum occurrence in Mauritania, followed by Senegal (Figure 1D), while historically it appeared in Kenya in 1930 and has circulated between the countries of East and South Africa since the 1950s, generating sporadic epizootics in certain countries of North Africa (Sudan and Egypt) and West Asia (Saudi Arabia and Yemen) as reported by Bird.56 The first epizootic in Mauritania only took place in 1987,56 but since then, the FVR shows the maximum occurrences of the continent, notably from 2005 to 2021. The low to nul occurrence in the countries geographically separating Mauritania from the countries located in the Great Rift Valley, suggests that for years the RVF has found a new area of establishment bringing together the ideal conditions to be able to settle there, develop and emerge more or less regularly depending on precipitation and river levels, to contaminate certain neighboring countries such as Mali, Guinea or Senegal (where the qualification as a new settlement area cannot be ruled out either given the occurrences that it has expressed since the first epizootic in 1987 (Figure 1D)).
Indeed, the phylogenetic analysis of the strain which affected Mauritania in 2010 shows that it is close to the one previously isolated in this country during the 1987 epizootic, to those isolated in Zimbabwe in 1974, in Uganda in 1944 and in South Africa in 1951 and 2009.50 This genetic proximity provide information on the origin of the introduction of the disease into Mauritania which would have only been made from the countries of the Great Rift in 1987 through animal mobility and which very probably persisted. As for the presence of the South African strain from 2009, it suggests a reintroduction of the virus either directly by Senegal, or indirectly by Ghana or Nigeria through the triplets, knowing that these three countries imported ruminants from South Africa since 2008.24 Aedes, the mosquito vectors of the disease, are capable of trans-ovarian transmission, which allows the virus to persist in environment for a long time. The eggs can survive several years in drought conditions and during the rainy season or when river levels rise, they hatch. Mosquitoes multiply and transmit the disease to animals.57 Indeed, Bezaid emphasizes that the various epidemics that occurred in Mauritania between 2010 and 2015 show that the virus is probably capable of remaining in the environment during inter-epidemic periods.50
Sheep and Goat Pox
Unless under-reporting, an invasive distribution towards the North African countries can be observed (Figure 1C). For these countries which are located at the borders of the network and which should have been the least affected, the study of 24 isolates collected in different regions of Morocco between 1981 and 2010 during different epizootics, show that all the isolates formed the same cluster with strains isolated from neighboring countries such as Algeria and Tunisia, but also with strains isolated in Asian countries such as India, China, Russia, Iraq and Saudi Arabia,58 thus showing that the strains circulating in North Africa most likely have an Asian origin. The same goes for lineage IV of PPR which originated in Asia and affected the North African countries,29,30 or the case of the “O/India 2001” strain of FMD originating from India and affected these same countries between 2013 and 2015, or the “A/Iran-05” strain originating from Iran which made incursions into North Africa (Egypt, Libya). This attest to the existence of a distinct mobility route, coming from Asia and which can interest the countries of North Africa from East to West when the porosity of the borders allows it. This is also consistent with the results of our work which show the existence of irregular routes that can connect Asia to certain African countries (Figure 4), such as the case of the Arabian Peninsula, usually supplied from Asia (India, Iran, etc.) and Africa (Figures 4 and 5) but which also delivers the latter occasionally, notably North Africa, thus allowing pathogens coming from other Asian countries such as India and Iran to make incursions.
Rinderpest
The spread of rinderpest in Africa seems to follow the same mobility pathways found through this study. Indeed, the presence of the disease in Egypt decades before its spread in Africa,59 proves the absence of commercial links from this country to other African countries, except for sporadic exceptions (Figures 4 and 5). Similarly, after its appearance in Ethiopia following the introduction by the Italian army of three Indian cattle infected in 1888,60 the disease spread across West Africa between 1890 and 1892 when it took on catastrophic proportions,52 it spread across the Sahel to the Atlantic Ocean countries59 then began to progress towards the South in direction of the Great Rift countries between 1890 and 1893 to Zambia.53 Which is perfectly in agreement with the values of the “Closeness” indicator which attests to the East-West and North-South progressions of livestock movements and therefore of pathogens (Figure 10). It was only in 1896 that the disease reached the countries of southern Africa,53,60 thus confirming on the one hand the relative independence of their mobility circuit, and on the other hand the possibility of establishing non-permanent mobility routes allowing pathogens to spread occasionally, as found by the map of irregular flows (Figure 4).
During this first African rinderpest panzootic, precise traceability elements relating the details of its spread to different countries were not well-formalized, given that the World Organization for Animal Health was created in 1924. However, regarding the panzootics that followed, the role of Chad in the contamination of Niger has been well-established.51 Similarly, Chad and Central African Republic have emerged as pivotal nodes of infection transmission between East and West (Figure 9), and are the main countries making up the sanitary cord “cordon sanitaire” established in 2000 as part of the (Programme Pan-Africain de Contrôle des Epizooties (PACE) as a buffer zone to protect West and Central Africa from possible re-infection by rinderpest from residual outbreaks in East Africa.59 Niger, which is the second biggest crossroads on the African continent and the compulsory pass point (Figure 9), is responsible for transmitting infection from the East to the West, which has led to the contamination of countries such as Benin.51 As for Nigeria, which experienced catastrophic losses due to the disease, that have been estimated at between 80 and 90% of its livestock.52 This can be explained by the fact that it’s a very popular destination, supplied by 10 countries and given the very high values of its incoming links (Figures 7 and 8). Indeed, as Africa’s most populated country, Nigeria represents a major consumption center, to which livestock flows from various countries are directed. Moreover, its position as holder of the second largest ruminant herd on the continent with about 152.4 million head,25 exposes it to the spread of contagious diseases, given the high animal density on its territory.
There are 9 “cutpoints” or countries where action should be taken to stop the spread of epizootics in Africa (Figure 9). These countries are of particular importance in breaking the transmission cycle between different regions or communities in the continent. Selective action can be taken in these countries, either through movement control or mass vaccination, or both. These countries can also be used for targeted surveillance. Indeed, a study by Salathe and Jones in 2010, which focused on networks with several communities, showed that in such networks, intervention strategies targeting individuals bridging several communities are more effective than those focusing only on the most strongly connected individuals.61 This suggests that vaccination efforts should be concentrated at these levels. In contrast, Pastor-Satorras and Vespignani62 have confirmed that targeted vaccination of the most connected nodes (“indegree” and “outdegree” in our case) considerably reduces the vulnerability of a heterogeneous network to epidemics, compared with random vaccination of nodes. The same observation is also made by Dezsho and Barabasi.63 Which is in accordance with our results, for which simplified action targetting the 21 countries with the most outgoing links amputates quickly 90% of the network’s components. Consequently, the identification of “cutpoints” indicates the 9 countries on which strategic action should be taken to neutralize the passage of pathogens between communities (Figure 9), while the resilience study indicates that vaccination campaigns targeting the outbound movements of just 21 African countries can greatly reduce and control the extent of the spread of diseases affecting the entire continent (Table 3 and Figure 11).
RELEVANCE AND LIMITATIONS OF THE STUDY
The study highlighted the exchange routes that determine the cross-border mobility of domestic ruminants in Africa. It has also enabled us to understand the pathogens pathways used to circulate and to reach new areas, and to identify the countries where action is needed to stop the spread of epizootics. Nevertheless, the study has several limitations:
• Lack of data accuracy on the identification of the ruminant species making up certain flows.
• Lack of quantitative data on livestock flows, which could have enabled a better assessment of the weighted movements risk.
• The study could also be limited by certain ruminant movements undeclared to customs or not found in the bibliography, as well as by any addition or deletion of trade relations between countries.
CONCLUSION
We might think that the intensification of transhumance and commercial livestock movements in Africa since the 1970s, following population growth in the Sahel1 and the droughts that hit the continent in 1973 and 1984,4 have favored the establishment of relatively intensive cross-border network exchanges that favor the spread and persistence of diseases. This is well-illustrated by the rapid spread of PPR across the continent from the 1970s onwards (Figure 2). However, it’s clear from the history of the first spread of rinderpest in Africa, based on the profile of its spread from east to west and southwards, and also on the late contamination of southern African countries, but also the catastrophic scale taken by the disease in West Africa52 (effect of cliques in the introduction, circulation, and implantation), that this exchange network could have existed well before this time.
Contagious diseases tend to spread earliest over a band of 25 countries extending from the African Horn countries in the East to the West African countries. The latter contains the continent’s densest circulation network, enabling pathogens to circulate between these countries and establish themselves (interconnected cliques), or even gradually contaminate certain North African countries such as Algeria and Libya. These countries may be differentially contaminated, depending on the centrality of their neighbors (Mali and Niger for Algeria, Niger and Chad for Libya), which are themselves conditioned by the centrality of their relations with other countries located in other regions of the continent.
The independence of South African country’s movements circuit allows them to escape the introduction of contagious diseases, except in the case of FMD, for which this part of the continent has its own locally circulating serotypes (SAT 1, 2, and 3), or when mobility routes are temporarily open, as it was the case for rinderpest, which was able to spread from East Africa in 1896, or historically for RVF. For this latter, given the highest occurrences recorded in Mauritania, it appears that the disease has settled in this country, which could represent a new favorable biotope to the disease on the continent, thus posing a risk of spreading to neighboring countries, including those in North Africa and southern Europe.
The Arabian Peninsula is doubly supplied by Asia (Iran, India…) and Africa, enabling it to harbor pathogens from both continents and to redistribute them, notably to Africa by irregular flows.
Morocco, having traded very little with other African countries in the past and not being part of the regular circuit, appears to be safe from contaminations. However, the risk related to the possible eastern borders porosity could expose it to pathogens coming up from Africa, and to those from Asia passing through North African countries through informal flows.
The centrality of certain African countries makes them unavoidable regional gateways with a high-risk of contamination for their livestock, but also a risk of spreading diseases to the countries they serve. However, this central role can also be exploited to reinforce cross-border disease control from these same countries through targeted epidemiological surveillance or appropriate prophylaxis.
FUNDING
None.
ACKNOWLEDGEMENTS
My thanks to everyone who supported this work, including my family.
CONFLICTS OF INTEREST
The authors declare that they have no conflicts of interest.


