INTRODUCTION
Soccer requires a myriad of physiological abilities, such as aerobic capacity, linear speed, change of direction ability, and lower body power.1,2,3,4,5 Preceding investigations have investigated some of these physiological attributes, uncovering differences between elite and non-elite and starters and non-starters.6,7,8 In short, these findings suggest that elite soccer players display higher levels of physiological capacity (e.g. maximal oxygen uptake (VO2 max), linear speed), while starters possess significantly greater lower body explosiveness (e.g. mean and peak velocity and jump height). Specific to collegiate soccer, understanding the underpinning physiological components for athletic competition is an important practice of collegiate strength and conditioning coaches.9,10
However, what is less known is if these measures correlate with on-field performance, or if they are a requisite for onfield success. As such, recent investigations in men’s basketball,9,11 women’s soccer10 and across men’s and women’s collegiate athletic programs12 have begun to examine if physiological fitness relates to on-field performance. One way to determine on-field performance and success may be to investigate playing time. This is particularly important because oftentimes performance is associated with playing time.13 As such, understanding if playing time correlates with physiological testing may provide insight into training practices in order to optimize training protocols for an upcoming season.
A recent study by Dawes et al13 investigated relationships between pre-season strength and conditioning testing and in-season playing time in Division II male collegiate basketball players. In this study, Dawes et al13 found significant correlations between playing time and upper (3 repetition max bench press, r=0.71, p<0.05) and lower (3 repetition max back squat, r=0.74, p<0.05) body strength. As it pertains to soccer, a recent investigation by Lockie et al14 examined outcomes of soccer-specific tests in Division I male soccer players. Their findings indicated moderate effects between freshman and upperclass men in lower body power (vertical jump and left leg triple jump), linear speed (5, 10, and 30 meter sprint intervals) and anaerobic capacity (Yo-Yo Intermittent Recovery test) with meaningful differences exhibited in linear speed, anaerobic capacity and lower body power.14 These findings exhibit a difference between soccer-specific assessments and experience level. However, especially at the collegiate level, there has been little analysis as to whether physiological fitness testing data relates to in-season playing time, and whether there are certain characteristics that may be more important.
Therefore, the purpose of this study was to investigate the relationships between pre-season testing performance and playing time among Division II men’s soccer players. We hypothesized that significant relationships would exist between playing time and lower body power, change of direction speed, linear speed and aerobic capacity.
METHODS
Participants
Physiological performance testing data for thirteen (n=13) male (age=20±1.5-years.; height=180±6 cm; body mass=75±7 kg) National Collegiate Athletic Association (NCAA) Division II soccer players were used for this study. This data was collected by the university athletic performance staff as part of the team’s normal pre-season testing routine and was retrospectively analyzed. Due to the disparate movement demands and physiological characteristics goalkeeper data was also excluded from this analysis.7,8,14 Athletes that missed significant playing time (i.e., two or more games) and those that did not complete the pre-season testing were excluded from this analysis. Minutes played for each athlete over 16 regular season games was retrieved from the university’s athletics page.15 This study was approved by the Institutional Review Board (IRB) at the University of Colorado-Colorado Springs in accordance with the ethical standard set by the declaration of Helsinki.
Protocol
All testing was performed on an outdoor synthetic soccer field approximately three weeks prior to the first game of the season to ensure adequate physiological fitness and minimal fatigue that may occur from the season. All testing was performed across two sessions separated by 48-hours to minimize the effect of fatigue. The first testing session consisted of anthropometric measurements (height and body mass), lower-body power (vertical countermovement jump (CMJ)), change of direction speed (505-agility; modified T-test), and linear speed (30 m sprint test, with both 10 meter and 30 meter intervals measured). The second testing session, performed at the same time of day (8:00-10:00 am), measured aerobic capacity via the 20 m multi-stage fitness test (20 m multi-stage fitness test (MSFT)).
Testing Procedures
Anthropometric data: All measurements were conducted using standard procedures, with height recorded in centimeters (cm) to the nearest tenth (0.1) and body mass in kilograms (kg) to the nearest tenth (0.1) as described previously.13,16
Countermovement jump (CMJ): The CMJ was used as a measure of lower-body power and was performed on an electronic jump switch mat (Just Jump, Pro Botics Inc, Hunstville, AL, USA).9,10,17,18 Participants began in a full standing position with feet placed no wider than shoulder-width and arms at the side. Participants then performed a countermovement with the arms swinging backward, occurring in a self-selected manner. Once at the bottom of this depth and without pause, participants then followed with a maximal effort jump landing in an athletic position with both feet on the mat. The best score from the three trials was recorded to the nearest 0.1 cm.4,6,12,19 If these procedures were not adhered to, participants rested for 3-minutes and performed the jumps again. The Sayers power equation (Peak power (watts)=60.7×jump height (cm)+45.3×body mass (kg)-2055) was used to estimate total anaerobic power measured in watts (PAPw). This information was normalized for each athlete by dividing power output by total body mass to determine the power to body mass ratio (P:BM) for the CMJ.20
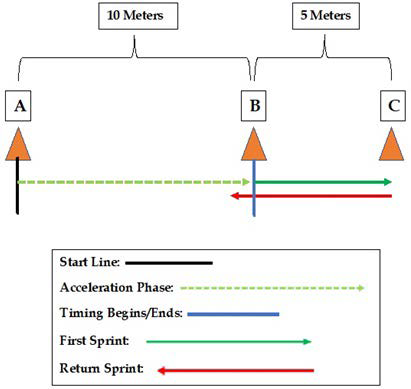
505-Agility test: The 505-agility test is displayed in (Figure 1). Participants began at cone “A” and sprinted through cone “B” to “C”. An electronic timing system (TC-System, Brower Timing Systems, Draper, UT, USA) was placed at cone B and recorded the 5 m sprint from B to C, followed by a 180° turn and C and sprinting 5m back through cone B where the timing gate was placed. Two tests were performed with a left foot turn and two with a right foot turn, with the fasted time in each direction retained for analysis.21
Figure 1. Modified T-test Procedure
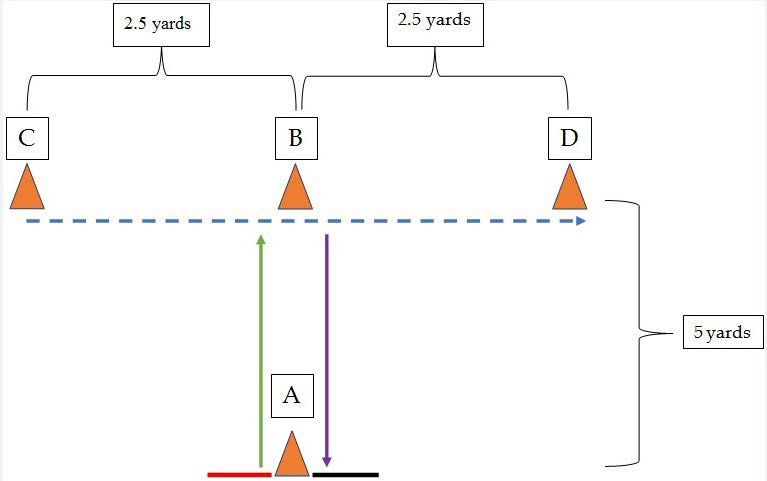
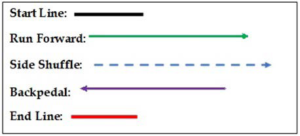
Modified T-test: The modified T-test (Figure 2) was used to determine change of direction (COD) speed. Participants began at cone A and sprinted to cone B. At cone B, without crossing the feet, the athlete then shuffled to cone D. Upon shuffling to cone D, the athlete then shuffled back to cone C, then returns to cone B. Once at cone B, the participant backpedaled past cone A. Time to completion was measured using an electronic timing system (TCSystem, Brower Timing Systems, Draper, UT, USA). Participants performed two trials with ~3-minutes rest between each trial. Each trial was measured to the 0.1 s and the best time was used for analysis.
Figure 2. Modified T-test Procedure
Linear speed: Linear speed was measured by a 30 m sprint.3 Participants began in a staggered stance with their dominant foot just behind the starting line on a weight-sensitive timing pad. Timing began upon the participant’s self-volitional start, with the foot leaving the weight-sensitive footpad at the starting line. A timing gate was placed at the 10 m mark to assess acceleration, while the second timing gate was placed at the 30 m mark to assess maximum velocity (TC-System, Brower Timing Systems, Draper, UT, USA). Participants performed three trials with ~3-minutes in between each trial. Each trial was measured to the 0.1 s and the best time was used for analysis.
Aerobic endurance: Aerobic capacity was assessed using the 20 m MSFT, which is also known as the beep test. This test has been previously described by Dawes et al.22 Specifically, two lines were marked 20 m apart. Participants began in a staggered stance with feet behind the start line. A pre-recorded auditory cue (beep) began at an initial speed of 8.5 km/h and increased by 0.5 km/h with each additional stage. This test was scored according to the final stage and shuttle the participant can achieve before being unable to run at the speed required (e.g. Stage 5.5). The test was terminated when the athlete was unable to reach the next line twice in a row in accordance with the auditory cues. Final scores by stage and shuttle were converted for the total number of shuttles completed (e.g. Stage 5.5 is 37 shuttles). The number of shuttles was then used to determine each player’s estimated maximal aerobic capacity (VO2 max).23,24
Statistical Analysis
A Pearson’s moment correlation was performed to determine the relationships between playing time and the performance tests. The level of significance was set at p<0.05 for all the statistical analyses. The strength of the correlation coefficient described as per Hopkins were an ‘r’ value between 0 to 0.30, or 0 to -0.30, was considered low; 0.31 to 0.49, or -0.31 to -0.49, moderate; 0.50 to 0.69, or -0.50 to-0.69, large; 0.70 to 0.89, -0.70 to -0.89, very large; and 0.90 to 1, or -0.90 to -1, near-perfect or predicting relationships.25 All analyses were performed using IBM statistical package for the social sciences (SPSS) statistics (Version 24.0; IBM Corporation, New York, USA).
RESULTS
Descriptive statistics, as well as the correlations with minutes played are shown in Table 1. Statistically significant, moderate relationships between playing time and 10 m (r=-0.569, p<0.05) sprint speed were discovered. No other statistically significant relationships were found between any of the remaining performance scores and playing time (Table 1).
| Table 1. Descriptive Statistics on DII Men’s Soccer Team (n=13) |
|
Minimum
|
Maximum |
Mean±SD |
Spearman’s Correlation
|
|
Minutes
|
127 |
1683 |
904.86±536.16 |
– |
| CMJ (cm) |
48.51 |
60.20 |
53.41±3.53 |
0.143
|
|
PAPw
|
3776.68 |
5072.99 |
4528.38±392.3 |
0.049 |
| P:BM |
54.40 |
66.02 |
60.31±2.96 |
-0.569*
|
|
10 m (sec)
|
1.46 |
1.66 |
1.53±0.06 |
-0.159 |
| 30 m (sec) |
3.87 |
4.33 |
4.03±0.13 |
-0.261
|
|
505 Right (sec)
|
2.02 |
2.33 |
2.21±0.08 |
-0.289 |
| 505 Left (sec) |
2.21 |
2.40 |
2.31±0.06 |
0.289
|
|
Mod. T (sec)
|
5.03 |
5.62 |
5.32±0.17 |
0.448 |
| Est. VO2 |
57.30 |
69.20 |
64.17±3.63 |
-0.094
|
| PAPw=Peak anaerobic power in watts; P:BM=Power-to-body mass ratio; *p<0.05 |
DISCUSSION
The purpose of this study was to determine if relationships existed between pre-season testing performance and playing time in a Division II men’s soccer team. The findings revealed that 10 m sprint times were significantly correlated to playing time among Division II men’s soccer players (p<0.05, r=-0.569). No other significant relationships were discovered with any of the other performance variables measured. To the best of our knowledge, this is the first time these relationships have been investigated in Division II men’s soccer. These findings suggest that coaches at the Division II level should aim to develop linear acceleration over short distances to enhance player performance as indicated by playing time across a competitive season.
The importance of linear speed to soccer players has been shown in other research. Prior research has exhibited findings that suggest differences in linear speed between starters and non-starters. Risso et al8 found that in Division I female soccer players, the starters exhibited faster 10 m and 30 m sprint times. The present findings are support those of Risso et al8 specifically that a significant relationship existed between 10 m sprint times and playing time (analogous to starter versus non-starter). Faude et al observed in professional soccer players that linear sprinting was the most frequent action observed during a ‘goal scenario’ which occurred as an offensive attack just prior to a goal being scored.26 This highlights a specific match situation where linear speed is essential for soccer players.
Prior research indicates that lower body power is essential for soccer performance, specifically, that powerful actions (e.g. jumping, sprinting, kicking)27 are required to perform movements during match play.26 Interestingly, no significant relationships between jump height, PAPw or P:BM and playing time were observed in this study, which may be due to the level of homogeneity in jump performance within this specific group. This is in contrast to the findings of Magrini et al.7 That study examined differences in physiological attributes between starters and non-starters of female collegiate soccer athletes, finding that starters exhibited significantly greater squat jump height when compared to non-starters.7
COD speed is inherent to the game of soccer, due to the multiple angles of which locomotive acceleration and decelerations occur.2,3,10 However, in the present study, COD performance as measured by the modified T-test did not appear to significantly relate to playing time. This may be due to the homogeneity within COD performance, similar to jump performance. Previous research has indicated that COD ability is relatively similar across all freshmen and non-freshmen in Division I collegiate men’s soccer team, between positions,16 and years of experience.28 As such, if COD performance is similar among players it would appear reasonable that COD tests may not correlate to playing time.
Additionally, no significant relationship was found between playing time and estimated max aerobic capacity as measured by the 20 m MSFT, which provided a measure of aerobic fitness. While the 20 m MSFT is not a direct marker of VO2 max, a study by Stolen et al suggests that changes in VO2 max may not actually improve on-field performance.5 This is not to assume no relationship exists, but at the collegiate level it may not differentiate between playing time. In the present study the participants demonstrated an “above average” estimated VO2 max (i.e., 64.84+4.25 ml/kg/min) and ranked in the 90th percentile of elite soccer players.14,29,30,31 These findings suggest that an average to above-average aerobic fitness may be a basic requisite at the Division II level; however, a ceiling effect may exist in which further increases in aerobic capacity may not yield better performances. This should be a focus in future research related to this topic.
This study was not without limitations. Due to the sample size, the relationships between positional differences, years of experience and academic classification (i.e. freshman-senior) were not analyzed. Previous studies have found that athletic performance, specifically the physical attributes of each athlete in soccer, may be influenced by positional differences, level of play (Division I vs. II vs. III), and sex.10,14,16,28,32,33,34 This study only involved DII male’s soccer players; thus, the present findings may not be generalizable to female soccer players or athletes in different divisions. Further, the focus of this study was to investigate pre-season performance testing only. It is likely that the performance variables underpinning these tests may fluctuate over the course of a season. Another consideration to understand underlying variables that attributed to playing time and soccer success should also investigate perceptual and decision-making skills to determine their impact upon playing time. While the present findings exhibit 32% of playing time explained by 10 m sprint times. Future studies should investigate additional years of data combined with playing time and injury rates in order to enhance the stability of the results found in this pilot study. This could also indicate what other factors may account for the remainder of playing time. Finally, playing time is one common denominator that can be analyzed between offensive and defensive players. It is important to understand that while playing time is not a direct measure of a player’s impact, it is logical to assume better players tend to play more and is often a question of the coaching staff. Future research should explore both the quantitative and qualitative nature of player impact, correlating those measures with training load and physiological performance.
CONCLUSION
In conclusion, linear speed over 10 m was related to playing time in Division II collegiate male soccer players. These findings extend upon prior evidence suggesting speed impacts playing time and performance in female and elite soccer players.8,26,35 For this reason, developing this attribute should be a priority within this population. Well-established techniques for improving speed and explosive strength (requisites for linear acceleration) include sprint training, Olympic lifting), and plyometrics.9,36 Practical applications for the strength and condition practitioner that understanding of the underpinning physiological characteristics that are aimed to enhance performance on the playing field, specifically linear acceleration. Additionally, considerations for integration between the performance and sport-coaching staffs show aim to develop linear acceleration in addition to the tertiary components that facilitate resiliency to these actions that occur at a high rate of force acceleration and deceleration within soccer.
CONFLICTS OF INTEREST
None of the authors have any conflicts of interest.


