INTRODUCTION
Four global trends are currently challenging healthcare delivery and related economics. These challenges also interact and compound each. Further they will extend into the foreseeable future. Taken together, quality healthcare delivery institutions must adapt to this changing care landscape if they are to continue to provide quality care and economically survive and compete both in the present and in the future.
The Demand
The world’s population is steadily aging with advances in public health, medicine, and healthcare technology contributing factors allowing individuals to live longer. In 2015, only 12% of the world’s population was over 60-years of age. It is estimated that by 2050 nearly 22% of the world’s population will be over 60-years of age. Older adults are generally those with the greatest need of primary and specialty care secondary to the high rates of multiple chronic risks and illnesses (i.e., type II diabetes, hypertension, metabolic syndrome, dementia).1,2 High co-morbidity rates in turn drive up the need for healthcare services and related costs, diminish quality of life and ultimately premature death.3-5
The Practitioner Shortage
In addition to an aging global population, we are faced with a concomitant shortage of critical practitioners across a wide range of disciplines and specialties. The net result is a significant current and future demand/supply imbalance.6-10 This shortfall is expected to continue to grow and magnify dramatically as challenge #1 inter acts with the reduction of an appropriately trained clinical workforce. For example, the US shortage is projected to be between 46,900 and 121,900 physicians by 2032, that includes both primary care (between 21,100 and 55,200) and specialty care (between 24,800 and 65,800).11 The World Health Organization (WHO) estimates that the global shortage is estimated at 4.3 million physicians, nurses, and other health professionals.12
The Evidence Limitations
In developed and developing countries, 25% of adults have 2 or more chronic conditions.13 Decades of population health management with recent electronic health record systems has helped improve quality, chronic care management and value-based payment programs.14 Despite this impact the annual growth rate is still an unsustainable, especially with the growing aged population. patientsLikeMe.com data15 shows current cost-effective interventions for a single condition, work well for only 18% of patienst, only 5% of those patients with two conditions, and 1% for three-conditions patients with three conditions.
The Coronavirus Disease-2019 Wildcard
Lastly, and most urgently, the corinavirus disease (COVID) pandemic has underscored the need for rapid adoption of working scalable telehealth and telemedicine programs that deploy and integrate digital health and digital therapeutic (e.g. Food and Drug Administration (FDA), Medicines and Healthcare products Regulatory Agency (MHRA), or CE approved) technologies.16 Historically, acceptance by the general public and practitioners has been slow to gain traction for these technologies.17 Now the specific imperative is to develop a remote care framework and infrastructure to effectively monitor, detect, intervene, and manage chronic conditions (particularly with co-morbidities) as well as facilitate early detection and triage of acute conditions from a distance.18,19
Connected care is defined as the “real-time, electronic communication between a patient and a provider, including telehealth, remote patient monitoring, and secure email communication between clinicians and their patients”.20 Connected care creates a high value interaction strategy with patients that makes thoughtful use of commercially available digital health technologies that have demonstrated both clinical and economic effectiveness.18-21 These device-based touch points serve as treatment extenders, engaging and promoting sustained change to patients and feedback data to other stakeholders (treatment team and family caregivers). The notion of digitally connected care addresses these elements by creating data-driven interaction strategies with patients and caregivers to inform the thoughtful and smart use of content, data, products, and services (i.e. live interpersonal interactions, aka ecological momentary assessment and intervention).22 Benefits of using digital health coaching include the ability to standardize and yet individualize care for each person as well as provide that care consistently, continuously, remotely and at scale. Schwartz and colleagues23-25 have shown that the use of digital health coaching can significantly decrease medical costs among patient-users.
The Connected Home
With more people progressing to old age and very old age, healthcare systems are faced with a shifting population demographic with different needs for care. This adaptation must serve the need for efficient, effective, scalable and remote ways to care for more elderly people.26 Such care must address health risks, co-morbidities, functionality, and quality of life (i.e. aging in place). There are now available a variety of commercially available connected care technologies that when properly organized can provide a comprehensive measurement and evaluation for persons to better engage in self-care in their home environment. Families and even healthcare facilities may be too far away, have limited resources, or competing commitments to provide consistent care and oversight of an individual needing support. In situations like these, relatives depend on care service providers to keep them up-to-date regarding their loved one’s health and ensure their loved ones are able to age in place or stay in their own homes longer.27 Such technologies promote aging in place by monitoring a wide variety of biobehavioral, emotional, and functional measures in ways that enhance self-care and other care support and still protect the individual privacy of the patient (i.e., no video is required). The COVID pandemic has accelerated the need for such capabilities to monitor and care for these high-risk demographics.
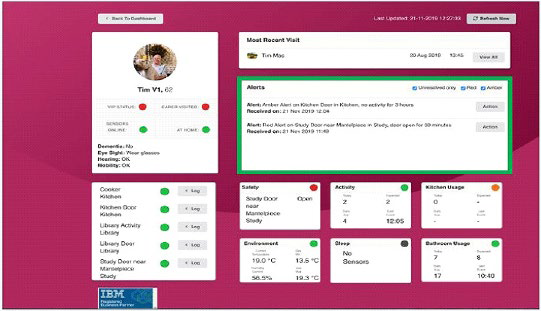
Home sensor technology is an innovative health strategy that when coupled with smart analytics has the capacity to transform the connected care and chronic condition management that is characterized by an aging population. Karantis360™ Inc. is one such commercially available company capable of setting up a configured connected home. Based in the United Kingdom, Karantis360™ combines sensors, machine learning, analytics and cloud technology to help individuals live independently for longer. This is accomplished by way of advanced and continuous monitoring, early detection of anomalies, and delivery of content and interventions as needed based on clinical and business rules. Data is collected from the sensors and aggregated, then a picture of individuals’ typical behavior patterns is built based on a learning phase. By leveraging a selected network of non-intrusive sensors and automated data communication, this connected home can flag exceptions to routines and habits, such as whether the patient got out of bed, is sitting in a chair, has boiled water, used the bathroom etc. Figure 1 is a screenshot of the alert dashboard screen that displays both raw data and traffic light indicators (green, amber, red) as status indicators. The system also allows for the application of established rules, benchmarks, algorithms, etc, that can alert care providers to other anomalies using the dashboard and push notifications. In this case several alerts are of note including extended open doors on the refrigerator and study door. These alters allow practitioners to check up on the patient by telephone or face-to-face. The information is then delivered to clients, caregivers, and family members with permission via a web and mobile dashboard.
Figure 1. Home Sensor Technology Alert Screen
Small Data and N-of-1 Analytics
Human health has dual truths. Philosophy of science often refers to this as. the nomothetic vs. idiographic tension. The first holds that as members of the same species, we share the same deoxyribonucleic acid (DNA), organ systems, developmental pathways, and basic need states. Developing and testing efficacious, evidence-based, and generalizable treatments using measures of central tendency (e.g., averages, norms, benchmarks, etc.) rest heavily on this truth. As such, this approach has produced reliable and valid findings centered on a population perspective regarding what on average will help the most people.
The second truth is that each of us is unique, with unique DNA, different learning histories, habits, values, cultures, subcultures, and risk profiles. This second truth has given rise to concepts such a tailoring, patient-centered care, personalization, and precision medicine all of which focus on aligning treatment to the relevant individual differences among patients. The more complex or multifactorial the condition in terms of its risks, onset, course, and treatment response, the more our individual differences matter in terms optimized treatment and recovery. Now with the increased sophistication of mobile connected health technology the best of both evidence-based (generalized) knowledge and individual science (N-of-1) can be implemented, tested, iterated and optimized. Unfortunately, group data and more recently big data approaches for generating new behavioral insights are limited in helping doctor and patient understand individual differences in response to interventions. N-of-1 treatment designs and analysis provide a potential solution. These methodologies have been rigorously developed, articulated, and applied for over a half century and are specifically intended for valid evaluation of individual differences.27-38 The father of evidence-based medicine, Dr. Gordon Guyatt, refers to N-of-1 as the highest level of evidence-based clinical patient care and treatment effect.32 These approaches have never achieved widespread adoption by practitioners or patients because the labor and time required for collecting data for N-of-1 analyses was prohibitive. However, with the ubiquity and ongoing innovation around digital mobile and wearable technologies, this barrier is no longer an issue.
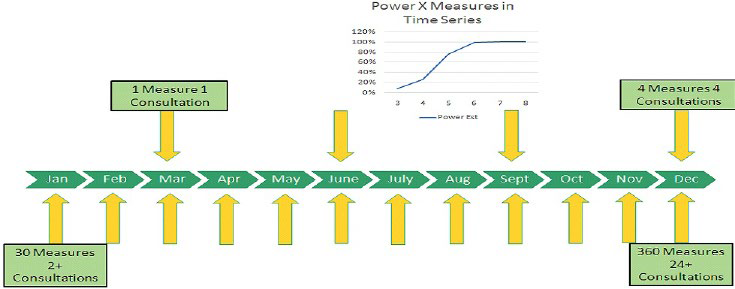
IndividuALLyticsTM Inc. is a U.S. based company that provides personalized cloud-based software to support telemedicine that enhances individual data back to providers, caregivers, and patients. This is accomplished by applying group average science (e.g. guideline, best practices, randomized controlled trial (RCT) data) and individual science (N-of-1 analytics) for managing complex chronic risks, disease and mental health issues. This combined approach leverages time-series data to evaluate individual treatment responses in such a way that can inform health and quality of life outcomes faster and with increased accuracy relative to current standard medical practice alone. Figure 2 displays the measurement sequence for a standard of care set of quarterly visits relative to the IndividuALLyticsTM Inc. N-of-1 systems in terms of patient live contacts and clinical measures taken. The IndivuALLyticsTM patent-pending analytics engine provides personalized precision dashboards The method improves upon current standard of care by evaluating time series data at the level of each patient and then aggregating and triangulating that change data (including derived from various commercially available digital health technologies) visualizes it via clinical and patient friendly dashboards to better evaluate treatment responses. These dashboards reflect N-of-1 analytic engine output to enable and inform clinical and (other) care decisions more efficiently. Treatment decisions can more efficiently and effectively inform clinical and patient management decisions across key constituents (patient, caregiver network, physician and treatment team, virtual care team). The N-of-1 analytic engine gets optimized via curated connected care technology and its time-ordered data (e.g. wearable devices, smartphone apps, blood glucose readers, etc.). The N-of-1 engine gains power by adding more measures of the individual across treatment phases (i.e. time-series data) and delivers a rigorous output – called an IndividuALLytics™ Quotient (iconically displayed as ++ + 0 – –) regarding an individual’s unique response to a phased treatment. The Indoor Air Quality (IAQ) values are designed to be easy read icons the function much like a vital sign.
Figure 2. Powered by Increased Measures
CASE SERIES
In order to begin testing the feasibility of combining home-based senor analytics with individual person digital health data including biobehavioral data, we combined the Karantis360TM home sensor technology and data with IndividuALLyticsTM individual science N-of-1 analytics engine. Both companies meet national and local requirements for data integrity, security and privacy. The IndividuALLyticsTM engine was supported by a set of curated commercially available digital health and therapeutics technologies. These subjects were existing customers of the Karantis360TM care system and as such had the home sensor technology installed prior to being onboarded into the IndividuALLyticsTM platform. Each person had their homes equipped to monitored temperature/humidity, safety via magnet sensors on the various appliances and cupboards in the kitchen, entry doors to the home, sleep via a pressure switch, activity via motion sensors in hallways, and bathroom usage via vibration sensors. Each home was given a one week of “learning” phase as part of the standard Karantis360TM implementation so the sensor system could learn to accurately send alerts regarding abnormal activity. For example, a green alert indicated an entry door closed, an amber alert indicated an entry door open for more than 10-minutes, and a red alert indicated an entry door open for more than 30-minutes. These alerts were reported to caregivers to act as needed.
Recruitment
All 3 subjects were existing customers of the Karantis360TM service.
Each of the 3 use cases presented here were selected based on their prior use of and comfort with the Karantis360TM home sensor technology, comfort living with that technology, and the understanding of their health histories and they had acclimated to its presence in the home. All 3 subjects completed consent to the use of the technology as describes for both Karnatis360TM and IndividuALLyticsTM technologies and services for their use in managing their health, chronic illness self-management and general functionality. They also consented to the use of their anonymized data for research and other presentation purposes. The subject quote used in this manuscript was obtained when prompted by a member of the Karantis360TM staff while engaging in a conversation with the relevant parties and asking them how they felt the trial went.
In addition to the home sensor technology solution, the three subjects voluntarily agreed to be equipped with a Fitbit device (i.e. Inspire HR model) to track the proximal outcomes of physical activity (i.e. steps) and sleep patterns (i.e. sleep total hours, sleep onset and morning awakening).29 These measures were chosen as the initial test because the data could be collective with minimal input from the subject and was reliably and validly available from a commercial company and commercially available products. The subjects were instructed to wear the device 24/7 except when charging every 3 to 5-days when necessary. The Fitbit data was collected as daily time series data and analyzed using the n-of-1 analytic engine producing IAQ++ outputs to inform phased lifestyle intervention changes every two-weeks.
Subject 1: Subject 1 was a 76-year-old female living in her own home with her spouse who served as her full-time caregiver. She had additional family support and part time paid caregivers. Medical history was remarkable for a primary diagnosis of early onset dementia. She also experienced gallbladder symptoms.
Figure 3. Subject 1 N-of-1 Analytics Dashboard
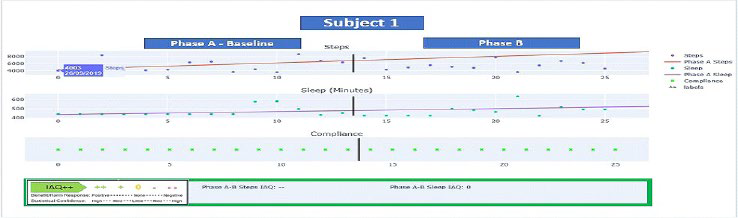
Subject 1 was given the dual goals of increased steps and sleep hours with goals derived from the baseline Phase A average daily steps of 5451 and an average of 8.3-hours of sleep per night. Her initial goal focused on increased activity. Below are the IAQ++ dashboards for the two phases (A and B) of data collected regarding steps and sleep. Figure 3 displays the phase A-B evaluation of steps, indicating an “IAQ–” meaning that not only did subject 1 not achieve the intend goal of steps but demonstrated a statistically significant decline (IAQ–) in steps from baseline (Phase A) to (Phase B) (p<0.05). The red trend line indicates an upward baseline trend which in part explains the statistically significant change. Note this negative trend would not have been identified by the weekly average steps of 5451 for Phase A and 5540 for Phase B respectively which does not consider the trending inherent in time-series data. For sleep the Phase A-B change evaluation was IAQ 0 indicating no statistical change (p=ns) in sleep hours. Subject 1 was not able to improve sleep hours but maintained baseline hours. Through Subject 1’s trial it was learned from the caregiver that adherence to the behavior change was low secondary to the cognitive limitations developing out of Subject 1’s early onset dementia. The spotty data collected from subject 1 illustrates the difficulty of applying this type of integrated technology and behavior change solution to an individual with cognitive impairment including but certainly not limited to early onset dementia.
Subject 2: Subject 2 was a 67-year-old female living in her own home with her spouse acting as full-time caregiver. Subject 2 also had additional family support and part time paid caregivers. Her medical history is notable for a primary diagnosis of type II diabetes. She also experienced slight hypoxia and mobility issues due to fear of falling. For Subject 2 Phase A baseline of 2-weeks applied no treatment goals and indicated an average daily step count of 5296 steps and 5.9-hours of sleep per night on average. Following the 2-week baseline period, the Phase B (i.e. intervention phase) treatment goal was to achieve a minimum of 7000 steps/day. Phase C served as a behavioral addition with the goal of maintaining a minimum of 7000 steps/day and to add 8-hours of sleep/night by way of adopting a consistent nightly bedtime. As shown in Figure 4, subject 2 was highly engaged as indicated by the fidelity of her data in which she even continued daily data collection post-trial (i.e. Phases D, E, and F).
Figure 4. Subject 2 N-of-1 Analytics Dashboard
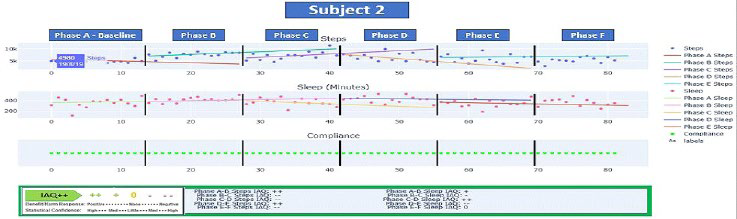
Figure 4 displays Subject 2’s IAQ++ dashboards for steps and sleep for Phases A through F. Steps for Phase A show a declining trend with a significant upward trend for both B and C Phases. The IAQ values depending on phase paring show either statistically significant increases or decreases over time (p<0.05) for steps and (p<0.10 or 0.05) depending on the phase comparison for sleep. Steps showed a significant (p<0.05) increase in Phase B AQ ++) (from an average of 5296 steps per day to 7598 average daily steps. There was an equally significant decrease in Phase C From 7598 to 7209 in average daily steps but with a significantly negative trend (IAQ–, p<0.05) but which still met the specified goal of 7000. Phase D also showed a significant downward trend (IAQ – -, p<0.05) in steps with a daily average of 6267 (now below goal expectations). Average daily steps for Phases E and F also on average fall below expectations (5948 for Phase E and 5358 for Phase F) but still above baseline. What daily averages alone do not clearly show but what can be seen from Subject 2’s dashboard is the declining daily step pattern and slope in Phase D but which stabilizes for the E Phase (albeit below goal).
Sleep showed a similar up and down pattern which is not uncommon with behavior changed. Her baseline of 5.9-hours improved during the B Phase to an average of 6.9-hours per night (p<0.10) but regressed in Phase C (average hours dropped to 6.2) (p<0.10) but still above baseline. She showed significant improvement (IAQ ++, p<0.05) for Phase D with 7.16-hours. Phases E and F showed dips from D phases to 5.9 hours and 6.2-hours respectively. Throughout the combined solution phases Subject 2 did demonstrate an overall increase in sleep hours (average 3-hours per night) and her fitness levels dramatically improved (steps before/after), In total, the phased connected care solution resulted in a weight loss of 1.3 stones (18.2 pounds) and her diabetes levels have dropped by 3 points.
The sleep and fitness outcomes aligned with the home sensor data, which not only confirmed less time spent sedentary but also increased activity included leaving the house to walk at regular times. Home sensor data confirmed less time spent in her lounge chair, and she also explained she had bought a walking machine, and the sensor in the bedroom confirmed more movement in the afternoon which is when she used the machine. The home data also confirmed that her pattern of bedtime behavior had become more routinized in terms of bedtime and bedtime rituals. Karantis360TM data also indicated that Subject 2’s pattern of eating, drinking and bathroom use changed (i.e. both behaviors showing less frequency at night) and more daily time regularity.
By integrating and triangulating (cross-validating) both home sensors and digital wearable technologies it can be confirmed Subject 2’s lifestyle was changing, and the combined solution had a positive impact on her motivation, physical and mental wellbeing. These conclusions were reflected in the biometric of weight loss.
Subject 3: Subject 3 was a 57-year-old male living in his own home alone. His medical history was significant for diagnoses of high blood pressure, high cholesterol, and type II diabetes. Subject 3 also had a Phase A baseline with no treatment goals applied to steps (baseline weekly average was 6751 steps). Baseline sleep hours were 7.6-hours and this was not formalized as a goal. Therefore, Subject 3’s treatment goal was to achieve a minimum of 7500 steps/day consistently. The Phase C goal for subject 3 was to maintain a minimum of 7500 steps/day (maintenance phase).
Figure 5 below displays the Phases A-D IAQ++ dashboards for steps and sleep. Subject 3 was also highly engaged with the monitoring system and like Subject 2 continued daily data collection post formal trial period. Subject 3 also showed a B phase decline in steps changing from an average of 6751 to 6486 (IAQ–) (p<0.05). The, C Phase demonstrated an average improvement with average steps of 7568. This was driven by several high step outlier days resulting in an IAQ 0 or non-significant change in slope). The D Phase indicates both a decline in step activity in terms of average daily steps (6267 steps) and slope (IAQ–. p<0.05).1
Figure 5. Subject 3 N-of-1 Analytics Dashboard
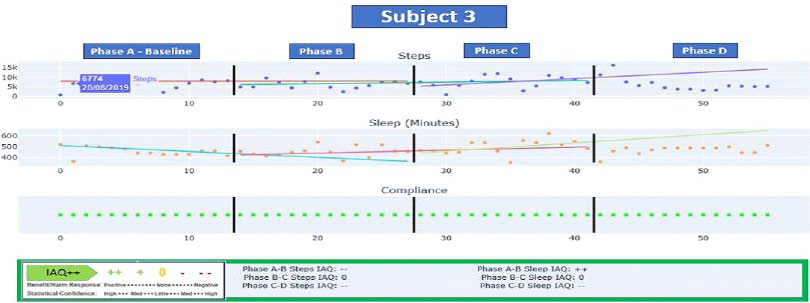
Regarding sleep, Subject 3’s baseline A Phase indicated adequate sleep hours but his B Phase still demonstrated an initial increase in sleep hours from A (7.6-hours) but with a declining slope. The B Phase showed a slope reversal (IAQ++, p<0.05) although the average daily hours of sleep remained essential unchanged (7.55-hours). Average sleep hours increased to 8.2-hours in phase C with stabilization of the slope in Phase D (IAQ 0, p=ns) with average hours of 7.6 on average per night.
Of note, during Phase D Subject 3’s data showed IAQ++ outcomes of “- -” for both steps and sleep indicative of significant declines in step-indicated activity and sleep hours during this 2-week period relative to the previous phases. The home sensor technology triggered amber and red alerts due to lack of activity in key household rooms during this period helping validate these findings. Clinically speaking, when combined the combined IndividuALLyticsTM and Karantis360TM datametric from the IAQ++ dashboards and home sensors respectively would potentially be indicative of an acute change and reason for concern and clinical outreach. In this case, the combined technology serves as an early detection system. In this particular case the integrated data on decreased activity and sleep were confirmed to be associated with an acute bout of influenza.
DISCUSSION
The technology and analytics capabilities are now such that a connected care experience that monitors and reports on key biobehavioral parameters of a patient in situ (i.e., digital twin reference other paper) is now both possible. The challenge before the healthcare systems (world-wide) is how to make connected, remote care capabilities practical, usable and most importantly clinically useful to both patient and practitioners. By way of 3 use-cases, this paper begins to address the “practical” aspects of application. Each case is an illustration of a real individual attempting to manage multiple chronic condition, equipped with a set of home and personal sensors using commercially available technology (motion sensors, temperature sensors, magnet sensors, pressure sensors, activity and sleep trackers). From a purely outcomes perspective, these cases represent a mix of proximal successes and failures.
Subject 1 illustrated the challenges of this approach for those with cognitive impairment. As presented here was largely an application failure secondary to the patient’s dementia related cognitive deficits. However, as is true with most failures there were learnings to consider for the next iteration. The implications for use with patients who have a mild-level of cognitive deficits and depending on the nature and progression of those deficits, should minimize patient level new learning requirements. In such context it might be more beneficial overall to focus the intervention and technology on the primary caregiver to better foster caregiver competence, confidence and coping. In many practical applications the greater use of a highly present caregivers or family both to assure proper patient connectivity but also to monitor and manage their own caregiver strain. Tools like the mobile app genusConnect® are design to specifically facilitate, coordinate and even crowdsource patient support that integrates with practitioners (https://www. genusconnect.org/).
Subject 2 demonstrated a more optimized initial success both in terms of increased physical activity, improved sleep hours and patient adoption and experience. This subject was able to meaningfully change a key biometric of weight fostered in part by habit building around increased physical activity. Importantly, this included more confidence in going out and being physically active. She was also able to change bedtime habits (confirmed by the combined technology) and increase sleep hours. Regarding her experience and satisfaction with the solution subject 2 commented the following:
“I have been participating in a trial which has had a very positive impact on my diabetes. I have seen a significant decrease in my glucose levels which has been achieved by increasing my daily activity which can be seen with the sensors. I sleep much better, have lost weight and feel physically and mentally healthier. I would not hesitate to recommend this combined program to help anyone with diabetes or needing other kinds of care.”
Subject 3 demonstrated a successful experience in terms of consistent engagement. His data indicted some difficulty in initiating the target behaviors (i.e. with inconsistent successes and digressions). This pattern is common in behavior change and was again accurately reflected in the combined data of both technology platforms. Perhaps, more importantly the integrated data pattern coming from Subject 3 during the D Phase was able to detect health relevant acute health changes in biobehavioral activity that ultimately indicated an acute bout with influenza. In the new era of COVID this can be of unique practical value.
This proof-of-concept report of 3 connected care use-cases is far from definitive but are successful in both demonstrating what is possible and illustrating some of the practical challenges that existing in building out a practical and useful connected care, remote care set of solutions. There were several practical experiences limitations encountered during these initial trials. First, maintenance of wireless internet and bluetooth connections between in home sensors, wearable devices, smart phones, and databases was not complete 24/7 throughout the trial period. Thus, data gaps emerged which depending on the patient circumstances could be of significant consequence. As with any data but particularly the time-ordered data leveraged here, data gaps weaken the overall accuracy. In order to maintain a complete digital twin of the patient it is essential that there be as little data missing as possible. There are also data strategies for dealing with missing data but the integrated Karantis360TM and IndividuALLyticsTM system tested here as yet has not built such functionality within the analytics engine. This limitation in the tested solution was addressed through new alerts implemented within the home sensor technology and N-of-1 analytics engine system showing when a sensor is not live or a wearable has not synced data within a certain time period.
Neither subject had difficulty with this adapting and adopting the new technology including, the new behavior of wearing the activity and sleep tracking device along with keeping the device charged and syncing with a smartphone. We recognize that this may not always be the case particularly for many elderly patients (particularly those with some level of cognitive impairment). Both companies provide a detailed onboarding, patient support service and detection and intervention for technical issues is present in both companies depending on the nature of the issue. In some cases, it also may be more effective to design the system in these situations to be more caregiver centric as opposed to patient centric.
Lastly, for such technology to be truly practical and of high clinical value, it must be integrated with the attending physician and extended care team. This could include more ecologically targeted outreach and intervention when subjects fell off the target goal. This initial pilot was focused on the initial patient experience and adoption. Importantly, both the Karantis360TM technology and IndividuALLyticsTM technology have been developed to integrate into clinical technologies like electronic health records and to present information to clinicians in highly visualized dashboards.
CONCLUSION
As is often the case when initially testing a new concept there was much that did not work or work in an optimal fashion but that is the nature of testing iteration. These use cases illustrate our experience with a combined digital health solution as an initial test of a number of important concepts but with much more work to be done. These cases did not fully integrate the provider (only a virtual care team was involved to determine phase changes) or payer systems into the solution. This will ultimately be critical for addressing the issue of clinical scale and to also enhance the practitioner presentation and utilization of the data better. This proof of concept did not integrate the data with the subject’s physician per their expressed preferences given only basic health data (steps and sleep hours) were the focus of the interventions. These use cases are by definition small in number and more real world research with more persons under more clinical and social circumstances must continue if we are to develop a robust connected remote healthcare infrastructure and implementation. As is common in digital design, the overall experience for the patient needs iterative improvement that can still leverage small samples but ultimately the value (assuming continuing improvement) will be in large scale implementations and testing. Three elements of the system tested here (i.e. Karantis360TM data, IndividuALLyticsTM data, and a tool like genusConnect®) would specifically require deeper integration of the connected care elements to be tested as an enhanced clinical care application with clear and measurable clinical value for both practitioner and patient.
In the future specific patient experiences for the better management of highly prevalent and co-morbid conditions will prove most useful as these are also the most complex, costly health conditions particularly in an aging global population. With improved user experience this model will require integration with and connection to other portions of the patient care network, namely practitioners and caregivers. This deeper integration will allow greater coordination (particularly of an aging population), will better coordinate the formal care of practitioners with the informal and often under leveraged value of the extended support network. When aggregated these individual successes at the patient level become mini treatment replications which based on specified analytical rules can generate new learnings and predictive models. The N-of-1 analytics engine be directly integrated into a highly configurable set of home sensor and digital health technologies so that the N-of-1 analytics dashboard be easily accessible to all the key stakeholders (i.e. the patient, the practitioner, the caregivers) as a full care support safety net. Future applications would allow for physician and/or other medical personnel better and more efficiently track phased patient interventions and progress that combines standard medical care with better integrated lifestyle and behavior change interventions that substantiate positive treatment effects and also identify via early detection patients for whom the current regime is not working or for whom the context has changed. Specifically, the system could better determine benefit/ harm to the individual patient compared to or in combination with lifestyle changes. Early detection and management of side effects (i.e., nausea, dizziness, dry mouth, etc.) would also be enhanced. Technology has the potential to scale care in ways that can help the growing shortage of practitioners meet the current and coming demand. Which this use case report is far from definitive, it represents a step toward understanding how to best integrate technology into the care and support of patients and caregivers.
CONSENT
The authors have received written informed consent from the study subjects.
CONFLICTS OF INTEREST
The authors declare that they have no conflicts of interest.


