INTRODUCTION
The programmed death (PD)-1 protein has potent inhibitory effects on T-lymphocytes and other immune cells, including B-lymphocytes and monocytes.1 PD-1 is activated by its two major ligands: PD-L1/CD274, expressed on the surface of various immune cells including T- and B-lymphocytes, macrophages, and dendritic cells, and PD-L2/CD273, expressed on antigen-presenting cells such as macrophages and dendritic cells. PD-L1 may also be expressed by tumor cells to evade immune killing,2 thereby in creasing tumorigenesis and invasiveness.
Accordingly, PD-L1 has been associated with poor prognosis in non-small cell lung carcinoma, melanoma, renal cell carcinoma, and esophageal/gastric carcinoma.3,4,5,6 Antibodies to PD-L1 (atezolizumab and durvalumab) have been approved by the FDA to treat certain solid tumors (e.g. advanced urothelial carcinoma, non-small cell lung carcinoma) and are under development to treat other malignancies.7
Overall, PD-L1 is expressed by a minority of human breast tumors,8 and there are conflicting reports regarding the prognostic import of PD-L1 in breast cancer: some studies have associated overexpression of PD-L1 with inferior overall survival, while other studies showed improved prognosis.9,10,11 A recent metaanalysis of PD-L1 expression in breast cancer concluded that expression of PD-L1 is associated with lymph node positivity, higher histologic grade, hormonal receptor-negative status, and shorter overall survival.12
However, there is still a lack of consensus regarding the prognostic value of PD-L1 in triple-negative breast cancers (TNBC, heterogeneous tumors that do not express estrogen receptor, progesterone receptor, or HER2).13,14,15 Because TNBC represent 10-20% of new diagnoses of breast cancer, have inferior clinical outcomes, and lack molecularly targeted therapies, there is intense interest in emerging immunotherapeutic approaches such as agents that target PD-L1. Increased levels of tumor-infiltrating lymphocytes (TILs) have been observed in TNBC,16,17 leading to the hypothesis that these tumors may be particularly susceptible to immune-modulating therapies.
While PD-L1 is more commonly expressed in TNBC than in hormone receptor-positive cancers, most TNBC do not express PD-L1.8,18,19 Nevertheless, clinical trials are underway, particularly in the metastatic setting where the need for novel therapies is most acute. For example, a recent phase 1 trial of atezolizumab in TNBC reported a 19% objective response.20 Another potential therapeutic target in TNBC is PD-L1’s receptor, PD-1. In a phase 1b trial of anti-PD-1 pembrolizumab in metastatic TNBC positive for PD-L1 (defined as >1% in tumor cells or stroma), clinical benefit was observed in 20% of subjects.21 The relatively low response rates observed in these trials suggest that current methods for patient selection are suboptimal.
To better understand the prevalence of PD-L1 positivity and its association with survival in TNBC, we undertook a retrospective cohort study at a major academic medical center and a systematic review of comparable studies. Both activities aimed to investigate a pair of research questions: In primary TNBC, is tumor expression of PD-L1 prognostic of survival? If so, is PD-L1 expression in stromal and immune cells as prognostic as PD-L1 in tumor cells?
METHODS
Subjects
Because the study utilized routinely archived specimens only and involved no contact with patients, the institutional review board granted a waiver of informed consent for this study. Women with newly-diagnosed primary TNBC who underwent surgery during 2002-2010 were eligible for study. Subjects had archived tissue containing invasive ductal carcinoma (IDC) and corresponding clinical data available from the academic medical center’s tissue procurement laboratory. Patients who lacked data on RFS or tumor dimensions or whose sample did not yield a core of tumor tissue were excluded. Patients who had received neoadjuvant treatment prior to surgery were included, but their neoadjuvant history was considered in the statistical analysis. Follow-up for recurrence-free survival (RFS) continued through September 2016 or last contact.
Tissue Acquisition
All samples were tissue from breast tumors that had been excised, processed into formalin-fixed, paraffin-embedded blocks, and subjected to routine pathologic examination. The latter examination had included immunohistochemistry (IHC) and fluorescent in situ hybridization (FISH) to determine endoplasmic reticulum (ER), per rectum (PR), and HER2/neu status. To meet the definition of TNBC, tumors had to be negative for ER and PR (0% to <1% staining by IHC) and negative for HER2/neu (defined as a score of 0 and 1+ by IHC and Her2/CEP17 ratio <2.0 by FISH). Ki-67 level, obtained from routine pathologic examination of the tumor, was classified as high when above 25%.22><2.0 by FISH). Ki-67 level, obtained from routine pathologic examination of the tumor, was classified as high when above 25%.22
Construction and Staining of Tissue Microarray (TMA)
For each tumor, several tissue blocks were selected containing representative areas of normal tissue, ductal carcinoma in situ (if present), and invasive ductal carcinoma. A tissue microarray (TMA) was then constructed containing three 2 mm cores from each of the representative blocks, sampled from distinct areas to capture possible tumor heterogeneity. These cores (9 per tumor) were deposited into a recipient paraffin block using a TMA workstation (TMA builder 20010.02, Histopathology Ltd., Hungary). Four TMA blocks were ultimately prepared. From the TMAs, serial 3 μm tissue sections were cut and adhered to charged glass slides for subsequent hematoxylin and eosin (H&E) and immunohistochemical staining.PD-L1 staining was performed using the Agilent FDA-approved kit incorporating Dakoclone 22C3 (Agilent North America, Inc., Carpinteria, CA, USA). Following deparaffinization and antigen retrieval using sodium citrate buffer (pH 6.0), staining for CD8 was performed using clone 144B at 1:200 dilution, incubated overnight at 4°C (Abcam, San Francisco, USA).
PD-L1 Expression
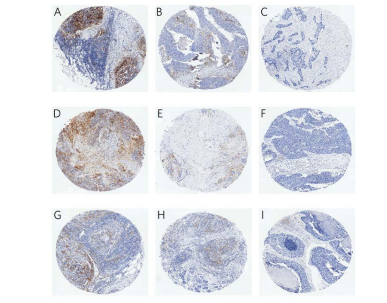
TMA slides stripped of clinical information were interpreted independently by two board-certified pathologists with breast expertise. For each core, the readers scored tumor cells, tumor-associated immune cells (primarily lymphocytes and histiocytes), and tumor stromal cells separately on their percentage positive for PDL1 staining (Figure 1). Within each core, each pair of scores per cell type was averaged. Each patient was assessed on whether any of her cores scored high (>10%) for PD-L1 in tumor, in stroma, or in immune cells.
Figure 1. Representative PD-L1 Staining in Tumor Cells (Top Row), Stromal Cells (Middle Row), and Immune Cells (Bottom Row) that Illustrates High (>10%, A, D, G), Intermediate (>5%-10%, B, E, H), and Low (0-5%, C, F, I) PD-L1 Expression
Statistical Analysis
Correlation between patient PD-L1 status (high/low) per tumor cells, stromal cells, and immune cells was evaluated by Fisher’s exact test of proportions. For the survival analysis, proportional hazards regression was used to evaluate high PD-L1 in tumor cells as the primary risk factor, and high PD-L1 in stromal and in immune cells as secondary risk factors, for RFS. Covariates accounted for in the survival analysis were age at diagnosis, tumor’s greatest dimension, tumor’s Ki-67 level, distant metastasis, and lymphovascular invasion; history of neoadjuvant treatment was omitted as a covariate after it was found not to improve the models’ fit to observed survival.
In two subgroups, the proportion of cores associated with an event (recurrence or death) was either 0 (observed with the primary risk factor: high PD-L1 in tumor cells) or 100% (observed with the covariate: distant metastasis at diagnosis). To accommodate these sparse data, data augmentation23 was applied to the proportional hazards regression, specifying the following prior median hazards ratios: 0.5 (95% limits 0.2-1.2) for high PD-L1 in tumor cells and 4 (95% limits 1-16) for distant metastasis. The primary risk factor’s approximate posterior median hazards ratio was interpreted as statistically significant (p<0.05) if its 95% profile likelihood limits excluded 1.0. Literature Review A systematic search of MEDLINE-indexed journals was undertaken in April 2019 using the terms “PD-L1 expression AND (TNBC OR basal-like)”. The resulting 100 publications were reviewed by one of the current authors (CEB) to identify and summarize the 22 studies that presented original analyses evaluating PD-L1 expression for association with overall or disease-free survival among patients with TNBC.> <0.05) if its 95% profile likelihood limits excluded 1.0.
Literature Review
A systematic search of MEDLINE-indexed journals was undertaken in April 2019 using the terms “PD-L1 expression AND (TNBC OR basal-like)”. The resulting 100 publications were reviewed by one of the current authors (CEB) to identify and summarize the 22 studies that presented original analyses evaluating PD-L1 expression for association with overall or disease-free survival among patients with TNBC.
The study included n=112 subjects (Table 1); their age at diagnosis was 54.7±12.7 years. Median follow-up of subjects was 3.5 years (range 3 days-9.4 years). During follow-up, TNBC recurred in 24 subjects, and another 4 subjects died without a recurrence.
Table 1. Subjects with Primary Triple Negative Breast Cancer (N=112)
| Characteristics |
N |
| Age |
|
| 30-64 Years |
88 (78.6)
|
| 65-87 Years |
24 (21.4)
|
| Menopausal Status |
|
| Premenopausal |
42 (37.5)
|
| Postmenopausal |
62 (55.4)
|
| Status Unknown |
8 (7.1)
|
| Family History of Breast and Ovarian Cancer |
|
| Breast Cancer Only |
42*(37.5)
|
| Ovarian Cancer Only |
4 (3.6)
|
| Both Cancers |
12 (10.7)
|
| Neither Cancer |
52 (46.4)
|
| Family History Not Available |
2 (1.8)
|
| Type of Surgery to Excise Tumor |
|
| Lumpectomy |
64 (57.1)
|
| Mastectomy |
44 (39.3)
|
| Both |
4 (3.6)
|
| Number of Interpretable Cores of Tumor |
|
| 1 |
14 (12.5)
|
| 2 |
26 (23.2)
|
| 3 |
56 (50.0)
|
| 4, 5 or 6 |
15 (14.3)
|
| TNM Stage |
|
| I |
27 (24.1)
|
| II |
66 (58.9)
|
| III |
16 (14.3)
|
| IV |
1 (0.9)
|
| Stage Not Available |
2 (1.8)
|
| Largest Dimension of Tumor |
|
| 0.2-<2.0 cm><2.0 cm |
34 (30.4)v
|
| 2.0-<4.0 cm |
52 (46.4)
|
| 4.0-16.0 cm |
26 (23.2)
|
| Neoadjuvant Treatment |
|
| Yes |
13 (11.6)
|
| No |
99 (88.4)
|
| Distant Metastasis |
|
| Present |
17 (15.2)
|
| Absent |
95 (84.8)
|
| Ki67 |
|
| Above 25 |
94 (83.9)
|
| 1-25 |
18 (16.1)
|
| Lymphovascular Invasion |
|
| Present |
39 (34.8)
|
| Absent |
73 (65.2)
|
| *Includes 2 subjects whose family history was informative regarding breast but not ovarian cancer. |
Subjects contributed 1-6 cores each,for a total of n=308 cores; most (87.5%) subjects were represented by multiple cores (Table 1). All but 2 cores contained invasive ductal carcinoma (IDC); the exceptions were both adenoid cystic carcinoma. At least one core with high PD-L1 expression in tumor, stromal, and immune cells was found in n=10 (8.9%), n=11 (9.8%), and n=11 (9.8%) subjects, respectively. Within patients, PD-L1 status (high/ low) perstromal cells was correlated with PD-L1 status pertumor cells and per immune cells; however, there was no correlation between PD-L1status per tumor cells and immune cells (Table 2).
Table 2. Correlations among Patients’ PD-L1 Status per Tumor, Stromal, and Immune Cells
| A) PD-L1 Status per Tumorversus StromalCells |
| PD-L1 per Stromal Cells |
|
|
| N (ROW %) |
High |
Low |
| PD-L1 per Tumor Cells |
|
|
| High |
5 (50.0) |
5 (50.0) |
| Low |
6 (5.9) |
96 (94.1) |
| *Fisher’s exact test, p<0.001 ><0.001 |
|
|
| B) PD-L1 Status per Tumor versus Immune Cells |
| PD-L1 per Stromal Cells |
|
|
| N (ROW %) |
High |
Low |
| PD-L1 per Tumor Cells |
|
|
| High |
2 (20.0) |
8 (80.0) |
| Low |
9 (8.8) |
93 (91.2) |
| *Fisher’s exact test, p=0.25 (not significant) |
|
|
| C) PD-L1 Status per Stromal versus Immune Cells |
| PD-L1 per Immune Cells |
|
|
| N (ROW %) |
High |
Low |
| PD-L1 per Stromal Cells |
|
|
| High |
4 (36.4) |
7 (63.6) |
| Low |
7 (6.9) |
94 (93.1) |
| *Fisher’s exact test, p=0.01 |
|
|
In the survival analysis, the primary risk factor, High PD-L1 in tumor cells, was associated favorably with RFS (Table 3, Model A), independently of age, distant metastasis, tumor size, lymphovascular invasion, and high Ki67. In contrast, neither secondary risk factor, high PD-L1 in stromal or in immune cells, was associated with RFS, either individually (Table 3, Models B and C) or in the same model with high PD-L1 in tumor cells (data not shown).
Table 3. Multivariable Association of Cell-Specific PD-L1 Positivitywith Recurrence-Free Survival (N=112)
| Approximate Posterior Median Hazards Ratio (95% Profile-Likelihood Limits) |
|
Model A: |
Model B: |
Model C: |
|
PD-L1 in Tumor Cells |
PD-L1 in Stromal Cells |
PD-L1 in Immune Cells |
| >10% PD-L1 Positivity in |
|
|
|
| At Least One Core |
0.44 (0.19, 0.97)*
|
0.99 (0.15, 3.67)
|
2.44 (0.56, 7.61)
|
| Adjusted for Covariates: |
|
|
|
| Per Year of Age Over 65 |
1.11 (1.03, 1.18)
|
1.11 (1.03, 1.18)
|
1.11 (1.03, 1.19)
|
| Per Centimeterof Tumor’s |
|
|
|
| Greatest Dimension |
1.54 (1.29, 1.87)
|
1.54 (1.29, 1.88)
|
1.56 (1.31, 1.91)
|
| Distant Metastasis |
10.26 (4.71, 22.67)
|
10.75 (4.87, 24.17)
|
11.64 (5.27, 26.11)
|
| Lymphovascular Invasion |
1.88 (0.80, 4.56)
|
1.85 (0.78, 4.52)
|
1.80 (0.77, 4.36)
|
| Ki-67 Above 25% |
2.37 (0.83, 8.55)
|
2.29 (0.80, 8.30)
|
2.16 (0.75, 7.88)
|
| *statistically significant (p<0.05) |
According to systematic review of the literature (Table 4), prior studies in TNBC found that high PD-L1 on tumor cells could be associated with better,24,25,26,27,28,29,30 worse,31,32,33,34,35,36,37,38or neutral39,40,41,42,43,44 outcome. A final study45 associated PD-L1 in tumor cells with either better survival, given high numbers of TILs, or worse survival, given low numbers of TILs. Two more studies considered TILs in their evaluation of PD-L1 as a prognostic factor. According to Tomioka et al,34 high PD-L1 exacerbated the worse survival associated with low TILs; moreover, according to Zhu et al,31 high PDL1 overrode the favorable prognosis associated with high TILs. In contrast to the lack of consensus across studies on the prognostic significance of PD-L1 in tumor cells, not one prior study demonstrated prognostic significance for PD-L1 expression on stromal or immune cells (Table 4).
Table 4. Literature Review: Previous Survival Analyses of PD-L1 Positivity in TNBC
|
Association with Survival
|
Reference
|
Evaluable* TNBC Cases
|
Definition of PD-L1 Positivity
|
Frequency of PD-L1 Positivity
|
Survival Metric†
|
Hazards Ratio (95% CI) (if unavailable, then p value)
|
|
Protective |
24
|
269
|
>=1% of tumor cells |
26.5%
|
DFS
|
0.39 (0.20-0.76)
|
|
25
|
Incremental RNA expression of CD274 (gene for PD-L1) |
OS
|
0.40 (0.18-0.86)
|
|
26
|
64
|
H-score >=5 in tumor cells, in stromal cells |
45.3%, 65.6%
|
DFS
|
p=0.001, p=0.002
|
|
27
|
329 basal-like |
Per unit of fold change in normalized gene expression |
N/A
|
DFS
|
p=0.01
|
|
OS
|
p=0.02
|
|
28
|
92, including 69 basal-like |
>75th quartile of H-score |
38.0%
|
DFS
|
In Basal-like TNBC: 0.39 (0.22-0.86) In Nonbasal-like TNBC: Not significant |
|
29
|
215
|
>25% of tumor cells |
32.6%
|
DFS
|
0.45 (0.21-0.96)
|
|
OS
|
0.30 (0.13-0.72)
|
|
30
|
>100
|
>=10% of tumor cells |
29.4%
|
DFS
|
p=0.04
|
|
OS
|
Not significant |
|
Harmful |
31
|
108
|
>=1% of tumor cells |
22.2%
|
DFS
|
p=0.001
|
|
32
|
61
|
>=10% of tumor cells |
39.3%
|
DFS
|
9.48 (1.09-82.32)
|
|
33
|
117
|
>70% of tumor cells or TILs‡ |
31.6%
|
DFS
|
2.47 (1.12-5.43)
|
|
OS
|
3.64 (1.46-9.07)
|
|
34
|
22
|
>=50% of tumor cells |
22.7%
|
DFS
|
15.4 (1.4-456)
|
|
35
|
128
|
>10% of tumor cells |
51.6%
|
OS
|
10.4 (3.6-29.6)
|
|
36
|
91
|
H-score >=100 in tumor cells |
58.2%
|
DFS
|
2.32 (0.96-5.62)
|
|
OS
|
2.60 (1.02-6.65)
|
|
37
|
36
|
Amplification of chromosome 9p24.1 (genes for PD-L1, PD-L2, JAK2) |
22.2%
|
DFS
|
p=0.005
|
|
OS
|
2.60 (1.02-6.65)
|
|
38
|
127 basal-like |
H-score >=100 in tumor cells |
30.7%
|
OS
|
4.97 (2.94-8.43)
|
|
None |
39
|
109
|
H-score >=100 in tumor cells |
17.4%
|
DFS
|
No association |
|
OS
|
|
|
40
|
101
|
>5% of tumor cells or TILs |
38.6% of primary tumors, 59.4% of paired tumor-positive axillary lymph nodes (LN) |
DFS, OS
|
No association with PD-L1 or TILs in primary tumor; DFS association with PD-L1 in LN lymphocytes is nonsignificant after adjustment for MHT§ |
|
41
|
103
|
>=10% of tumor cells, >=10% of TILs |
23.4% per tumor cells, 26.2% per TILs |
DFS, OS
|
No association with PD-L1 status per tumor cells or per TILs |
|
42
|
183
|
>=1% of tumor or immune cells |
13.7%
|
OS
|
No association with PD-L1 status per tumor or immune cells |
|
43
|
136
|
H-score >=5 in tumor or in stromal cells |
10% per tumor cells, 24% per stromal cells |
DFS, OS
|
No association with PD-L1 status per tumor cells; DFS association with stromal PD-L1 is nonsignificant after adjustment for MHT |
|
44
|
218
|
using clone 28-8: >5% of tumor cells, any positivity in immune cells |
12.4% per tumor cells, 36.7% per immune cells |
DFS, OS
|
No association with PD-L1 status per tumor cells; OS association with PD-L1 status per immune cells is nonsignificant after adjustment for MHT |
| Both Protective and Harmful |
45
|
248
|
>=1% of tumor cells |
41.5%
|
DFS, OS
|
Given High TILs, ~0.5; Given Low TILs, ~2.0 |
| *Cases with PD-L1 and Survival Data; †DFS=Disease-free Survival (also called Progression-free or Recurrence-free Survival); DSS=Disease-specific Survival; OS=Overall Survival; ‡ TILs=Tumor-infiltrating lymphocytes; § MHT=multiple hypothesis testing |
DISCUSSION AND CONCLUSION
In our cohort of patients with TNBC, high PD-L1 on tumor cells is associated with superior survival. The definition of high PD-L1 that was optimal here, above 10% cells staining positive, accords with a number of previous studies.30,32,35,41 Limitations of the current cohort include its modest sample size, variable number of informative cores per patient, inability to compare PD-L1 expression pre- vs post-neoadjuvant therapy (for the minority of current subjects who were treated prior to surgery), and lack of data on TILs. Still, there is growing recognition that the bivariable approach to classifying TNBC, according to high/low levels of PD-L1 and TILs,31,34,45 is overly simplistic: reducing TILs to a dichotomous variable ignores the fact that TILs vary in density, location, and interaction with PD-L1.46
The current association of high PD-L1 with favorable prognosis is consistent with findings from 7 similar studies24,25,26,27,28,29,30 and also from a recent spatial study of the tumor immune microenvironment in TNBC47 period. The latter investigators observed better survival when TNBC exhibited an immunoreactive microenvironmentthey termed fully inflamed, characterized by tumoral infiltration of granzyme Bcells, CD8+ T-cells, a type 1 interferon signature, and elevated expression of PD-L1 and indoleamine 2,3-dioxygenase (IDO) in tumor epithelium (but not in tumor stroma).
Yet as our systematic review demonstrates, the current literature includes a similar number of studies31,32,33,34,35,36,37,38 that reached the opposite conclusion about the prognostic value of PD-L1 expression, namely that it augurs poor survival in TNBC. Support for the latter view also comes from a recent study by Keren et al,48 whoused a novel methodology to study how the spatial relationship between tumor cells, immune cells, and immune-related proteins bears on survival in TNBC. Using multiplexed ion beam imaging coupled with time-of-flight mass spectrometry, they imaged 36 proteins (including PD-L1 and IDO) in tumor sections from 41 TNBC patients. Along a continuum within TNBC tumors, Keren et al. identified “three archetypical subtypes of tumor-immune interactions: cold, with low immune infiltrate; mixed, with high mixing between tumor and immune cells; and compartmentalized, in which there are regions comprised predominantly of either immune or tumor cells.” Furthermore, mixed tumors had PD-L1 and IDO expression primarily on tumor cells, while compartmentalized tumors had PD-L1 and IDO expression predominantly on immune cells, particularly along the boundary between tumor and immune cells. Finally, patients whose TNBC showed compartmentalized organization had better survival than those whose TNBC showed mixing between tumor and immune cells (an archetype that was accompanied by PD-L1 expression on tumor cells).
Thus, even among studies47,48 with access to cutting-edge assessment of the spatial distribution of PD-L1 within TNBC tumors, there remains a lack of consensus on whether elevated PDL1 expression on tumor cells predicts better or worse survival in TNBC. Perhaps the static design used by existing studies of PD-L1 in TNBC have failed to recognize what is essentially a dynamic process. Keren et al,48 present evidence suggesting that specific subsets of immune cells migrate into the tumor in sequential order. To date, no study of TNBC has exploredthe dynamic interplay over time between subsets of immune cells in and around the tumor and the expression of PD-L1 and other immunomodulatory proteins.
Nor have existing studies of the prognostic value of PD-L1 in TNBC considered the glycosylation status of this protein. PD-L1 is functional (able to interact with its receptor, PD1) only when it is glycosylated, and TNBCs have higher levels of glycosylated PD-L1 than other types of breast cancer do.49 If, as is likely, the spatial and temporal expression and functional status of PD-L1mediate its effects, then all previous studies on survival in TNBC and their discordant findings may have to be set aside in favor of more complex and informative studies that will explore how the timing, immune microenvironment, and glycosylation of PD-L1 influence its association with patient outcome.
CONFLICTS OF INTEREST
The authors declare that they have no conflicts of interest.


