INTRODUCTION
In the National Football League (NFL), the evaluation of athletic talent is a high stakes proposition. Considering that the NFL is approximately a $14 billion/year business, it is understandable that major efforts would be made to gain any advantage in predicting athlete performance.1 To date, no one has articulated a precise formula for who will become successful athletes. There are no prototypical quarterbacks, running backs, wide receivers, or tight ends. Though certain traits such as size, strength, and speed are valued and constantly assessed to the finest details, there is no consensus regarding predictive equations or recipes for the ideal football player.
Physical Traits and Abilities
Historically, when attempts have been made to forecast the future prowess of athletes in football, the emphasis has been placed largely on physical attributes.2 As such, teams have attempted to determine whether young athletes would become elite stars, in part, by measuring their time on the 40-yard dash and their strength on the bench press, among other physical abilities.2,3 Although these abilities may seem important, research to date has found limited relationships between performance on physical tests and subsequent performance in the NFL.2,3 Thus in the NFL, it appears that even though some athletes possess incredible physical gifts, they are unable to perform at a level consistent with these skills in real game situations. Conversely, there are football players with weaker performance on physical tests who excel in the game.
One possible contributing factor for this disconnect is that there are important differences between the physical ability tests and actual game play. For instance, players perform all physical ability tests while wearing track outfits rather than football equipment.2 Additionally, on the 40-yard dash, players start their sprints in a track stance and run untouched for the entire distance. While running is obviously an important part of football, NFL players perform this behavior wearing football equipment and against an opponent. Therefore, these kinds of physical tests do not fully assess the physical abilities needed on the field, leading to questions about the face validity of these tests.2 As such, it is understandable that many other factors continue to be considered in player selection and development.
Personality Assessment
In addition to physical measures, prediction of athletic performance may include elements of personality assessment. Commonly used personality assessments in sport include the Sixteen Personality Factor Questionnaire (16 PF), The Attentional and Interpersonal Style (TAIS) assessment, and DiSC profile. Measures of personality may be informative, but they also possess inherent limitations when used for selection purposes in sports. Most notably, many of these instruments are dependent on self-report. Therefore, the tests are only as accurate as the person’s willingness to respond truthfully and/or the accuracy of their self-perception. For instance, if recruits or potential draft picks are asked questions about their coachability, they are likely to answer items in ways that present themselves well to the coaching staff and team representatives. This frequently occurring phenomenon has been seen in many different fields, and is known as a self-presentation bias.4
A second constraint of personality assessment in competitive sports is that the constructs measured may fluctuate over time and across situations. Further, longitudinal research has shown that changes in personality tend to correlate with life satisfaction.5 For example, when an athlete grows up in poverty and later earns a multi-million dollar contract in the NFL, his ongoing adjustment to his new found life situation may affect the accurate measurement of his personality.
Assessment of Cognitive Skills
Measures of cognitive skills might appear more reliable and valid than the measures described above, because they require athletes to demonstrate their skills rather than rating themselves or having coaches or others rate them. However, such research has also been subject to its own limitations. For more than 40-years, sport psychologists have investigated the relationship between cognitive skills and athletic performance. For example, researchers have found that “expert” athletes typically process visual input more efficiently and effectively than novice athletes.6,7 Although such research is well-founded, the types of cognitive assessments used in some of these studies were not designed to distinguish underlying cognitive abilities from skills affected by direct experience in sports. For instance, some measures may utilize real-life football scenarios in their assessment of cognitive functioning, thereby creating an uneven playing field based on factors such as experience and general football knowledge. Differentiating learned knowledge and skills from fundamental cognitive capabilities is of critical importance because, it is the latter which enables athletes to perform and acquire sport-specific skills.8
If the distinction between cognitive capability and acquired skills is disregarded, it is possible that a physically gifted athlete with minimal coaching or experience in their sport would be considered a less promising prospect than a good (but not great) athlete who has received superior coaching. Without a measure that identifies the “raw” athlete’s ability to learn and process information, the scouts and coaches are forced to make an educated guess how this player will develop or how well they will be able to learn more sophisticated concepts pertaining to their sport. The expression frequently used in this scenario is called “upside.” Clearly, when assessing the athlete’s future upside, it is essential that aptitude is considered along with acquired knowledge.
During the time in which measures of intelligence have been paired to athletic ability, the conceptualization of intelligence has simultaneously undergone significant changes. Whereas intelligence was generally considered to be a singular general factor (“g”) 100-years ago, most current theories include multiple forms of intelligence.9
Among the most well-known of the current intellectual ability theories are Gardner’s theory of Multiple Intelligences, Sternberg’s Theory of Triarchic Intelligence, and the Cattell-Horn Carroll (CHC) Theory of Intelligence. Although each of these theories may have implications for the world of competitive sports, until recently, no theory had been tailored to specifically apply to this realm.
Presently, intelligence tests are under-utilized in the measurement of athletic talent. Further, the instruments that have been employed to date are limited in the information they provide. Perhaps the most well-known intelligence test used in sports is the wonderlic personnel test (WPT).10 Given its history of use with the military and businesses for decades, one might expect greater predictive validity in the NFL than has been demonstrated.11
During the 2020 NFL Scouting Combine, every NFL team considered the results of the Wonderlic test. Although this test is certainly expedient, comprised of 50 items and taking only 12-minutes to complete, it does not provide an in-depth analysis of cognitive abilities.12 In fact, it is largely composed of items measuring vocabulary, reading comprehension, and mthematical skills. Although performance on such tasks may predict performance in some fields,13,14 strengths in such academic areas have not shown predictive validity vis-a-vis aptitudes for learning skills and tactics in sports.11,15,16 The results of several research studies have indicated that scores from the Wonderlic test do not significantly predict outcomes of interest in sports (e.g., quarterback passer ratings, completions yards).17 Such findings have led some to conclude that intelligence is not an important factor in sports.18 Rather than ask whether intelligence is important in sports, a more important question may be, which intellectual abilities are important in sports?
Recently, several research papers have made a strong argument for the importance of perceptual/cognitive abilities in athlete performance.19,20,21 For instance, in a study by Faubert,22 it was determined that expert athletes were significantly better than amateur athletes and non-athletes in processing a non-sport-specific, complex dynamic visual scene. Based on the mounting research in this area, Zaichkowsky et al23 argue that the cognitive domain may in fact be the determining factor separating elite performers (i.e., “playmakers”) from non-elite performers. They further argue that the lack of a valid assessment instrument has limited identifying the importance of cognitive abilities.
In apparent recognition of the limited predictive validity of the Wonderlic test in football, the NFL recently agreed to the use of a newly developed player assessment test (PAT), which has been administered at the NFL Combine along with the Wonderlic since 2013. Reportedly, the PAT assesses learning styles, decision-making skills, responding to unexpected stimuli, and core intellect.24,25 Information about the exact content of the PAT is limited, possibly because the publishers wish to protect proprietary information. Although the constructs measured by this instrument would seem to be more relevant to play on the field, it remains unclear whether the PAT itself will provide increased predictive power in relation to outcomes in the NFL.
The Origin of the Athletic Intelligence Quotient
The athletic intelligence quotient (AIQ) was conceptualized by Dr. Scott Goldman and Dr. James Bowman during their doctoral studies in clinical and school psychology, specifically in intellectual ability assessment. The integration of the CHC Theory of Intelligence set the stage for its application to the population of athletes, where objective cognitive ability assessment was extremely limited. In their development of the AIQ, the authors consulted with experts in the fields of sports psychology and intellectual ability assessment, and ultimately established the first CHC Theory-based measure for the world of sports.
Cattell-Horn-Carroll Theory of Intelligence
In the field of intelligence testing, there are several competing theories of intellectual abilities. However, few of the existing theories of intelligence have obtained consistent empirical evidence for their foundational principles.26 According to multiple theorists and researchers, the theory of intelligence with the most supportive evidence is the CHC theory of cognitive abilities.9,27
Cattell-Horn-Carroll theory has been widely investigated and applied in various fields. Neurocognitive research has provided strong evidence for its factor structure. For instance, studies have noted activation of frontal-parietal areas, as well as components of the visual system for processing speed tasks.28 Additionally, developmental research has further established that the abilities identified remain consistent throughout the lifespan.
Considerable factor analytic research has also provided confirmatory evidence. Perhaps most notably, based on its strong empirical support, CHC theory has served as a foundation for significant revisions made to both intelligence tests and academic achievement tests.27 For instance, a review of changes made in current versions of the most commonly used intelligence tests (e.g., Wechsler Intelligence Scales for Children, 5th Edition, Stanford Binet Intelligence Scales, 5th Edition, Woodcock Johnson Tests of Cognitive Abilities, 4th Edition) reveals the addition of measures tapping abilities emphasized in CHC theory.
Previous research has established correlations between specific CHC abilities and occupational success in a wide range of occupations (e.g., architect, pilot, lawyer, accountant, etc.). To date, however, CHC theory has not been applied to the measurement of cognitive abilities and processes considered essential in elite athletes. One of the benefits of applying this theory to the domain of sports is that it provides a standard language that researchers, theorists, coaches, and athletes can use to discuss the cognitive strengths and weaknesses of athletes. Even more importantly, however, is that by using CHC theory as a framework, there is an existing evidence base for conclusions drawn about athletes’ specific cognitive strengths and weaknesses. Therefore, these conclusions can be drawn with confidence. For instance, research into CHC abilities has demonstrated that individuals with strong visual spatial processing skills are more likely to be successful as pilots or engineers.29,30 In a similar way, individuals with more accumulated verbal knowledge (i.e., crystallized intelligence) are likely to experience greater success as professors, scientists, and lawyers.31,32
It has been proposed that the CHC theory includes between 15-20 broad intellectual or cognitive abilities, which are each comprised of several narrow abilities. The interested reader may refer to Schneider and McGrew for more details.9 Based on the CHC theory of intelligence, there appear to be several specific intellectual abilities directly related to athletic performance.
Athletic Intelligence Defined
Given the high stakes of talent identification and development, the limitations of existing measures, and the considerable evidence base for the CHC theory in other fields, the investigators sought to create a test that would measure the specific cognitive abilities involved in competitive athletics, namely the AIQ. In line with the tenets of CHC theory, athletic intelligence is defined as those abilities that enable athletes to optimally visualize their surroundings in real time, learn and recall game information fluently, react quickly and accurately to stimuli, and sustain rapid decision-making for extended periods. Thus, Athletic Intelligence (AI) is a highly specialized subset of previously identified and validated broad CHC abilities, namely visual spatial processing (Gv), Learning efficiency (Gl), Reaction time (Gt), and Processing speed (Gs) (Figure 1). In the following section, each of the broad and narrow cognitive abilities measured by the AIQ is defined and its relationships to real-life athletic performance is explained.
Figure 1. AIQ Broad and Narrow CHC Abilities
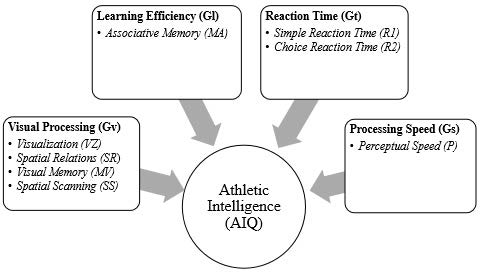
Visual processing: Visual Processing (Gv) has been defined as the ability to generate, perceive, analyze, synthesize, manipulate, transform, and think with visual patterns and stimuli.33 These abilities are typically measured by tasks that require the perception and manipulation of visual shapes and forms, usually of a figural or geometric nature (e.g., a standard block design task). Someone who is strong in visual processing would be better able to mentally reverse and rotate objects effectively, interpret how objects change as they move through space, perceive and manipulate spatial configurations, and maintain spatial orientation. According to Flanagan et al,33 visual processing comprises at least eleven narrow cognitive abilities. After careful review of each of these narrow abilities, it was determined that at least four of these abilities would play meaningful roles for elite athletes, as described below. Of note is that in standard intelligence quotient (IQ) tests, visual spatial processing tasks are not necessarily speeded. However, given that elite sports require the processing of visual information in real-time, it was determined that each of the measures of Gv would have a speeded component.
Visualization: Visualization (VZ) has been defined as the ability to manipulate objects or visual patterns mentally and see how they would appear under altered conditions. In intelligence testing, a task that would measure this ability might require an examinee to view a visual image and then draw how the image would look upside down.
In sports, this ability would come into play when a basketball player studies particular offensive sets of the other team (e.g., triangle offense) on paper and then recognizes the particular set in action.
Visual memory: Visual memory (MV) has been defined as the ability to form and store a mental representation or image of a visual stimulus and then recognize or recall it later. A task that would measure this ability would be one in which an examinee would be required to either reproduce or recognize a previously presented stimulus or pattern. This ability would likely be important for a soccer players, for example, who need to keep a visual image of their target in mind when striking the ball, because simply looking up alters their body position, which negatively impacts the aim and direction of the shot.
Spatial scanning: Spatial scanning (SS) has been defined as the ability to survey a spatial field or pattern accurately and quickly and identify a path through that visual field. This ability can be measured by presenting an examinee with a series of increasingly difficult mazes to complete within a specified time period. In rugby, this ability would help a player identify running lanes on the pitch for himself/herself and a teammate, to help determine when to pass the ball.
Learning efficiency: This broad cognitive ability has been defined as the capacity to store information (e.g., concepts, ideas, items, or names) in long-term memory and to retrieve it later, fluently, through association. Learning efficiency (Gi) is thought to play a significant role in learning. This ability differs from others in that the focus is on how well information is initially stored and later retrieved from long-term memory, rather than on the content of what is being stored. In terms of performance outcomes in sports, it was believed that learning efficiency would play a critical role. Of the thirteen narrow abilities identified by Flanagan et al,33 one in particular is thought to be intricately involved in athlete’s performance.
Associative memory: Associative memory (MA) has been defined as the ability to recall one part of a previously learned but unrelated pair of items when the other is presented (i.e., paired-associative learning). An example of a task that measures this ability is one in which visual stimuli is paired with nonsense words and examinees are required to recall the nonsense word that had been paired with a particular visual stimulus. This ability would prove important when a football player must quickly translate a play called by the quarterback into a clear memory of what the play is (e.g., Ace Rt. 60=4 verticals; Deuces Left 25=Smash Concept, which consists of two routes, run on the same side of the field, to stress zone coverage with paired high-low routes).
Reaction time: Reaction time (Gt) has been defined as the ability to react and/or make decisions quickly in response to simple stimuli.33 These abilities are typically measured by chronometric measures of reaction and inspection time. According to Flanagan, Ortiz, and Alfonso,26 Gt comprises at least five narrow cognitive abilities.
After careful review of each of these narrow abilities, it was posited that two of them would likely play meaningful roles for athletes. In the following section, these narrow abilities are defined and their potential importance in actual game situations is illustrated.
Simple reaction time: Simple reaction time (RI) has been defined as the latency period (in milliseconds) of a response to a single stimulus (visual or auditory) presented at a particular point of time. This ability would be important in any situation where an athlete would be required to respond immediately and accurately to the presentation of a stimulus. For example, in competitive swimming, this ability might give certain swimmers an edge in reacting swiftly to the starter.
Choice reaction time: Unlike simple reaction time, choice reaction time (R2) requires the accurate and immediate processing of one stimulus in a series of two or more stimuli, depending on which is signaled. In baseball, this ability is essential for hitters who must quickly decide whether or not to swing at an incoming pitch. The ability to react immediately and potentially inhibit a response if necessary is crucial in this scenario.
Processing speed: Although its name may sound similar to reaction time, processing speed (Gs) is a unique broad cognitive ability. Specifically, this ability involves performing cognitive tasks fluently and automatically, especially when under pressure to maintain focused attention and concentration. That is, processing speed is not simply the amount of time necessary to respond following the presentation of a stimulus or stimuli, but the sustained and rapid processing of information during familiar or simple tasks. For instance, it may involve quickly scanning a visual field for targets and/or comparing information. Of the four narrow abilities considered to make up the broad ability of processing speed, it is believed that one of these abilities would specifically play an important role in athletic performance.
Perceptual speed (P): This narrow ability is defined as the ability to search for and compare visual stimuli rapidly when presented side by-side. A task that would measure this ability might involve an examinee rapidly scanning a series of symbols to determine whether one of two target stimuli is present. Such an ability would play a key role in hockey, where continuous monitoring of the location of teammates and opponents is critical.
Development of the athletic intelligence quotient: Prior to standardization, there were three phases of item and subtest development. The items and subtests for the AIQ were influenced by existing and previous versions of measures that have been reliably demonstrated to measure specific narrow abilities outlined in CHC theory. The test and item development process was guided by consultation with experts in the field of intellectual ability assessment and sport psychology. Once the test was developed, it was initially administered to a sample of 20 adults in paper and pencil form, to adjust the levels of difficulty. Once the initial version of the AIQ software program was completed, each subtest was administered to a pilot sample of 25 soccer players from an under 18 (U-18) league in the Southwest. Items were analyzed based on the number of athletes who scored correctly or incorrectly, and specific items were removed or modified as a result. Next, the AIQ was administered to a larger sample of 93 NFL prospects at the 2012 NFL Scouting Combine as part of a pilot investigation. Initial reliability and factor analyses were conducted. Subtests found to have inadequate reliability were removed from the AIQ. Subtests that evidenced exceptionally high reliabilities were adjusted to include fewer items or to have a shorter time limit.
After reviewing the evidence from the pilot studies, a standardized edition of the AIQ was finalized in December of 2012. The goal of the sampling procedure for the normative group was to approximate the population of elite athletes in sports. Data were initially obtained from a sample of 299 athletes in Major Division I NCAA Conference Programs. In accordance with requirements for the protection of research participants, informed consent was obtained from the athletes prior to their participating. Although the initial normative sample was sufficiently large to draw valid conclusions about athletes assessed, Athletic Intelligence Measures, LLC has continued to add to the normative sample. Such ongoing norm development is not typical for paper-and-pencil batteries, but has been done in order to ensure even greater stability of the normative set. The normative sample presently includes more than 6,000 elite athletes from professional sports leagues (e.g., NFL, MLB, NBA, NHL, MLS), Olympic athletes, and athletes from major Division I NCAA programs
METHOD
Participants
One hundred and forty-six NFL prospects were administered the AIQ at the 2015 and 2016 NFL Scouting Combine, prior to being drafted in the NFL. The following position players were included in this study: running back, wide receiver, defensive lineman, linebacker, and defensive back. Participation in the study was voluntary. The participants’ consent was obtained pursuant to NFL evaluation procedures, with Institutional Review Board (IRB) approval not required.
Instruments
Athletic intelligence quotient: The AIQ is a measure of cognitive ability composed of 10 subtests (Table 1 for subtest descriptions and reliability coefficients). It is individually-administered by a software program on the Samsung Galaxy tab, running the Android Operating System. Subtests are presented in a fixed, successive order, with audio/visual instructions provided before the start of each task. The administration time for the AIQ generally ranges from 35-38-minutes. See the AIQ Professional Manual for additional information about each subtest and factor.34
| Table 1. AIQ Subtest Descriptions |
|
Subtest
|
CHC Narrow/Broad Ability |
Reliability |
Description |
| Shape rotations |
Visualization/ Visual Spatial Processing |
0.77 Test-re-test |
Measures the ability to mentally rotate shapes in one’s mind and see how they would look under different circumstances. In particular, examinees are presented with a given target shape and they must decide whether the shapes below it are the same (only rotated) or are different and would need to flipped over to look the same. |
|
Paired associative learning
|
Associative Memory/ Learning Efficiency |
0.91 Internal consistency |
Assesses the ability to form a mental link between random stimuli. In particular, the examinees are presented with 16 pictures that have been paired with random two-digit numbers. They are shown each pair for 2 seconds before having to provide the missing two-digit numbers when presented with the pictures alone. This procedure is then repeated for a two additional trials. |
| Object scanning |
Perceptual Speed/ Processing Speed |
0.81 Test-re-test |
A cancellation task measuring the ability to quickly scan a visual field to locate 3 target shapes among both targets and distractors.
|
|
Route finding
|
Spatial Scanning/ Visual Spatial Processing |
0.57 Test-re-test |
Assesses the ability to find the shortest route between two locations as quickly as possible, while having to avoid obstacles. |
| Simple reaction time |
Simple Reaction Time/ Reaction Time |
0.79 Internal consistency |
Examinees are instructed to press a button as fast as possible after a stimulus (i.e., square) appears on the screen. When the response key is pressed, the square disappears from the screen. If the response key is not pressed within 1,000ms of the presentation of the square, it will automatically disappear. The time between presentations of the square (viz., interstimulus interval) varies between 500 and 2000 ms. The subtest scores are based on both speed and accuracy, with omissions and commissions resulting in lower accuracy scores.
|
|
Memory for shapes
|
Visual Memory/ Visual Spatial Processing |
0.90 Internal consistency |
Assesses visual memory by asking examinees to study an array of 16 shapes. Next, the examinees are presented with each of the original shapes, but they are out of order on the bottom of the screen. They must then drag the shapes to their correct locations. |
|
Number matching
|
Perceptual Speed/ Processing Speed |
0.81 Test-re-test |
On this task, two multi-digit numbers are presented side-by-side on the screen. The examinee must indicate whether the two numbers are the same or not. The examinee has two minutes to make as many comparisons as possible.
|
| Choice reaction rime |
Choice Reaction Time/ Reaction Time |
0.77 Internal consistency |
Assesses reaction time and detectability by presenting two target stimuli and three distracter stimuli in random order. The examinee must press the response key as quickly as possible when presented with one of the two target stimuli, but must refrain from pressing the key when any of the three distracters are presented. If the response key is pressed, the image is removed. If the key is not pressed, the image disappears after 1,000ms. Again, the resulting subtest scores are based on both speed and accuracy, with omissions and commissions resulting in lower accuracy scores. |
| Design matching |
Spatial Relations/ Visual Spatial Processing |
0.84 Test-re-test |
Examinees are shown a design at the top of the screen and they must replicate the design by touching empty boxes until each one matches the stimulus.
|
| Paired associative learning–delayed |
Associative Memory/ Learning Efficiency |
0.83 Internal consistency |
This subtest is administered approximately 30 minutes after the first paired associative learning task is given. It assesses the examinee’s ability to recall the information learned from the three previous trials.
|
Procedures
The assessment protocol was briefly described before participants were asked to provide informed consent, which included their express right to discontinue responding to assessment questions at any time. When the athletes arrived at the evaluation room, they were individually led to the testing station by a trained administrator who briefly explained the testing procedures. Next, an examiner initiated the computer program for the participants and presented them with headphones for audio instructions.
Reliability Evidence
Two sources of reliability are important for an intellectual ability measure, such as the AIQ. They are internal consistency and testretest reliability.35 The initial normative set was examined for the internal consistency analyses (N=300), while a subgroup was examined to determine test-retest reliability (N=48). Internal consistency was judged to be appropriate to estimate the reliability for the subtests in which every athlete saw all items (viz., untimed tasks). Thus, estimates of reliability for timed subtests were determined via test-retest analyses. For the initial normative sample, internal consistency was moderate to high, with alpha coefficients ranging from 0.77 to 0.91 (Table 1).
Test-retest reliability was examined for a normative subsample. This form of reliability was conducted for the subtests that involved a time limit, wherein the examinees would see different numbers of items depending on how quickly they responded. The intraclass correlation coefficients across these subtests ranged from 0.57 to 0.84 (3-6-month interval), with most reliability coefficients falling in the acceptable range (Table 1). Of note is that test-retest reliability coefficients for heavily speeded tasks tend to be lower-bound estimates of a test’s true reliability.35
Validity Evidence
An important goal in the development of the AIQ was to ensure that the items and subtests adequately sampled the specific aspects of athletic intelligence that the test is intended to measure. In particular, the items and subtests assess a range of cognitive abilities, including visual-spatial processing, learning efficiency, processing speed, and reaction time. As described earlier, comprehensive literature reviews were conducted, and experts in the field were consulted in the development of the AIQ. Additionally, the theoretical rationale that guided item and subtest development has been explained (viz., CHC Theory).
In line with Cattell-Horn-Carroll Theory, two a priori hypotheses were made regarding the intercorrelations that would be found among the subtests and composites of the AIQ. First, because all subtests were designed to measure CHC cognitive abilities, we expected there would be correlations among the subtests, with the reaction time measures having the lowest correlations with other subtests. This is in fact what we found.
The second hypothesis was that the subtests that are subsumed by a specific composite (e.g., visual spatial processing, learning efficiency, reaction time and processing speed) would have stronger correlations with each other than with the subtests that compose other scales. For instance, the correlation between the Shape Rotations and Block Design subtests (two measures of visual spatial processing) would be expected to have stronger correlations than between either of these subtests and any of the learning efficiency, reaction time, or processing speed subtests (e.g., paired associative learning, simple reaction time, or number matching). In fact, all subtests were found to correlate the strongest with other subtests from the same composite, rather than subtests from other composites. The only exception to this finding is the memory for shapes subtest, a measure of visual memory. According to current research in CHC Theory, the narrow ability of visual memory may be considered a visual-spatial processing ability; however, it has also been found to correlate strongly with measures of memory.26
To further consolidate our results, we ran a confirmatory factor analysis on our developmental sample of 299 Division I athletes. This analysis yielded three factors with eigenvalues greater than 1, but a scree plot that suggested a four-factor solution that was consistent with the theory above. Goodness of fit measures suggested that our model fit was good (CFA=0.98; TLI=0.96; and RMSEA=0.048). As such, we felt very confident with our model, which was consistent with both a priori hypotheses and our CFA. Initial concurrent validity evidence for the AIQ was established through a study in which athletes’ scores were compared to obtained scores on the Wonderlic Personnel test and the ImPACT test.36 The participants in this study included 93 Division 1 NCAA Men’s Lacrosse, Men’s Soccer, and Women’s Soccer players attending a northeast university.37 Significant correlations were found between the Visual Spatial Processing and Learning Efficiency factors of the AIQ and the total score on the Wonderlic test. Significant correlations were also found in expected directions between composites of the ImPACT and factors on the AIQ. For instance, the AIQ reaction time and processing speed factors correlated significantly with the ImPACT reaction time composite. These findings demonstrate concurrent validity.
After these initial reliability and validity studies were conducted, research was undertaken to specifically examine the predictive validity of the AIQ with respect to performance outcomes in professional baseball.38 In this study, scores on the AIQ were obtained from 149 Minor League Baseball (MiLB) players prior to the 2014 baseball season and their subsequent performance was assessed through traditional and newly emphasized baseball statistics (“sabermetrics”). Based on hierarchical multiple regression analyses, statistically significant relationships were found between AIQ factor scores and important hitting and pitching statistics, after controlling for other variables.
The following is a recent study conducted with National Football League prospects. The purpose of this study was to further establish the validity of the AIQ for use with athletes by examining its efficacy in predicting outcomes in the NFL.
Hypotheses
Based on the results of previous research on tasks measuring CHC abilities, it was hypothesized that athletes’ scores on the AIQ would be significantly correlated with outcomes of interest in the NFL. Additionally, it was hypothesized that the four factors of the AIQ would account for a statistically significant increase in the explanation of variance beyond draft pick. Draft pick was chosen as the independent variable to control for, because ostensibly, the athlete’s pick in the draft represents the player’s estimated value based on the combination of multiple factors (e.g., strength, speed, size, scouting reports, personality, etc.). As such, it was considered important that the AIQ be able to improve predictive power beyond these variables as measured by draft pick.
Data Analysis Plan
Using IBM® Statistical Package for the Social Sciences (SPSS) Statistics Version 23, hierarchical multiple regression analyses and zero-order correlations were conducted between the athletes’ AIQ scores and specific statistics in the game (e.g., receiving yards, interceptions, etc.). For each analysis, we first controlled for draft pick number in step 1, to demonstrate that the AIQ has predictive value above and beyond the effect of the usual decision matrix used in selecting athletes.
We then entered the four factors of the AIQ in the second step. All regression analyses were evaluated for residuals and collinearity, but none were found. Bootstrapping techniques were applied to augment the reported findings, due to low N as a function of specific analyses targeting specific positions, and all of these findings were consistent with the initial regression findings.
For each analysis, we have elected to report all first order correlations for the AIQ measures with any of the outcome variables assessed. We also chose to report squared semi-partial correlations to indicate the unique effect of each variable, termed the variable’s “usefulness”.39 The regression statistics for R2 change and overall R2 are reported for each regression as well. Residual plots and collinearity statistics were evaluated for violation of assumptions when using regression; no violations were found.
RESULTS
Analyses
Starting at the broadest level, the four subscales of the AIQ; Gv, Gt, Gs, and Gi, were regressed on estimates of career approximate value (CAV), which is a statistic created by the founder of profootballreference.com, Doug Drinen, to put a single number on the seasonal value of a player at any position.40 This regression yielded an overall significant model; F(5,140)=5.94, p<0.05; explaining 17.5% of the overall variance in CAV. As shown in Table 2, along with the other aspects of the regression, two of the four subscales, Gt and Gs, showed overall positive zero-order correlations. After controlling for the draft pick number; itself a significant predictor, F(1,144)=19.36, p<0.001 1; the inclusion of the four AIQ subscales added an additional 6% of explained variance; F(4,140)=2.40, p=0.05, with Gt still contributing a significant and unique portion of the variation. Gt was positively related to CAV, above and beyond the usual metrics associated with a draft pick, sr2 =0.19.
| Table 2. Zero-Order Correlations Between Football Performance Measures and Four AIQ Factors Overall and by Position |
|
Position
|
Performance Measure |
FS-AIQ |
Gv |
Gt |
Gs |
Gi |
| All Players (N=146) |
CAV |
0.06 |
0.09 |
0.24** |
0.14* |
0.03
|
|
Draft Pick
|
0.08 |
0.11† |
-0.06 |
-0.01 |
0.07 |
| Defensive Linemen (N=32) |
Sacks |
|
0.02 |
0.44** |
-0.01 |
0.13
|
|
Tackles
|
|
0.14 |
0.34* |
0.13 |
0.27† |
|
Linebackers (N=28)
|
Sacks |
|
-0.25† |
-0.03 |
-0.25† |
-0.39*
|
|
Interceptions
|
|
-0.09 |
0.24 |
-0.06 |
-0.06 |
| Tackles |
|
-0.18 |
0.38* |
-0.25† |
-0.18
|
|
Defensive Backs (N=35)
|
Interceptions
|
|
0.21 |
0.10 |
0.17 |
0.09 |
| Tackles |
|
-0.02 |
-0.04 |
0.17 |
-0.14
|
|
Running Backs (N=18)
|
Rushing yards |
|
0.29 |
-0.24 |
0.15 |
-0.26 |
| Wide Receivers (N=27) |
Receptions |
|
-0.37* |
0.05 |
-0.06 |
-0.33*
|
| †p<0.10, *p<0.05, **p<0.01, ***p<0.001 |
While CAV appears to be a good overall metric that allows coaches and others to compare athletes across positions, it is also the case that there are specific metrics that better capture performance for particular positions. To that end, we then ran a series of regressions using the same predictor variables across several metrics, loosely grouped by offense and defense, aligned with specific positions. For example, it made more sense to assess sacks per game for defensive linemen and rushing yards for running backs.
Starting with the defensive metrics, we examined sacks per game in separate regressions for defensive linemen and linebackers. None of the regression analyses involving sacks yielded significant results with the proposed model. However, sacks per game did show a positive zero order correlation for Gt among defensive linemen, r(30)=0.44, p=0.006. This effect, though only marginally significant due to sample size, represents a medium to large effect size, providing unique contribution after controlling for draft pick number, sr2 =0.31, p=0.07, suggesting that across a greater number of players, this relationship would have greater support (Table 3).
| Table 3. Hierarchical Regression for Defensive Players on Football Metrics for Draft Pick Position and Four AIQ Factors |
|
Position
|
Measure
|
Sacks per Game
|
Interceptions
|
Tackles per Game
|
| ∆R2 |
Overall R2 |
sr2 |
∆R2 |
Overall R2 |
sr2 |
∆R2 |
Overall R2 |
sr2
|
| Defensive Linemen (N=32) |
Step 1
|
0.17* |
0.17* |
|
|
|
|
0.22** |
0.22** |
|
|
Pick
|
|
|
-0.42* |
|
|
|
|
|
-0.47** |
| Step 2 |
0.11 |
0.28† |
|
|
|
|
0.05 |
0.27 |
|
|
Gv
|
|
|
-0.01 |
|
|
|
|
|
0.08 |
| Gt |
|
|
0.31† |
|
|
|
|
|
0.12
|
|
Gs
|
|
|
-0.15 |
|
|
|
|
|
-0.07 |
| Gl |
|
|
0.05 |
|
|
|
|
|
0.15
|
|
Linebackers (N=28)
|
Step 1
|
0.34*** |
0.34*** |
|
0.12† |
0.12† |
|
0.43*** |
0.43*** |
|
| Pick |
|
|
0.59* |
|
|
-0.34† |
|
|
-0.66***
|
|
Step 2
|
0.08 |
0.42 |
|
0.03 |
0.15 |
|
0.05 |
0.48** |
|
| Gv |
|
|
0.09 |
|
|
|
|
|
|
|
Gt
|
|
|
0.19 |
|
|
|
|
|
|
| Gs |
|
|
0.09 |
|
|
|
|
|
|
|
Gl
|
|
|
-0.18 |
|
|
|
|
|
|
|
Defensive Backs (N=35)
|
Step 1 |
|
|
|
0.05 |
0.05 |
|
0.19** |
0.19** |
|
|
Pick
|
|
|
|
|
|
-0.23 |
|
|
0.44** |
| Step 2 |
|
|
|
0.04 |
0.10 |
|
0.07 |
0.26† |
|
|
Gv
|
|
|
|
|
|
0.12 |
|
|
-0.10 |
| Gt |
|
|
|
|
|
0.07 |
|
|
0.06
|
|
Gs
|
|
|
|
|
|
0.06 |
|
|
0 .16 |
| Gl |
|
|
|
|
|
-0.02 |
|
|
-0.19
|
| †p<0.10, *p<0.05, **p<0.01, ***p<0.001 |
Next, we examined tackles per game for defensive linemen, linebackers, and defensive backs. Tackles per game showed statistically significant and positive zero- order correlation for Gt among linebackers, r (25)=0.34, p=0.04, and for defensive linemen, r(30)=0.34, p=0.03. These effects did not provide a unique contribution after controlling for pick number, which was also significant in the analysis of tackles, suggesting that the usual metrics may capture that component of executive functioning to some degree. However, this overlap also suggests convergence between the data used for selecting NFL players (e.g., scouting reports, game film, etc.) and the reaction time factor on the AIQ.
There was no such relationship when analyzing tackles among the defensive backs, suggesting that there may be a different skill set required for athletes who play these positions. For the last analyses of defensive players, we examined interceptions per game for linebackers and defensive backs, but found no significant results for regression or correlational analyses. Switching to offensively focused metrics, we only considered the positions of running back and wide receiver; unfortunately, we did not have enough quarterbacks for a meaningful analysis among players in that position. Thus, we examined rushing yards per game for running backs and receptions per game for wide receivers.
Rushing yards did not have any zero order correlations for the running backs; however, after controlling for draft pick number, the four AIQ subscales predicted an additional 45% of the variance, F change (4,12) =7.77, p=0.002. This finding does need to be interpreted with some caution since the number of running backs is somewhat small (N=18), leading to the possibility of a somewhat over-determined model.
Receptions per game revealed significant negative zero order correlations for Gv; r(25)=-0.37, p=0.03; and Gl; r(25)=- 0.32, p=0.05 for wide receivers. However, both of these relationships did not bear out in the subsequent regression controlling for draft pick number. Although the second step of the regression analysis for receptions did not achieve significance, there was a statistically significant and positive relationship between reaction time and receptions per game after controlling for draft pick number, sr2 =0.36, p<0.05 (Table 4).
| Table 4. Hierarchical Regression for Offensive Players on Football Metrics for Draft Pick Position and Four AIQ Factors |
|
Position
|
Measure
|
Rushing Yards per Game
|
| ∆R2 |
Overall R2 |
sr2
|
|
Running Backs (N=18)
|
Step 1
|
0.38** |
0.38** |
|
| Pick |
|
|
-0.62**
|
|
Step 2
|
0.45** |
0.83*** |
|
| Gv |
|
|
0.31*
|
|
Gt
|
|
|
-0.22† |
| Gs |
|
|
0.23†
|
|
Gl
|
|
|
-0.55*** |
|
Wide Receivers (N=27)
|
Step 1 |
0.27** |
0.27** |
|
|
Pick
|
|
|
-0.52** |
| Step 2 |
0.15 |
0.42* |
|
|
Gv
|
|
|
-0.13 |
| Gt |
|
|
0.36*
|
|
Gs
|
|
|
-0.14 |
| Gl |
|
|
-0.10
|
| †p<0.10, *p<0.05, **p<0.01, ***p<0.001 |
DISCUSSION AND CONCLUSION
Previous research has demonstrated limitations in the predictive validity of physical tests, personality assessments, and existing cognitive measures in relation to outcomes in the NFL. The current research sought to provide a basis for improving the selection and development process by including state of the art cognitive assessment based upon the CHC theory of intelligence. To that end, specific aspects of cognitive functioning were predictive of overall success in the NFL (i.e., CAV), with AIQ factors explaining 17.5% of the overall variance in CAV and 6% of the variance in CAV after controlling for draft pick.
Additionally, analyses with specific positions yielded statistically significant findings. For defensive linemen, the reaction time factor of the AIQ was significantly and positively correlated with sacks per game. This relationship retained marginal significance even after controlling for draft pick. This finding highlights the importance of defensive linemen reacting immediately to the ball being hiked, in order to pressure the quarterback. Reaction time was also significantly and positively correlated with tackles per game for defensive linemen and linebackers. Although these correlations did not retain significance after controlling for draft pick, it appears that for defensive linemen and linebackers, there is convergence between AIQ reaction time performance and other draft selection criteria (e.g., game film, etc.)
With respect to the analyses of offensive players, the four factors of the AIQ provided a statistically significant increase in the prediction of rushing yards per game, accounting for 45% of the variance beyond draft pick. This finding suggests that the measurement of specific cognitive factors accounts for rushing yards beyond other factors considered for the NFL draft.
Interesting relationships between the AIQ factors and rushing yards per game emerged when the regression analysis was deconstructed. Visual-spatial processing displayed a significant positive relationship with rushing yards per game. Considering the requirements of the position, this finding makes intuitive sense. A running back needs to process the spatial properties between himself, the offensive linemen, and running lanes to identify the optimal path for each rushing play. By contrast, learning efficiency was inversely related to rushing yards per game. Although this may seem counter-intuitive, the running back position is considered among those requiring lesser cognitive demands and thus may not require the same in-depth learning that other positions (e.g., quarterback) may require.17
The relationships between certain AIQ factors and receiving statistics were also not always in the expected direction, but a notable pattern emerged. For instance, wide receivers who scored higher in reaction time, but lower on measures of visual spatial processing and learning efficiency tended to have more receptions. Although these findings, too, may seem surprising, there is some basis for understanding this pattern.
Like running backs, the position of wide receiver is often considered to be among those that involve greater physical requirements and lesser cognitive demands.17 Reaction time, however, would seem to be a cognitive ability with a meaningful connection to game play for wide receivers. That is, a faster reaction time would likely contribute to a receiver’s ability to raise his hands to secure a pass or react to a pass thrown before he has turned to face the quarterback. Although the overall correlation between reaction time and receptions per game was not statistically significant, this relationship achieved significance once other factors were controlled. It is also worth noting that the interpretations above are all based upon significance tests which assume access to a large enough sample size. The current data is from a highly selective population and it is worth considering not just the significance of the correlations, but also the magnitude or effect size of the correlations. An examination of Table 2 suggests that a number of the key metrics in evaluating effective play are captured by the AIQ, certainly in the cases where the zero-order correlations exceed or are close to 0.30 or higher. Taken as a whole, this suggests that the AIQ offers additional value above and beyond the usual evaluations of players. Given implied restricted range of performance in professional athletes, it is likely that the AIQ would demonstrate even greater predictive power if were applied to a wider range of ability, such as at the college-level or even high school-level.
As with all studies, there were limitations. The current sample relied solely on draft pick, football statistics, and the cognitive measures assessed in the AIQ. The variance predicted by these measures appears to be higher than that of previous efforts to predict performance based upon cognitive assessment, but without a direct comparison within the sample, it is impossible to assert definitively that one set of cognitive measures is significantly better than another. Further, the inclusion of other measures, such as physical capabilities and personality may also capture some of the variance explained by the AIQ measures in the sample. Conversely, by holding some of these other factors constant, it is possible that more significant findings could be found with the AIQ.
Finally, with respect to the statistical analyses conducted, sample size limitations in this initial study precluded inclusion of multiple testing adjustments. Future research should look to replicate and extend the findings from this study, particularly with a focus on cognitive assessment. With a good deal of the variance in performance still unexplained, there is considerable room for developing a model with even greater predictability. Additionally, with a larger data set, it would be possible to include more positions and examine the relationships among cognitive abilities and other performance statistics in the NFL (e.g., quarterback passer rating, position rankings). Such research is currently underway by the investigators. Further, including a wider range of measures offers the possibility of either consolidation of predictive power or greater predictive power, depending on how much overlap exists between the various domains of performance, personality, and cognitive factors. It also would be possible to compare which subtests of the AIQ yield the most utility in making predictions (as opposed to the 4 broad factors). This could help tailor assessments to specific positions, as certain intellectual abilities may be more or less critical depending on the position and its associated cognitive demands.17
Ultimately, even though the prospect of identifying prototypical football athletes is likely to remain elusive, the current findings suggest that the measurement of specific cognitive abilities contributes to a better understanding of performance outcomes in football. Therefore, as teams work to strategically draft and develop players in this high- stakes game, it would appear that improved understanding of players’ athletic intelligence would be advantageous.
CONFLICTS OF INTEREST
In addition to his work as a School Psychologist for the Great Neck Public Schools, James Bowman, Psy.D. is a co-creator of the AIQ and proprietor of Athletic Intelligence Measures, LLC (AIM, LLC). Scott Goldman, Ph.D. is a Sport Psychologist for the Detroit Lions of the NFL, as well as a co-creator of the AIQ and proprietor of AIM, LLC. Alex Auerbach is a Sport Psychologist and consultant for AIM, LLC. As such, there may be a perceived conflict of interest.


