INTRODUCTION
The liver is a primary metastatic site for several cancers including uveal melanoma (UM).1,2 Despite effective, prompt local control of the primary tumor, 50% of UM patients still develop liver metastasis. This is due to early hematogenous dissemination of cancer cells (micrometastases) to the liver prior to diagnosis of primary ocular disease.3,4,5 Micrometastases may remain dormant for years. Even with current advances in therapeutic options for cutaneous melanoma, there are no proven therapies for metastatic UM. Metastatic UM patients have a 1-year overall mortality rate of 85%, and 2-year overall of 92%.
Current efforts in the UM field focus on inherent properties of the tumor independent of tumor location.6,7,8 However, the interaction of tumor cells with the hepatic microenvironment may determine the metastasis’ fate, whether growth is promoted or suppressed. Using an established orthotopic xenograft model9 we recently demonstrated in vivo an increase in metastatic UM clearance in the liver by augmentation of the natural killer (NK)-cell population by triggering the Toll-like Receptor 5 signaling agonist entolimod. This study provided pre-clinical evidence of the efficacy of modulation of the microenvironment against liver metastases.10
We hypothesized that interaction with the host liver microenvironment plays a role in shaping UM tumor properties, leading to tumor survival and growth. It has been shown that p53 mutations are infrequent in UM11 compared to other cancers.12 These findings have not yet been studied in-depth in an orthotopic xenograft system. In our study, we sought to further characterize the changes that take place in metastatic UM after interaction with the liver microenvironment.
In support of our hypothesis, we discovered differences between UM cells prior to inoculation and after seeding into the liver microenvironment in our orthotopic xenograft. We validated these findings by examination of a cohort of samples taken post mortem from the liver of a patient with metastatic UM. Our work revealed that the TP53-MDM2 signaling axis is de-regulated in metastatic UM. Despite overexpression of MDM2, inhibition with Nutlin-3a did not decrease cellular proliferation. However, the sirtuin inhibitor and transcriptional activator of the TP53 signaling, Tenovin-6, increased the percentage of apoptotic cells in UM primary and metastatic cell lines, increased acetylation of p53 while reducing ubiquitination of the protein, and acted as a cell cycle regulator.
METHODS
Cell Lines and in Vitro Cell Culture
Established human UM cell lines derived from primary (Mel 270, Mel 290) and metastatic tissue (OMM 2.5) were kindly given by Dr. Bruce Ksander (Schepens Eye Research Institute, Boston, MA, USA; Massachusetts Eye and Ear, Boston, MA, USA) to HEG and cultured at a cell density of 1.0×10⁵ cells per well. The next day, cells were harvested and supernatants collected for cytokine secretion assays. Routinely, cells were cultured in UM media, as described.9 Cell lines were treated with Hepatocyte Growth Factor (20 ng/mL, Peprotech, Rocky Hill, NJ, USA), Nutlin-3a (PubChem CID: 11433190, CalBioChem, EMD Millipore, San Diego, CA, USA), and Tenovin-6 (PubChem CID: 24772043, ChemCruz™, Santa Cruz Biotechnology, Inc., Santa Cruz, CA, USA) at different concentrations ranging from 0.1 μM-5.0 μM.
Orthotopic Xenograft Model
All experiments were conducted according to the Declaration of Helsinki and Guiding Principles in the Care and Use of Animals conform to the Association for Research in Vision and Ophthalmology (ARVO) for animal use in ophthalmic and vision research, the Institutional Animal Care and Use Committee at Emory University and adherence to the National Institutes of Health (NIH) guide for the care and use of laboratory animals. Details of the orthotopic xenograft model are published.9 Briefly, mice were anesthetized with ketamine and xylazine (45 and 4.5 μg/g, respectively) prior to inoculation with 1.0×10⁶ cells in a 2.5 μL final volume into the choroid. The inoculated eye was enucleated 7-days after inoculation. Mice were sacrificed 5-weeks after enucleation. Liver and spleen tissues were removed.
Liver Tissue
The UTHSC Institutional Review Board (IRB) approved the present study, which aimed at molecular and genomic investigation of post-mortem UM liver tissue. This is in full compliance with and adheres to the tenets of the Declaration of Helsinki and the ARVO statement on human subjects. Different sections of liver tissue were obtained from a metastatic UM patient post-mortem. Tissue was macerated and cells were lysed in RIPA Buffer (Thermo Scientific). As controls, we purchased healthy liver cell lysates and RNA from Zyagen, Life Science Products (San Diego, CA, USA).
Ex-vivo Cell Culture
Single cell suspensions of excised tissues were prepared by mechanical disruption of the tissue as previously described.13 RBCs were removed using the RBC Lysis Buffer (BioLegend, San Diego, CA, USA).
Cell Proliferation Assay
Quantitation of percentage inhibition was performed using the CellTiter 96® AQueous One Solution Cell Proliferation Assay (Promega, Madison, Wisconsin, USA) as before.14 Briefly, 1.0×10⁴ UM cells per well were cultured under the following conditions: untreated control, HGF, Nutlin-3a, Tenovin-6. Cell Titer reagent was added at a concentration of 20 μL per 100 μL volume per well at specific time points of 0-, 48-, 72-, and 96-hrs after culture. Cells were incubated at 37 °C for 2-hrs before absorbance was read at 490 nm using a 96-well plate reader. The percentage of inhibition was calculated based on the 72-hrs time point using the following formula: %inhibition=100-(100×absorbance sample–absorbance blank)/absorbance untreated–absorbance blank.
Cell Cycle Analysis
UM cells were labeled with DRAQ5™ (1:200, BioLegend) prior to analysis in a quantitative imager cytometer (Flow Sight®, Amnis, EMD Millipore, CA, USA). Cell cycle analysis was based on deoxyribonucleic acid (DNA) content by a histogram of DRAQ5™ Intensity versus normalized frequency. Samples were acquired using INSPIRE® software. Analysis of the acquired data was performed using IDEAS® software. Using the statistics tool the percentage of cells in each phase was determined. Three independent experiments were done.
Apoptosis Analysis
Flow cytometry: UM cells were resuspended in Annexin V Binding Buffer (BioLegend) at a concentration of 1.0×10⁶ cells/100 μL. We added 10 μL of PI (BioLegend) and gently vortexed. The cell suspension was incubated for 15 min at RT, protected from light prior to flow cytometry analysis. Data acquisition was done in a ZE5 Cell Analyzer (aka YETI), from Propel Labs (Fort Collins, CO, USA). Analysis was done using FlowJo software v10.0.8 (FlowJo, LLC, Ashland, OR, USA).
Imaging flow cytometry: We followed the analysis guidelines using IDEAS® software. A Gradient rhabdomyosarcoma (RMS) histogram of the collected population was selected to choose the cells with better focus. The focused cells were gated and analyzed into a scatter plot of Area versus Aspect ratio. Single cells were plotted into a nucleated cells scatter plot of the Brightfield Contrast versus the Area of the thresholded nucleus. Apoptotic cells are defined as cells with low nuclear area and high bright field contrast.
Ki-67 Immunolabeling
UM cell lines were cultured at a 2.5×10⁵ cells/ well in a 6-well plate overnight at different conditions: untreated control, HGF control, Nutlin-3a +HGF, and Tenovin-6 + HGF at 37 °C. Cells were fixed with paraformaldehyde followed by permeabilization with 0.01% Triton X-100 for 20 min. Cells were washed 3x for 10 min each time with phosphate-buffered saline (PBS) followed by blocking with PBS/1% body surface area (BSA) for 1hr. Biotin Ki-67 antibody (SolA 15, 13-5698-82, eBioscience) was diluted 1:250 in PBS/1% BSA. Cells were incubated for 1 hr followed by PBS washes as before. Streptavidin Alexa Fluor 488® (405235, BioLegend) was added at 1:250 diluted in PBS/1% BSA. Incubation proceeded for 1hr at RT. About 15min prior to wash cells we added a 1:4000 dilution of 4’,6-diamidino-2-phenilindole, dihydrochloride (DAPI), FluoroPure™ grade (D21490, ThermoScientific). Cells were washed 3x as before. Images were taken using an EVOS FLoid® Cell Imaging Station (ThermoScientific), at 20x.
Percentage of acetylated-p53+ and Ubiquitinated Cells
Cultured cells were harvested, washed in PBS and immediately fixed in 2% paraformaldehyde prior to permeabilization in 0.01% Triton X-100. Samples were blocked with PBS/1% BSA before addition of a rabbit anti-acetyl-p53 (K382, CST, 1:50) antibody for 1hr in ice. Following primary antibody labeling, cells were washed with PBS and a goat anti-rabbit Alexa Fluor® 488 (ThermoScientific, 1:100) secondary antibody was added for 1hr; nuclei were labeled with DRAQ5™ for the final 15 min of incubation with secondary antibody (BioLegend, 1:500). Cells were analyzed using the AmnisFlowSight®. To assess the percentage of acetylated-p53+ cells we followed the analysis guidelines using IDEAS® software. Gradient RMS histogram was selected to choose the cells with better focus followed by a scatter plot of Area versus Aspect ratio to select single cells. We chose the two channels representing our sub-populations (acetyl, nucleus) and gated co-localized events using a histogram of Bright Detail Similarity and a histogram of intensity. The percentage of ubiquitinated-p53+ (anti-ubiquitin rabbit, EPR8830, Abcam, 1:100) cells was assessed in a similar fashion.
qPCR Analyses
RNA was extracted from cells or tissue using RNeasy® Mini Kit (Qiagen Inc., Valencia, CA, USA) following manufacturer’s conditions and published protocols.14-16 We used 100 ng of RNA material for complementary DNA (cDNA) synthesis. Resulting cDNA material was pre-amplified prior to assay set up. Samples were run in Roche® Light Cycler 480 and analyzed using the Comparative ∆CT Method. Gene expression assays: (ThermoScientific): TP53 (Hs01034249_m1), MDM2 (Hs01066930_m1), and MDMX (Hs00910358_s1).
Western Blot Assays
Cells were lysed in RIPA Buffer as described.13,14 Protein concentrations were determined using Pierce™ BCA Protein Assay Kit (Thermo Scientific). A total of 50 μg of denatured protein were loaded in a Bolt™ 4-12% Bis-Tris Plus Gel (ThermoScientific). After transfer, the polyvinyl difluoride (PVDF) membrane was blocked with 20 mL of SuperBlock™ Blocking Buffer (ThermoScientific) and incubated overnight at 4 °C in primary antibody solution, followed by secondary antibody solution for 2-hrs at real time (RT). The membrane was washed and probed for β-actin as control (Cell Signaling Technologies-CST, Dancers, MA, USA). The following primary antibodies were used: p53 mouse monoclonal antibody (1:1000, 1C12, CST), phosphorylated-p53 rabbit polyclonal (1:1000, Ser15, CST), acetyl-p53 rabbit polyclonal (K382, CST, 1:1000), MDM2 mouse monoclonal IgG1 antibody (1:100, SMP14, Scbt), phosphorylated-MDM2 rabbit polyclonal antibody (1:100, Ser166, Scbt), and anti-mutant p53 rabbit monoclonal antibody (1:1000, E47, Abcam, Cambridge, MA, USA). The following secondary antibodies were used at 1:1000: anti-mouse IgG HRP-linked antibody and anti-rabbit IgG HRP-linked antibody, both from CST. SuperSignal™ West Pico Chemiluminescent Substrate (ThermoScientific) was used for development. Densitometry analysis was done using Kodak Molecular Imager.
Confocal Imaging
Liver samples were fixed in 4% paraformaldehyde in 0.1 M phosphate buffer for 6-hrs. Samples were embedded in low melting point agarose (Sigma) and sections (50 μm thickness) were cut on a vibratome (VT1000S; Leica, Wetzlar, Germany). Immunofluorescence staining for p/tMDM2 and p/TP53 was performed as before.15 Tissue sections were blocked with 10% goat serum for 30 min and permeabilized with 2.5% Triton X-100 (ThermoScientific) to identify intracellular localization patterns. Tissue sections were then separately labeled with anti-MDM2 (1:200), anti-p53 antibody (1:200), anti-pMDM2 (1:200) and anti-pP53 antibody (1:200). Sections were incubated in Alexa Fluor 488® conjugated secondary antibody (Invitrogen, Carlsbad, CA, USA; 1:500) to detect the antigen of interest. TO-PRO3 iodide (1:4000, Invitrogen) was used to label the nuclei. Sections were viewed and images were obtained using a Nikon C1 confocal microscope in HEI, UTHSC. All microscope settings, including laser levels and gain, were held constant and images were collected in identical conditions to allow for relative comparisons of signal intensity within and between experiments.
Statistical Analysis
Data were analyzed using Prism 6 for Mac OS X (GraphPad Software, Inc., La Jolla, CA, USA). Statistical significance determined using the Holm-Sidak method, with alpha=5.000%. Values of p<0.05 were considered significant.
RESULTS
Regulation of the TP53-MDM2 Signaling Axis in the Metastatic Liver Microenvironment
We investigated the TP53-MDM2 signaling pathway in our orthotopic xenograft model as a potential aberrant mechanism in metastatic UM. Details on the orthotopic xenograft have been previously published.9 The primary UM cell line Mel270 was inoculated into the posterior compartment of immunocompromised Nu/Nu mice. Clinically detectable metastases were found after 5-weeks post inoculation. To investigate the role the microenvironment plays in shaping the tumor response, we compared TP53 messenger ribonucleic acid (mRNA) expression of cells prior to inoculation to those of cells cultured ex vivo from liver metastases 5-weeks post inoculation (Figure 1A, left). We discriminated between human UM-derived cells and the murine microenvironment using species-specific gene expression assays. We measured upregulated TP53 mRNA expression in the liver compared to the in vitro cultures on Day 0. Similarly, MDM2 (Figure 1A, middle) and MDMX (Figure 1A, right) were overexpressed ex vivo. To investigate if this response was limited to the metastatic site, we compared these results to spleen-derived cell cultures. TP53 was upregulated, but not to the extent of that in the liver,suggesting the presence of circulating tumor cells in the spleen. Additionally, we measured low expression of MDM2 and MDMX mRNA (Figure 1B, Table 1) in the spleen, suggesting that the TP53-MDM2 de-regulation is specific to the liver microenvironment.
Figure 1. Expression of the TP53-MDM2 Signaling axis within the Metastatic Tumor Microenvironment
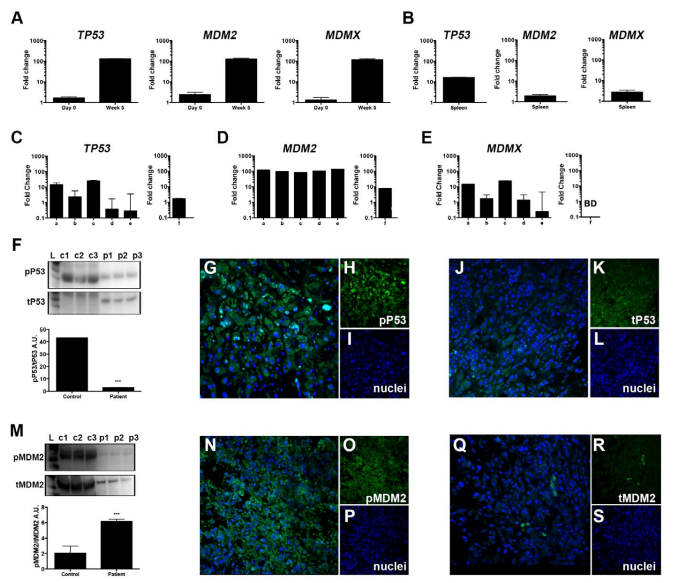
A. TP53, MDM2, and MDMX mRNA expression in Mel270 cells prior to inoculation (Day 0) and the recovered liver (5 weeks post inoculation) of an UM orthotopic xenograft model. B. mRNA expression of in spleen-derived cell cultures. C-E. Tissue was removed from 5-different regions of a metastatic UM patient (samples a-e) to compare with healthy liver (sample f). Examination of TP53(C), MDM2(D), and MDMX(E) mRNA levels. Western blot analyses of TP53 signaling F. F in liver samples from healthy controls (c1-c3) and three regions from the mUM liver (p1-p3) with representative immunohistochemical analysis of phosphorylated-p53 (active) and total-p53 G-L. MDM2 signaling in healthy and mUM liver M. Immunohistochemical analysis of phosphorylated- and total MDM2 N-S. All results from bar graphs represent mean±SEM, ***p<0.0005.
Tumor Survival Mechanisms in Liver Metastases
We sought to confirm the results from Figure 1A-Busing post mortem liver samples obtained from a UM patient with liver metastases. Because these cells may have varying levels of pro-survival molecules allowing them to subsist, we addressed the potential heterogeneity of the microenvironment by sampling 5 different regions of the metastatic UM liver. We compared mRNA and protein levels to samples taken from a healthy liver using qPCR analysis and Western blotting (Wb), respectively. We measured a transcriptional enhancement of TP53, MDM2 and MDMX mRNA in the cohort of samples from the metastatic liver compared to the healthy liver (Figure 1C-E, Table 1). Next, we assessed the protein activation status as it could provide clinically valuable information for the development of protein inhibitors targeting phosphorylation-residues. Figure 1F shows markedly decreased TP53 signaling in metastatic UM compared to the healthy liver as reflected by a decreased ratio of phosphorylated to total TP53. However, immunohistochemical analyses still demonstrated the expression of both phosphorylated- and total-p53 protein (Figure 1G-L, representative figures) in the metastatic liver. We then evaluated the expression of MDM2 and measured higher MDM2 signaling in the metastatic liver compared to the healthy liver (Figure 1M). We also measured expression of the p-MDM2 localized primarily in the nucleus (Figure 1N-S) and low expression of total MDM2 protein. These results highlight the molecular aberrations present in metastatic UM providing a survival mechanism for the tumor.
| Table 1. Gene Expression Analyses on Tissues Retrieved from the
Orthotopic Murine Model and UM Patient post-mortem |
|
Tissue
|
|
Murine Model |
Human |
| Liver |
TP53 |
+++ |
+
|
|
MDM2
|
+++ |
+++ |
| MDMX |
+++ |
++
|
|
Spleen
|
TP53 |
++ |
N/A |
| MDM2 |
+ |
N/A
|
|
MDMX
|
+ |
N/A
|
| (+) symbol indicates fold change expression. Murine model comparison of week 5 compared to Day 0; human tissue expression relative to endogenous control. N/A, not available. |
Enhanced TP53 Signaling in UM Cell Lines After Treatment with Nutlin-3a and Tenovin-6
We investigated the molecular defects of the TP53-MDM2 signaling pathway using a series of well characterized UM cell lines. We cultured cells in the presence of Nutlin-3a17 or Tenovin-618, as they are considered potential therapeutic targets for the TP53-MDM2 signaling pathway. First, we tested the percentage of cell growth inhibition in each of the UM cell lines of interest. Three different UM cell lines were tested, Mel270, a primary tumor derived cell line from an individual with metastatic disease; Mel290, a primary tumor derived cell line; and OMM2.5, a metastatic cell line. Figure 2A depicts the percentage of cell growth inhibition after 72 hrs of culture in the presence of Nutlin-3a relative to untreated cells. About 50% inhibition was achieved between 1-5 μM concentrations. A similar approach was utilized to test the percentage of cell growth inhibition after 72 hrs of culture in the presence of Tenovin-6 (Figure 2B). Next, we tested the cytotoxic effects of Nutlin-3a and Tenovin-6 in UM cell lines by measuring cell death as the percentage of Propidium Iodide (PI)-positive cells by flow cytometry analysis. Primary tumor-derived cell lines displayed a dose dependent response as shown in Figure 2C. In contrast, we measured a significant increase of OMM2.5 PI+cells only at high concentrations of Nutlin-3a. These cells showed sensitivity against Tenovin-6 at smaller dosage (Figure 2D). As a next step, we investigated cell death via apoptosis by measuring the nuclear morphology at the single cell level using imaging flow cytometry. Apoptotic cells are defined as cells with low nuclear area and high bright field contrast, as shown in Figure 2E, left. Figure 2E, right, shows representative images of the non-apoptotic and apoptotic phenotypes. UM cells were cultured in 4 different conditions: untreated; in the presence of hepatocyte growth factor (HGF), mimicking physiological components of the in vivo liver microenvironment; Nutlin-3a + HGF; Tenovin-6 + HGF. Quantitation analyses on each of the UM cell lines are shown in Figure 2F. Collectively, we measured a significant increase in the percentage of apoptotic cells in cell cultures containing either Nutlin-3a or Tenovin-6 across all tested UM cell lines. These results support our hypothesis that the de-regulation in the TP53-MDM2 signaling pathway plays a role in the control of metastatic UM.
Figure 2. Tenovin-6 Increases UM Cell Death and Decreases Cell Proliferation
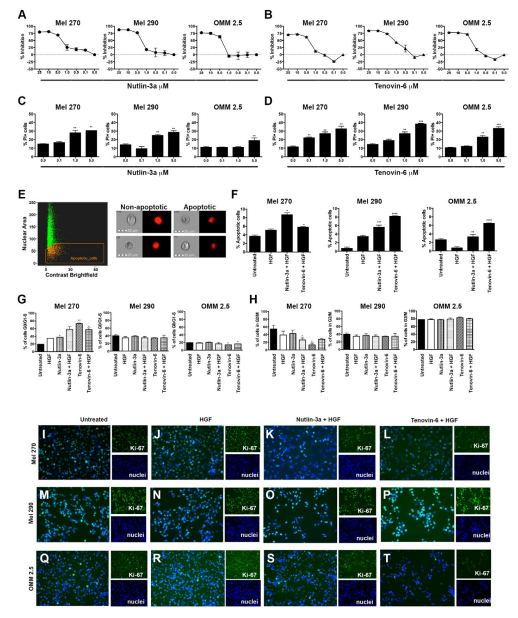
A-B. Percentage cell growth inhibition, Mel 270, Mel 290, and OMM 2.5 UM cells were cultured in the presence of Nutlin-3a (A) or Tenovin-6 (B) at different concentrations ranging from 0.1-5.0 μM. Results represent 72 hrs time point.C-D. Bar graphs representing flow cytometry results of the percentage of PI+ UM cells after treatment with Nutlin-3a (C) or Tenovin-6 D. Drug concentrations ranging from 0.1-5.0 μM. (E, left)Scatter plot of the Brightfield Contrast versus the Area of the thresholded nucleus using FlowSight® imaging flow cytometer. (E, right) Representative images displayingthe non-apoptotic and apoptotic phenotypes. Apoptotic cells are defined as cells with low nuclear area and high bright field contrast. Quantitation of the percentage of apoptotic cells shown in F. Cell cycle progression analysis is shown in G-H. Percentage
of cells in G0/G1-S (G) and G2/M (H) phases for each tested UM cell line.(I-T) Immuofluorescence analyses of Ki-67 immunopositivity in UM cell lines treated with Nutlin-3a + HGF and Tenovin-6 + HGF compared to untreated and HGF controls. Analyses performed in EVOS FLoid® Cell Imaging System at 20x. Ki-67 labeling shown in green channel (Alexa Fluor 488) and nuclei shown in blue (DAPI). The light settings, brightness and contrast were kept constant across all images. All results from bar graphs represent mean ±SEM, **p<0.005; ***p<0.0005.
Next, we tested the hypothesis that de-regulation in the TP53-MDM2 signaling pathway controls UM cell proliferation. Cell cycle studies were done using the live cell permeant DNA probe DRAQ5™ (Figure 2G-H). The cell cycles studies were done without cellular synchronization to investigate the effects of Nutlin-3a and Tenovin-6 in a microenvironment similar to an in vivo setting. Samples were divided into those that are completing cell cycle by measuring the G2/M phase versus those that do not. We measured significant reduction in the percentage of cells in the G2/M phase in Mel270 and OMM2.5 cell lines upon treatment with Tenovin-6, but not with Nutlin-3a treatment. We labeled the cells with Ki-67, as a confirmation of the detection of the growth fraction of the UM cells. Highest intensity of Ki-67 is shown in cells treated with HGF (Figure 2J, N, R). Two distinct features are observed in cells treated with either Nutlin-3a + HGF (Figure 2K, O, S) or Tenovin-6 + HGF (Figure 2L, P, T). First, we observed a reduction in the intensity of Ki-67 labeling in cells treated with either Nutlin-3a + HGF or Tenovin-6 + HGF. Additionally, we observed a reduction in the Nutlin-3a + HGF- and Tenovin-6 + HGF –treated cells compared to the untreated and HGF cells, confirming the results shown in Figure 2C-F.
Enhanced TP53 Signaling in UM Cell Lines After Treatment with Nutlin-3a and Tenovin-6
The next step in our investigation was to assess the effects of Nutlin-3a and Tenovin-6 on TP53-MDM2 signaling by Wb. Mel270 showed increased TP53 signaling, defined as the ratio of phosphorylated-p53 over total p53, after treatment with Tenovin-6 (Figure 3A). Mel290 showed increase in TP53 signaling upon treatment with Nutlin-3a or Tenovin-6 (Figure 3B). The metastatic cell line OMM2.5 exhibited no significant change in TP53 signaling when treated either with Nutlin-3a or Tenovin-6 (Figure 3C). We measured MDM2 signaling using a similar approach. All investigated cell lines (Figure 3D-F) exhibited a significant reduction of MDM2 signaling after treatment with either Nutlin-3a or Tenovin-6.
Figure 3. Increase in the TP52-MDM2 Signaling Pathway in UM Cells by Nutlin-3a and Tenovin-6
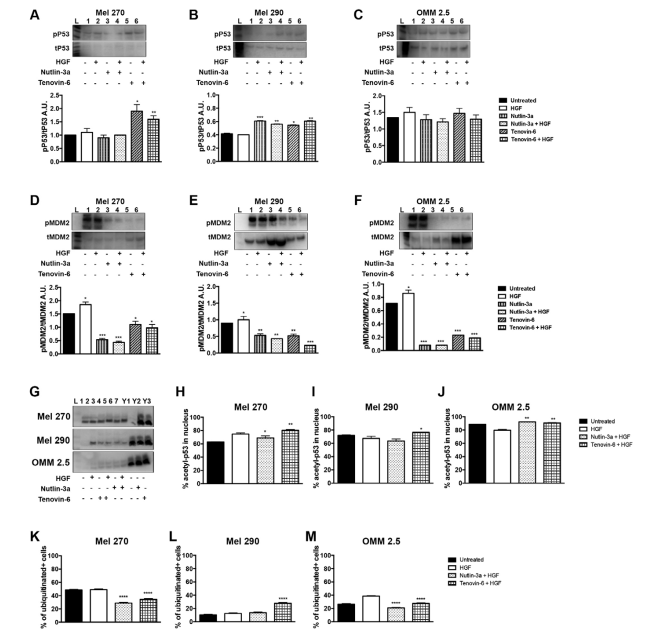
A-B. Wb results showing p53 signaling in Mel270 (A), Mel 290 (B), and OMM 2.5 cells (C). D-F. Wb analyses of MDM2 signaling in Mel270 (D), Mel 290 (E), and OMM 2.5 cells (F). Representative results of Wb showing acetylated p53. Lanes Y1-Y3 indicates Y79 Retinoblastoma cells, used as controls. (H-M)
Quantitation analyses performed using imaging flow cytometry. Quantitation of the percentage of acetylated p53 us showing in H-J. Quantitation of the percentage of ubiquitination is shown in K-M. All results represent mean±SEM, *p<0.05, **p<0.005, ***p<0.0005, ****p<0.00005.
Tenovin-6, Not Nutlin-3a, Increased TP53 Acetylation and Interfered with MDM2-Mediated Ubiquitination
Acetylation of TP53 enhances its DNA-binding activity in vitro and controls its stability. We evaluated acetylation of TP53 by Wb analysis in Figure 3G and revealed enhancement across all tested UM cell lines. We used imaging flow cytometry to test the percentage of acetylated TP53 after treatment with Nutlin-3a or Tenovin-6. We measured an increase in acetyl TP53 in all cell lines after treatment with Tenovin-6, as shown in Figure 3H-J. This enhancement in acetylated TP53 is concomitant to a reduction in the percentage of ubiquitination, as demonstrated in Figure 3K-M.
DISCUSSION AND CONCLUSION
Our findings suggest that in patients with metastatic UM, de-regulation of the TP53-MDM2 signaling pathway promotes growth of the liver metastases and may be a novel target to reduce tumor cell survival. Two decades ago Tobal et al17 reported the presence of abnormalities in the TP53 gene in malignant choroidal melanomas. Jay et al18 confirmed these findings by comparing choroidal melanomas with choroidal nevi. These studies paved the way for discrimination between mutations in the TP53 pathway versus functional inactivation. Brantley et al11 suggested inactivity of the TP53-MDM2 signaling pathway by immunohistochemical analysis of UM from enucleated eyes.
While these investigations evolved, novel small molecule inhibitors against this signaling pathway were developed.19,20 Inhibition of in vivo tumor growth in the B16F10 murine ocular melanoma model was demonstrated by concomitant administration of Topotecan and Nutlin-3a.21 Despite the interesting findings, this has not yet been translated into a clinical application.
The TP53 gene is considered the most frequently mutated gene in human cancer becoming the target for drug development efforts against cancer.22 TP53 undergoes post-transcriptional and post-translational modifications for its regulation and activation. Work by Kruse and Gu demonstrated post-translational modifications are imperative for TP53-dependent cell growth arrest and apoptosis to occur.23 These modifications have effects in the stability and function of TP53. Among them, acetylation of TP53 is indispensable for TP53 transcriptional activity. TP53 was the first non-histone substrate shown to be acetylated by histone acetyl transferases. The enhancement of TP53 acetylation correlated with protein stabilization and activation in response to cellular stress. Under normal physiological conditions MDM2, by its E3 ubiquitin ligase, ubiquitinates TP53 to the proteasome for degradation. Conversely,acetylation of MDM2 can inhibit TP53 acetylation by suppressing the acetyltransferase activity and recruiting the histone deacetylase 1 (HDAC1) to TP53. Mammalian sirtuins are HDACs that play a role in chromatin regulation, cell survival under stress, metabolic homeostasis regulation, and developmental and cell differentiation. Bifunctional roles are attributed to sirtuins in cancer, as some can protect DNA from oxidative stress, maintaining genomic stability, while others are involved in tumorigenesis.24
The results of our work suggested de-regulation of TP53 is not at the transcriptional level. We hypothesized de-regulation of the TP53-MDM2 complex, which favors the tumor, could be due to a post-translational modification of TP53. We tested this hypothesis by investigating the acetylation of TP53, which enhances its DNA-binding activity in vitro and controls its stability, using the sirtuin inhibitor Tenovin-6. While performing our series of investigations, Pan et al25 reported the use of Tenovin-6 as an apoptosis inducer in UM cell lines. Our data confirmed Pan et al findings and addresses new questions that rise from this investigation. In our work, we investigated for the first time the TP53-MDM2 signaling pathway in an in vivo human UM orthotopic xenograft system. Our work revealed the specificity of the liver microenvironment for the accumulation of UM cells, but also revealed the presence, albeit small, of UM tumor cells in the spleen. We demonstrated the ratio of TP53 to MDM2, is much higher in the spleen compared to the liver microenvironment, providing an explanation for the lack of clinically detectable metastases in the spleen. Additionally, we sampled the heterogeneity observed in metastatic UM, as demonstrated with a cohort of 5-samples taken from distant regions of a post-mortem human liver. We measured a dose-dependent apoptotic effect after Tenovin-6 treatment. In our work, we examined Tenovin-6 and Nutlin-3a as both are considered to activate TP53 signaling: the former via transcriptional activation of TP53 and the latter by inhibition of MDM2. Nutlin-3a induces cell death in UM cell lines. This effect was overcome when using Nutlin-3a in combination with HGF, an abundant protein in the liver microenvironment. Because of these data, it is clear that it is critically important to pre-clinically test these potential targets in a physiologically relevant model.
Prognosis for metastatic UM is poor with a 1-year overall mortality rate of 85%, and 2-year overall of 92%. Our limited understanding of the mechanisms underlying metastatic UM survival have led to the use of systemic therapies designed to target cutaneous melanoma, despite different genetic and molecular characteristics between the two cancers. Chemotherapeutics including, dacarbazine, temozolomide, cisplatin, treosulfan, and fotemustine, have failed in treatment of metastatic UM.26,27 Immunotherapy has also shown limited activity in metastatic UM. Data from a Phase II clinical study investigating ipilimumab (NCT01355120) demonstrated limited activity in treatment-naïve and pre-treated patients with metastatic UM.28 Pembrolizumab is being clinically tested (NCT02359851) in metastatic UM. A recent Phase III clinical study using selumetinib in combination with dacarbazine (NCT01974752) showed no improved clinical outcomes compared to dacarbazine alone. Therefore, we must continue pursuing this “holy grail”.
We acknowledge the limitations of our study and these may serve as an initiation point for subsequent studies. Our in vivo animal system is an orthotopic xenograft using UM cell lines. Current efforts in generating patient-derived xenografts (PDX) are underway. Recently, Kageyama et al29 reported an orthotopic PDX model where hepatic metastases are transplanted directly into the liver of immunocompromised mice. We must also be cognizant of the effects prior treatment may have had on modulating the metastases and microenvironment. However, we believe our results to be reliable as they were reproduced in both our xenograft and post mortem liver. Ultimately, our data suggests the de-regulation in the liver microenvironment is the result of both functional inactivation and inhibition of TP53.
ACKNOWLEDGEMENTS
This work was funded by the NIH Medical Student Summer Research Fellowship (McEwen MW, Lee RL) at UTHSC, The Neuroscience Institute (Goldsmith ZK, Chintalapudi SR), the Gerwin Fellowship (Goldsmith ZK, Morales-Tirado VM), Fight For Sight (Lee RL), SJCRH Chair Endowment (Wilson MW), the West Cancer Center Medical Student Fellowship (Gao BT), the West Cancer Center (Morales-Tirado VM), The Ocular Oncology Fund (Morales-Tirado VM, Wilson MW), 930 Friends (Morales-Tirado VM), NIH NCI R01CA176001 (Grossniklaus HE), and
Research to Prevent Blindness (PI: JCF).We would like to thank the Flow Cytometry and Cell Sorting Core facility, the Molecular Resource Center, and Ms. Ellen Garner, Mr. Andrew S. Irvine, and Dr. Justin Lendermon, for technical help.
DATA AVAILABILITY STATEMENT
The chemical structure and compound summary of Nutlin-3A and Tenovin-6 are available in PubChem, https://pubchem.ncbi.nlm.nih.gov CIDs: 11433190 and 2477204, respectively.
ETHICS APPROVAL AND CONSENT
This study was approved by the Emory University School of Medicine Institutional Animal Care and Utilization Committee (IACUC) and The University of Tennessee Health Science Center Institutional Review Board (IRB).
AUTHORS CONTRIBUTIONS
ZKG, MWM, MWK: Performed experiments, data collection and analysis; KY, HY, QZ, SRC, BTG, BK, RPL, AL, NP, XDW: performed experiments; MMJ: participated in data interpretation and wrote the manuscript; HEG: conceived and designed the experiments, performed data analysis; VMT, MWW:conceived and designed the experiments, performed data analysis and supervised study. All authors read and approved the final manuscript.
CONFLICTS OF INTEREST
The authors declare that they have no conflicts of interest.


