INTRODUCTION
The concept of combined pulmonary fibrosis and emphysema (CPFE) has been recently proposed as a syndrome characterized by the coexistence of emphysematous and fibrotic lesions within the same lobe of the lung1,2,3; this concept is also applicable to patients with idiopathic pulmonary fibrosis (IPF). IPF is a disease with poor prognosis and diverse causes of death,4,5,6,7 and it has not yet been determined whether features of CPFE in IPF patients have an effect on its prognosis and/or causes of death.
Past reports, in which CPFE was defined as having an emphysematous area of 10% or more of the whole lung, showed uncertain prognoses8,9,10; another report suggested that the prognosis of CPFE was poor when it was defined as having an emphysematous area of 25% or greater.11 Therefore, we considered it necessary to define CPFE based on the emphysematous area reflecting prognosis.
Although the evaluation of restrictive disturbance in pulmonary function tests (PFTs) (which is represented by forced vital capacity; FVC) is reported as a useful predictor of prognosis,7,12,13,14 its meaning is uncertain in cases where emphysematous lesions are involved. Therefore, the evaluation of restrictive disturbance seems inappropriate for the prediction of prognosis in IPF patients with features of CPFE.
Various predictors have been reported for the prognosis of IPF.15 For example, measurements of concentrations of serum markers such as surfactant protein (SP)-A, SP-D and Krebs van den Lungen-6 (KL-6) have been reported as useful for predicting prognosis.16,17,18,19
In this paper, we elucidate the prognosis of IPF patients with features of CPFE and investigate whether the serum markers including SP-D are useful to predict prognosis, even when restricted to IPF patients with features of CPFE.
SUBJECTS AND METHODS
Subjects
Seventy-two consecutive patients with IPF who visited Sapporo Medical University Hospital or Teine Keijinkai Hospital from 1st January 2007 to 30th September 2012 were enrolled in this retrospective cohort study. Patients were diagnosed with IPF in accordance with the American Thoracic Society (ATS)/The European Respiratory Society (ERS)/The Japanese Respiratory Society (JRS)/The Latin American Thoracic Association (ALAT) statement.20 Exclusion criteria included the presence of connective tissue disease or any other interstitial lung disease, such as other subtypes of idiopathic interstitial pneumonias (IIPs), pneumoconiosis, hypersensitivity pneumonitis, sarcoidosis, pulmonary histiocytosis, pulmonary lymphangioleiomyomatosis, eosinophilic pneumonia and drug-induced interstitial pneumonia. IPF patients with malignant tumours (e.g., lung cancer) at enrolment were also excluded. All patients were clinically stable at the initial visit. This study was approved by the Sapporo Medical University Hospital Institutional Review Board and the Teine Keijinkai Hospital Ethics Committee.
Methods
A high-resolution computed tomography (HRCT) scan was performed within a month after enrolment. In accordance with the ATS/ERS/JRS/ALAT statement,20 patients were enrolled if they had presence of a “usual interstitial pneumonia (UIP) pattern” on HRCT or both “possible UIP pattern” on HRCT and “UIP” on pathological criteria. For evaluating emphysema, low attenuation areas on three scans (upper: near the superior margin of the aortic arch; middle: at the level of bifurcation of trachea and lower: level of the inferior pulmonary veins) in both lungs were calculated. To identify the CPFE criteria that reflect prognosis of IPF, we evaluated two thresholds: 10% and 25% emphysematous area in the total lung area. The case in which the sum of emphysema areas in all lung fields was at or above the threshold was defined as CPFE. HRCT findings were evaluated with the consensus of two pulmonologists who are experts in radiographic diagnosis and were blinded to patients’ clinical information. We evaluated inter-observer agreement with a senior pulmonologist who was blinded to the first diagnosis and had previously studied the definitions we used to classify the patients as having CPFE. Final conclusions were reached through consensus. Fibrosis was defined as the presence of irregular linear opacities, traction bronchiectasis and honeycombing in HRCT, as described by Hanak et al.21 To determine fibrosis score, the extent of fibrosis was calculated using HRCT scans as described above and patients were divided into three subsets: <10%, 10-40% and >40%.
PFTs were performed with a Chestac-9800 (Chest M.I. Inc., Tokyo, Japan) several times during the study period. The number of PFTs and their testing intervals differed across patients due to the retrospective cohort design of the study. To simplify the study design, we analyzed only two values: The initial and final PFT values for each patient. Initial values were obtained within a month after enrolment, and final values were the final PFT values collected in the follow-up period. The percentage change in each index of a PFT was calculated according to the following formula:
Δ%Value=[(%Valuefinal–%Valueinitial)/%Valueinitial)×100].
Moreover, the percentage of change per year in each index was calculated as
Δ% Value/year=(Δ% Value/the number of follow-up months)×12.
Concentrations of biomarkers KL-6, SP-A and SP-D were measured in sera using the commercialized enzyme-linked immunosorbent assay developed for each protein.16,19 All patients underwent semi-ordinal blood examination of KL-6, SP-A and SP-D once every 1-3 months. For analyses, we used data from blood collection within a month of enrolment.
Forty-eight patients underwent echocardiography to identify complications of pulmonary hypertension (PH), which were defined as >45 mmHg estimated systolic pulmonary arterial pressure (eSPAP), based on tricuspid regurgitant pressure gradient, as reported by Mejía et al.8 In patients undergoing surgical biopsy, we confirmed diagnoses in accordance with the ATS/ERS/JRS/ALAT statement.20
Statistical Analysis
Clinical data are presented as mean±standard deviation (SD). Comparison between the groups was performed using the Student’s unpaired t-tests, the Mann-Whitney U-test (Wilcoxon rank-sum test), chi-square statistics and Fisher’s exact test, as appropriate. A Cox proportional hazards model analysis was performed to determine the relationships between clinical data-including PFTs and laboratory data and survival. Survival analysis was performed via the Kaplan-Meier method, with end-points of death or censoring. JMP10 software (SAS Institute Inc. Cary, NC, USA) was used for statistical analysis, and a p<0.05 was considered significant.
RESULTS
Baseline Characteristics
The study period for each patient lasted from enrolment until the last day before study commencement (range: 4.5-64.7 months; median: 38.3 months). For patients with an emphysema area of <10%, 40 and 32 (56% and 44%) out of 72 patients were classified as CPFE and non-CPFE, respectively. For patients with an emphysema area of 25%, 34 and 38 (47% and 53%) out of 72 patients were classified as CPFE and non-CPFE, respectively. We consequently adopted 25%, and not 10%, as a threshold for CPFE so that the survival analysis could distinguish (i.e., find a significant difference) between the CPFE and non-CPFE groups, as described in the following section (“Prognosis”).
Patient’s background characteristics and clinical manifestations at enrolment are shown in Table 1. Significant differences in gender and smoking history were found between the CPFE and non-CPFE groups. The smoking history of the two groups was 50.2±27.1 pack/year and 33.9±32.1 (p=0.021), respectively. Ten patients in the CPFE group and nine in the non-CPFE group were surgically proven to have UIP. Honeycombing was not recognized in four out of the 72 patients in HRCT, two in the CPFE and two in the non-CPFE group who were diagnosed with UIP by surgical biopsy. There were no significant differences in treatment between the groups. Twenty-six patients in CPFE and 22 in non-CPFE underwent echocardiography during the study period. In each group, only one patient was defined with PH, and mean eSPAP was extremely low compared to that in past reports .8
| Table 1: Demographic Characteristics, Fibrosis Score and Serum Markers at Enrolment |
| Characteristics |
Threshold; 25% area of emphysema |
Threshold; 10% area of emphysema |
|
CPFE group
n=34
|
non-CPFE group
n=38 |
CPFE group
n=40 |
non-CPFE group
n=32
|
| Gender (male/female) |
32/2# |
25/13 |
37/3# |
20/12 |
| Age at enrolment (years) |
70.8±7.1 |
72.2±8.6 |
71.5±7.3 |
71.6±8.9 |
| Smoking status |
| Current or former/never |
34/0# |
27/11 |
38/2# |
31/1 |
| Pack-years |
50.2±27.1* |
33.9±32.1 |
50.1±27.0* |
30.9±32.3 |
| Surgical lung biopsy (yes/no) |
10/24 (29) |
9/29 (24) |
11/40 (27.5) |
8/32 (25) |
| Previous treatment (yes/no) |
21/13 |
17/21 |
23/17 |
14/18 |
| CS + IS |
8 |
6 |
9 |
5 |
| CS + IS +PFD |
3 |
4 |
3 |
4 |
| PFD alone |
10 |
7 |
11 |
5 |
| Fibrosis score |
| less than 10% |
6 |
7 |
12 |
9 |
| 10%-40% |
22 |
28 |
22 |
20 |
| more than 40% |
6 |
3 |
6 |
3 |
| Echocardiography |
| eSPAP (mmHg) |
32.5±11.0 |
33.1±9.9 |
32.7±10.5 |
33.0±10.6 |
| eSPAP>45 mmHg (yes/no) |
1/24 |
1/22 |
1/28 |
1/18 |
| Serum biomarkers |
| KL-6 (U/mL) |
1242.5±881.0 |
1142.0±749.3 |
1245.7±914.5 |
1120.3±664.1 |
| SP-A (ng/mL) |
92.7±45.8 |
82.1±39.3 |
92.4±44.3 |
80.4±39.9 |
| SP-D (ng/mL) |
277.7±195.1 |
250.2±176.2 |
260.7±191.6 |
266.2±178.2 |
| We defined the CPFE group using two thresholds of emphysematous area on HRCT: >25% and >10%. Values are expressed as mean±SD or n (%). CPFE: combined pulmonary fibrosis and emphysema; CS: corticosteroids; IS: immunosuppressants; PFD: pirfenidone; eSPAP: estimated systolic pulmonary arterial pressure; KL-6: Krebs von den Lungen-6; SP: Surfactant protein. *p<0.05, #p<0.01, using Mann–Whitney U-test or chi-square test. |
Regarding lung cancer as a complication observed after enrolment, one patient had adenocarcinoma and two patients had squamous cell carcinoma in the CPFE group. On the other hand, one patient had squamous cell carcinoma in the non-CPFE group. The two groups showed no significant difference in fibrosis scores on HRCT or levels of serum biomarkers (e.g., KL-6, SP-A and SP-D) at enrolment.
PFTs
Indices of PFTs at enrolment are shown in Table 2 with significantly lower diffusing capacity of the lung for carbon monoxide (DLCO) and KCO (DLCO divided by the alveolar volume; DLCO/VA). Thus, the CPFE group showed the tendency towards preservation of lung volume and decreased diffusing capacity. The mean FEV1/FVC did not significantly differ between the groups. Similar PFT results were also observed when the <10% threshold for emphysema area was analyzed.
| Table 2: Comparison of Pulmonary Function Indices at Enrolment |
|
Threshold; 25% area of emphysema |
Threshold; 10% area of emphysema |
| Indices |
CPFE group |
non-CPFE group |
p-value |
CPFE group |
non-CPFE group |
p-value |
| n=34 |
n=38 |
n=40 |
n=32 |
| FVC (% pred) |
88.0±17.6 |
84.3±19.7 |
0.2217 |
87.8±17.4 |
83.8±19.9 |
0.1782 |
| FEV1 (% pred) |
98.3±15.2 |
94.8±20.9 |
0.1596 |
98.3±15.3 |
94.1±21.8 |
0.1257 |
| FEV1/FVC (%) |
81.9±8.1 |
82.9±8.3 |
0.3300 |
81.6±8.3 |
83.5±8.0 |
0.1820 |
| TLC (% pred) |
78.0±14.8 |
79.1±15.7 |
0.9090 |
78.9±14.8 |
78.3±15.9 |
0.7446 |
| DLCO (% pred) |
44.7±14.0# |
56.8±17.7 |
0.0083 |
47.1±15.9* |
56.3±17.4 |
0.0288 |
| KCO (% pred) |
65.3±20.4# |
83.5±18.7 |
0.0018 |
67.7±20.4# |
84.2±19.3 |
0.0056 |
| We defined the CPFE group using two thresholds of emphysematous area on HRCT: >25% and >10%. Values are expressed as mean±SD. CPFE: combined pulmonary fibrosis and emphysema; FVC: forced vital capacity; % pred: % predicted; TLC: total lung capacity; FEV1: forced expired volume in 1 s; DLCO: diffusing capacity of the lung for carbon monoxide; KCO: DLCO per alveolar volume. *p-values are reported for the difference between groups using Mann–Whitney U-test. *p<0.05, #p<0.01. |
Prognosis
To identify appropriate CPFE criteria for IPF prognosis, we evaluated the utility of two threshold proportions: 10% and 25% emphysema area out of the total lung area in HRCT. Survival rate of the CPFE group was significantly worse (p=0.012, log-rank test) than that of the non-CPFE group when the threshold was set at 25% (Figure 1, panel A), while the 10% threshold did not show a significant difference (Figure 1, panel B). These results demonstrate that IPF patients with severe emphysema have poor prognoses in CPFE. Therefore, we set the threshold for the area of emphysema affecting the prognosis of CPFE at 25% in this study.
Figure 1: Survival Compared between CPFE Group and non-CPFE Group
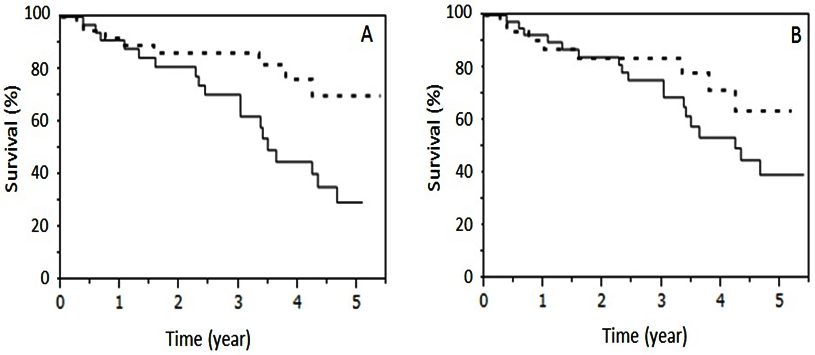
The solid and dotted lines indicate survival of the CPFE group and non-CPFE group, respectively. Although survival of the CPFE group (n=34), when defined as >25% emphysematous area in lung fields, was worse than that of the non-CPFE group (n=38) (p=0.0122, log-rank test; Panel A), survival of the CPFE group (n=40), when defined as >10% emphysematous area in lung fields on HRCT, was not significantly different from that of the non-CPFE group (n=32) (Panel B).
Total number of deaths were 20 (58.8%) in the CPFE group and 8 (21.1%) in the non-CPFE group (Table 3). There were no changes in the number of deaths between the two thresholds for the area of emphysema. The causes of death in the CPFE group were 12 chronic respiratory failures with occasionally repeated infection in the respiratory tract, 5 acute exacerbations of IPF, 1 lung cancer and 2 ‘others’. In the non-CPFE group, five were chronic respiratory failures and three were acute exacerbations. We evaluated the relationships among values at enrolment, longitudinal change in PFTs and prognosis using a Cox proportional hazard model. The initial values of % FVC, FEV1/FVC, % FEV1 and % TLC were predictors of mortality in both groups (Table 4). In the analysis of longitudinal change in PFTs, the cut-off value of percentage change in each index of PFTs (Δ%Value) was set at 5% or 10% to conform with previous studies. 13,14,22 As a result, Δ% DLCO/year (declining more than 5%) and Δ% FVC/year (declining more than 10%) were independent predictors of poor prognosis in the CPFE and non-CPFE groups, respectively (Table 5).
| Table 3: Patient Outcomes During the Follow-up Period. |
|
CPFE group
n=34
|
non-CPFE group
n=38
|
| Follow-up period years |
2.80±1.53 |
3.11±1.56 |
| Dead/Alive (Dead %) |
20/14 (58.8) |
8/30 (21.1) |
| Cause of death |
|
| Acute exacerbation of interstitial pneumonia |
5 (25.0) |
3 (37.5) |
| Chronic respiratory failure including infection |
12 (60.0) |
5 (62.5) |
| Lung cancer |
1 (5.0) |
0 (0) |
| Others |
2 (10.0) |
0 (0) |
| CPFE was defined as >25% of emphysematous area on HRCT. Values are expressed as mean±SD or n (%). CPFE: combined pulmonary fibrosis and emphysema. |
| Table 4: Univariate Hazard Ratios for Mortality According to Values of Pulmonary Function Tests at Enrolment. |
| |
CPFE group
HR (95% CI)
|
non-CPFE group
HR (95% CI)
|
| Initial FVC (% pred) |
0.959 (0.933-0.985)# |
0.901 (0.840-0.953)# |
| Initial FEV1/FVC (%) |
1.083 (1.016-1.158)* |
1.379 (1.125-1.796)# |
| Initial FEV1 (% pred) |
0.967 (0.942-0.995)* |
0.927 (0.876-0.975)# |
| Initial TLC (% pred) |
0.957 (0.925-0.988)# |
0.905 (0.847-0.957)# |
| Initial DLCO (% pred) |
0.978 (0.944-1.014) |
0.952 (0.889-1.002) |
| Initial KCO (% pred) |
0.997 (0.975-1.021) |
0.995 (0.951-1.034) |
| CPFE was defined as >25% of emphysematous area on HRCT. CPFE: combined pulmonary fibrosis and emphysema; HR: hazard ratio; CI: confidence interval; FVC: forced vital capacity; % pred: % predicted; FEV1: forced expired volume in 1 s; TLC: total lung capacity; DLCO: diffusing capacity of the lung for carbon monoxide; KCO: DLCO per alveolar volume. *p<0.05, #p<0.01; using univariate Cox hazard analysis. |
| Table 5: Univariate Hazard Ratios for Mortality According to Annual Changes in Pulmonary Function Tests. |
|
CPFE group |
non-CPFE group |
|
n (%) |
HR (95% CI) |
n (%) |
HR (95% CI) |
| Annual decline in FVC % pred |
|
|
|
| <10% decline or increase |
22 (84.6) |
1 |
25 (78.1) |
1 |
| >10% decline |
4 (15.4) |
1.76 (0.267-6.900) |
7 (21.9) |
10.716 (1.689-84.756)* |
| Annual decline in DLCO % pred |
|
|
|
| <5% decline or increase |
8 (33.3) |
1 |
19 (65.5) |
1 |
| >5% decline |
16 (66.7) |
8.185 (1.459-153.974)* |
10 (34.5) |
0.698 (0.034-5.482) |
| CPFE was defined as >25% of emphysematous area on HRCT. CPFE: combined pulmonary fibrosis and emphysema; HR: hazard ratio; CI: confidence interval; FVC: forced vital capacity; DLCO: diffusing capacity of the lung for carbon monoxide. The percentage of change per year, named annual decline, in each index was calculated as Δ%Value/year = (Δ%Value/number of follow-up months) × 12 (see Subjects and Methods). *p<0.05; using univariate Cox hazard analysis. |
We evaluated the relationship between prognosis and values of serum biomarkers at enrolment. Unlike CPFE, non-CPFE patients with higher serum SP-D levels revealed worse prognosis (hazard ratio (HR): 1.007; 95% confidence interval (CI): 1.003-1.011; p<0.001), as shown in Table 6. We then performed further evaluation focusing on SP-D. The cut-off values for serum SP-D were set at 150, 200 and 250 ng/mL to determine the most appropriate value, in conformity with previous studies.16,17,18 As a result, CPFE patients with higher SP-D (threshold 150 ng/mL) revealed poor prognosis (HR 11.417; 95% CI: 2.275-207.785; p=0.001) (Table 7). In contrast, non-CPFE patients with SP-D>250 ng/mL revealed the worst prognosis (HR 15.237; 95% CI: 2.695-285.409; p=0.001).
| Table 6: Univariate Hazard Ratios for Mortality According to Serum Biomarkers. |
|
CPFE group |
non-CPFE group |
|
HR (95% CI) |
HR (95% CI) |
| Initial KL-6 |
1.000 (0.999-1.001) |
1.000 (0.999-1.001) |
| Initial SP-A |
1.002 (0.990-1.012) |
1.003 (0.980-1.021) |
| Initial SP-D |
1.002 (0.999-1.003) |
1.007 (1.003-1.011)# |
| CPFE was defined as >25% of emphysematous area on HRCT. CPFE: combined pulmonary fibrosis and emphysema; HR: hazard ratio; CI: confidence interval; KL-6: Krebs von den Lungen-6; SP: surfactant protein. #p<0.01; using univariate Cox hazard analysis. |
| Table 7: Univariate Hazard Ratios for Mortality According to Concentration of SP-D. |
|
CPFE group |
non-CPFE group |
| Initial SP-D |
n (%) |
HR (95% CI) |
n (%) |
HR (95% CI) |
| <150 ng/mL |
9 (26.5) |
1 |
14 (36.8) |
1 |
| >150 ng/mL |
25 (73.5) |
11.417 (2.275-207.785)# |
24 (63.2) |
6.395 (1.115-120.455)* |
| <200 ng/mL |
14 (41.2) |
1 |
19 (50.0) |
1 |
| >200 ng/mL |
20 (58.8) |
3.977 (1.376-14.486)# |
19 (50.0) |
9.600 (1.689-180.222)# |
| <250 ng/mL |
18 (53.0) |
1 |
24 (63.2) |
1 |
| >250 ng/mL |
16 (47.0) |
2.117 (0.825-5.621) |
14 (36.8) |
15.237 (2.695-285.409)# |
| CPFE was defined as >25% of emphysematous area on HRCT. CPFE: combined pulmonary fibrosis and emphysema; HR: hazard ratio; CI: confidence interval; SP: surfactant protein. *p < 0.05, #p < 0.01; using univariate Cox hazard analysis. |
DISCUSSION
The recent conception of CPFE defines it as a syndrome rather than a single disease, as it is characterized by an overlapping series of interstitial pneumonias, such as IPF.2 Thus, some patients with IPF may demonstrate clinical characteristics of CPFE. Because CPFE is characterized by the combination of emphysema and pulmonary fibrosis, the presence of differing proportions of the two elements is thought to affect clinical analyses of IPF. In the current study, we evaluated the clinical features of 34 patients with IPF having an emphysema area of more than 25% in the entire lung field in comparison to 38 patients with IPF outside of this range (CPFE group and non-CPFE group, respectively). The threshold of 25% emphysema area was selected on the basis of our survival analysis. In addition, there was no significant difference in the degree of fibrotic change between the two groups.
It is evident that CPFE is closely associated with smoking tobacco.23,24 IPF with CPFE syndrome is also associated
with a heavy smoking history, as demonstrated in Table 1 of the current study. In general, clinical features of CPFE are characterized as follows: 1) % FVC and FEV1/FVC are preserved, 2) DLCO is markedly decreased and 3) CPFE is complicated with PH and lung cancer.9,23,24,25 However, it was previously clear whether these features hold true when patients are restricted to those with IPF. Our study showed that FVC values were preserved in both the CPFE and the non-CPFE groups, while diffusing capacity (including % DLCO and % KCO) were significantly lower in the CPFE than the non-CPFE group. These results suggest that functional profiles of IPF with CPFE in this study are similar to those in other reports.
Prevalence of PH has been reported as 32-85% in IPF and 36% in COPD.26,27 A study by Mejía et al8 showed high prevalence of severe PH and poor prognosis in IPF patients with emphysema in an echocardiography evaluation in Mexican patients. This study also found high eSPAP, on average in patients with IPF and emphysema. In comparison, our study showed an extremely low prevalence of PH and lower eSPAP in both groups. Sugino et al10 used echocardiography and reported an average eSPAP similar to our own in Japanese patients with IPF alone or IPF and emphysema. Although the threshold of emphysematous area was 10% <on HRCT in the report by Mejía et al8 and the difference in prevalence of PH between Mexican and Japanese CPFE patients might be due to racial differences, it is suggested that their patients were more severe than our patients according to PFT features.
There has been controversy regarding whether the co-existence of emphysema affects outcomes for patients with IPF.8,9,10,11 Our results showed that the CPFE group revealed a significantly worse prognosis than did the non-CPFE group when the threshold of ratio of emphysematous area on HRCT was set at 25%, but no significant difference was found at 10% (Figure 1). Regarding PFTs, a large cohort study of patients with IPF suggested that a decline in FVC of more than 10% in IPF13 and that in FEV1 of more than 10% in moderate-to-severe CPFE28 during a 6-month observation are the best physiological predictors of mortality. On the other hand, the present study suggested that an annual decline of more than 5% in % DLCO was a good predictor in the CPFE group, but that FVC and FEV1 were not. Thus, DLCO might be a key predictor of the prognosis of IPF patients with CPFE syndrome.
KL-6, SP-A and SP-D are known to be useful diagnostic serum biomarkers of interstitial pneumonia including IPF and are potential predictors for IPF.16,17,19 Unlike PFTs, these biomarkers are capable of performing measurements repeatedly even in the severe conditions of pulmonary diseases. For this reason, we evaluated the potential of these biomarkers to predict the survival of IPF with CPFE syndrome. Results indicated that patients with higher SP-D revealed poor prognosis in not only the non-CPFE but also the CPFE group. In addition, these groups showed different cut-off levels for survival: 250 ng/mL and 150 ng/mL, respectively. Thus, serum SP-D may be a good predictor for survival of IPF either with or without emphysematous changes, and each cut-off level should be defined in the distinct group. This is especially the case for CPFE patients with lower cut-off levels for SP-D (>150 ng/mL), which is considered a poor prognosis and requires careful management. SP-D might be a better prognostic predictor, especially for severe CPFE patients, because it is possible to measure SP-D repeatedly by blood collection; in contrast, DLCO cannot be measured in severe IPF patients with small VC.
Prevalence of CPFE syndrome in IPF showed varying rates (8-44%) in previous studies.8,9,28,29,30,31 There seem to be two explanations for this: differences in the assessment of emphysema area on HRCT and race differences. Standardization of diagnosis criteria and a large-scale study that takes race into consideration are areas for future research.
CONCLUSION
We demonstrated poorer prognosis in IPF with an emphysematous area of more than 25%, but not 10%, when compared to the other subset of IPF (i.e., non-CPFE). Analyses of PFTs and biomarkers demonstrated that DLCO and SP-D are useful predictors of poor prognosis. SP-D might be a better prognostic predictor than DLCO, especially in cases of severe CPFE, due to the invasiveness of examination.
AUTHOR’S CONTRIBUTIONS
KY, MS, KI and HT designed the study. KY, MS, KI, YU, MO, HN, HC, HK and HT checked the diagnosis and eligibility of study subjects. KY, MS, KI and HT analyzed and interpreted the data. All authors read and approved the final manuscript.
STATEMENT OF SUPPORT
This work was supported partly by a grant-in-aid for the Japanese Ministry of Health, Labour and Welfare.
CONFLICTS OF INTEREST
The authors declare that they have no conflicts of interest.


