INTRODUCTION
Gallstone disease (GSD) is one of the most common gastroenterological disorders, affecting 10-20% of the population in Western countries and causing high costs in the health-care systems, e.g. in the USA about 6.5 billion Dollars annually.1,2,3 Fatty Liver Disease (FLD) is even more common reaching a prevalence of up to 45% in the general population4,5 and causing substantial health-care costs.6 GSD and FLD are showing a rising prevalence since many decades.7,8,9
Both FLD and GSD are multifactorial disorders. In FLD, immutable risk factors are higher age, male sex and genetic risk factors such as the SNP rs738409 (variant p.I148M) of the enzyme adiponutrin (PNPLA3).10 Mutable risk factors include somatometric measurements such as BMI, nutrition, physical activity, alcohol consumption and drugs (e.g. anovulants, fibrates, glucocorticoids) as well as biomarkers such as serum triglyceride levels and diabetes type 2. Non-modifiable risk factors for GSD include advancing age, being female, Amerindian ancestry and carrying common genetic variants such as the SNP rs11887543 (ABCG8 p.D19H variant).11 Among the modifiable risk factors are diabetes type 2, obesity, rapid weight loss, diet, hemolysis, drugs and physical activity.3,12,13 Women are in general of higher risk than men,14 a phenomenon possibly connected with pregnancy and higher oestrogen levels.15
Our study populations were a Hispanic population from the commune La Florida in the Santiago Metropolitan Region in Chile and a Caucasian from Western Pomerania in Northeast Germany. Chileans and Western Pomeranians are among the populations with the highest prevalence of GSD and FLD worldwide.3,16 The two populations did not differ significantly in the frequency of carrying risk allele for GSD identified so far.17,18 In this study we aimed to assess standardised prevalence of GSD and FLD, prevalence of risk factors and ascertain the specific contributions of these risk factors in the two populations to the development of FLD and GSD. Consequently, our research questions are: (1) How do prevalence of FLD and GSD differ between the two populations? (2) Are differences in prevalence explained by differences in risk profiles or rather by different susceptibilities for certain risk factors?
METHODS
Populations and Study Designs
The data from the Chilean study population originate from the first follow-up examination of an epidemiological study in an urban area of south Santiago, La Florida, which is representative of the predominant socioeconomic strata and European-Amerindian admixture of the Hispanic Chilean population with 328.881 inhabitants in 1992. Blocks were randomly selected, and then all individuals residing there were enumerated. In the baseline phase, of 2558 selected individuals, 1678 agreed to participate, a response of 65.6%. The current data of 964 subjects aged from 28-89 originate from the first follow-up examination that has been conducted between 2000 and 2001 which corresponds to 57.4% of the initial sample.16,19 Of these, 63 datasets were incomplete, primarily in genotyping (n=159). Thus, we used 742 complete datasets for the present analyses. For prevalence estimates we used 911 complete datasets.
The German data come from the baseline examination of the Study of Health in Pomerania (SHIP)20 that includes 4308 subjects. From the total population of Western Pomerania comprising 213,057 inhabitants in 1996, a two-stage stratified random cluster sample of adults aged 20-79 years was drawn. The net sample comprised 6265 eligible subjects. Of these, 4308 subjects (n=2192 women; response of 68.8%) participated in the SHIP baseline examination between 1997 and 2001. In 449 datasets data in the variables of interest were missing, primarily in genotyping (n=252) and alcohol consumption (n=207), thus, the analytic sample comprised of 3632 individuals. For prevalence estimates we used 4124 complete datasets. All patients and controls gave written informed consent prior to the study, and all study protocols have been approved by the Institutional Review and Ethics Committees at the respective sites.
Data Collection and Definitions
The examination protocols included a pre-coded questionnaire on socioeconomic data and medical history, physical and abdominal ultrasonographic examinations (Chile: 3.5-MHz linear transducer, Toosbee, Toshiba, Japan; Germany: 5 MHz transducer and a high-resolution instrument, Vingmed VST Gateway) and biomarker analyses. In both studies, body mass index (BMI) was calculated as kg/m2. Alcohol consumption was measured as the mean intake of alcohol over the last 30 days, calculated from interview answers. Serum triglycerides and serum glucose were measured with a fasting time of more than eight hours in Chile; in Germany, the median fasting time was 3.5 hours. Diabetes was defined as a pathological serum glucose value of 11.1 mmol/L or higher, antidiabetic medication and/or a self-reported physician’s diagnosis. Parity was defined as ever being pregnant or not, also postmenopausal hormone intake and contraceptive intake was defined as ‘yes’ or ‘no’.
FLD was diagnosed after visualisation of a hyperechogenic liver pattern compared to renal parenchyma. Indistinctness of hepatic blood vessels or the diaphragm, decreased acoustic penetration and hepatomegaly were taken into the diagnosis as additional criteria. We did not separate non-alcoholic fatty liver disease (NAFLD) from alcoholic fatty liver disease (AFLD) because we were explicitly interested in the contribution of alcohol consumption to the occurrence of FLD. AFLD and NAFLD share similar histopathological patterns and are only caused by different risk factors.21 Moreover, the definition of AFLD does depend on the arbitrarily chosen cut-off value for daily alcohol consumption. Based on ultrasound in both studies, GSD was defined as the presence of gallstones or a previous cholecystectomy.19,20 The SNP rs738409 (common risk variant p.I148M) of the enzyme adiponutrin encoded in the PNPLA3 gene is a major risk factor for FLD,22 similarly the SNP rs11887543 (common risk variant p.D19H) of the ABCG8 gene for GSD.11 Genotyping of these variants was carried out using the TaqMan SNP genotyping allelic discrimination method (Applied Biosystems, Foster City, CA, USA).
Statistical Analyses
Prevalence data were converted to the world population by direct standardisation by age and sex23 using the ‘dstdize’ command in Stata (Stata Corp., College Station, TX, USA). We decided in favour of sex-specific modelling because risk profiles differed substantially between men and women for both phenotypes. Additionally, pathomechanisms are not clear enough to rule out or assume specific sex-specific interactions. Models for FLD were adjusted for age, BMI, alcohol consumption, triglycerides and glucose serum levels, diabetes and SNP rs738409. Models for GSD were adjusted in the same manner but with the SNP rs11887543 and in women additionally for parity, contraceptives and postmenopausal hormones. To quantify the contribution of each risk factor to the phenotypes, we used hierarchical variation partitioning24 implemented in the package ‘hier.part’25 in the software package R (R Foundation, Vienna, Austria).26 This method calculates the model fit with all possible combinations of predictor variables and gives the proportion of explained variance for each variable that is explained solely by this variable. We applied the log-likelihood as goodness-of-fit measurement. To account for possible non-linear relations between the predictors and the outcome, we used fractional polynomials.27 If a two-degree polynomial was fitted for the relationship, we summed up their relative influences resulting from the variation partitioning. To quantify the prevalence of risk factors, we applied median regression for each risk factor and adjusted for age, because median regression does not rely on certain distributional assumptions as e.g. linear (mean) regression. Afterwards, we calculated the respective marginal mean at an age of 50 years to account for changes with age. All models for quantitative outcomes were calculated with robust standard errors.
RESULTS
The analyses included 3632 individuals from Germany (51.1% women) and 742 from Chile (64.6% women). Mean age was 49 years for both samples (standard deviation for Chile: 13 years, SHIP: 16 years).
Prevalence of Fatty Liver Disease, Gallstone Diseases and their Risk Factors
Crude and standardised prevalence data for FLD and GSD are given in Table 1. FLD was much more frequent in German men (37.9%) compared to Chilean men (20.7%). In women, Chileans had a similar prevalence (23.0%) to Germans (21.8%). In contrast, the frequency of GSD was similar between men (Chile: 15.1%, Germany: 14.5%) but differed clearly among women with a much higher proportion in Chileans (40.5%) compared to Germans (26.8%).
| Table 1: Prevalence of fatty liver and gallstone disease for the two cohorts, given is crude and standardised prevalence for the world population. |
| |
|
Fatty Liver Disease
|
Gallstone Disease
|
|
Sex/cohort
|
N
|
Crude
|
Standardised |
95% CI
|
Crude
|
Standardised |
95% CI
|
| Men |
| La Florida (Chile) |
311
|
25.7% |
20.7%
|
16.5%
|
24.9% |
14.8% |
15.1%
|
11.1%
|
19.0%
|
| Northeast Germany |
2011
|
37.3% |
37.9%
|
35.8%
|
39.9% |
14.8% |
14.5%
|
13.0%
|
15.9%
|
| Women |
| La Florida (Chile) |
600
|
24.5% |
23.0%
|
19.6%
|
26.3% |
41.3% |
40.5%
|
36.8%
|
44.2%
|
| Northeast Germany |
2113
|
21.9% |
21.8%
|
20.2%
|
23.5% |
27.1% |
26.8%
|
25.1%
|
28.6%
|
Further, we estimated the prevalence of risk factors for FLD and GSD. To enable comparability between the two study groups, we performed median regressions adjusted by age and calculated marginal means at an age of 50 years. Median values of risk factors are given in Table 2. Median alcohol consumption was in general much lower in women than in men and considerably higher in the German compared to the Chilean population. BMI differed significantly only in women with Chilean having a 2.2 kg/m2 higher BMI than German women. The proportions of diabetes did not differ significantly. Serum triglyceride levels differed only in men and were 0.43 mmol/L (22%) higher in Germans compared to Chileans. Germans had on average higher serum glucose levels than Chileans. The risk G allele frequency of the genetic variant rs738409 at the PNPLA3 gene was strikingly more frequent in Chile. Similarly but less pronounced the risk C allele frequency of the genetic variant rs11887534 at the ABCG8 gene was more frequent in the Chilean population. Parity was marginally higher in Chilean women whereas intake of postmenopausal hormones was more frequent in Germany; there was no significant difference in the use of contraceptives.
| Table 2: Frequencies of risk factors for gallstone disease and fatty liver disease in La Florida (Chile) and Northeast Germany; values are margins at an age of 50 years (except SNP rs738409 and rs11887543; contraceptives are given for an age of 25 years) of median regressions for continuous outcomes (given are medians), logistic regression for binary outcomes (given are probabilities) and Poisson regression for number of G allele copies of rs738409 and rs11887534, respectively. |
| |
La Florida |
Northeast Germany |
p value |
| Risk factor |
Men |
Women |
Men |
Women |
Men |
Women |
| Alcohol (g/d) |
1.0 |
0.1 |
13.4 |
3.8 |
p<0.001 |
p<0.001 |
| BMI (kg/m2) |
27.5 |
28.8 |
27.8 |
26.6 |
p=0.313 |
p<0.001 |
| Diabetes (yes) |
9.4% |
8.7% |
11.1% |
6.3% |
p=0.442 |
p=0.063 |
| Serum triglycerides (mmol/l) |
1.50 |
1.35 |
1.93 |
1.34 |
p<0.001 |
p=0.698 |
| Serum glucose (mmol/l) |
5.06 |
4.95 |
5.45 |
5.22 |
p<0.001 |
p<0.001 |
| SNP rs738409 (number of G allele copies) |
1.03 |
1.10 |
0.44 |
0.47 |
p<0.001 |
p<0.001 |
| SNP rs11887534 (number of C allele copies) |
0.16 |
0.19 |
0.11 |
0.12 |
p=0.047 |
p<.001 |
| Parity |
– |
96.8% |
– |
94.5% |
p=0.017 |
| Postmenopausal hormones |
– |
11.5% |
– |
24.0% |
p<0.001 |
| Contraceptives |
– |
50.6% |
– |
51.5% |
p=0.812 |
Relative Influence of Risk Factors on Gallstone Disease and Fatty Liver Disease
We performed regression analyses and then calculated the contribution of each risk factor on the occurrence of FLD and GSD by hierarchical variation partitioning. As a result, this method gives the independent influence of each variable.
Logistic regression models for the occurrence of FLD and GSD comprised age, BMI, alcohol consumption, serum triglycerides, serum glucose, and diabetes type 2, in FLD additionally the SNP rs738409 and in GSD additionally the SNP rs11887534 as well as parity, contraceptives and postmenopausal hormones in women. For non-linear associations, dependent variables were transformed using fractional polynomials.27 The regression tables are given in the Appendix.
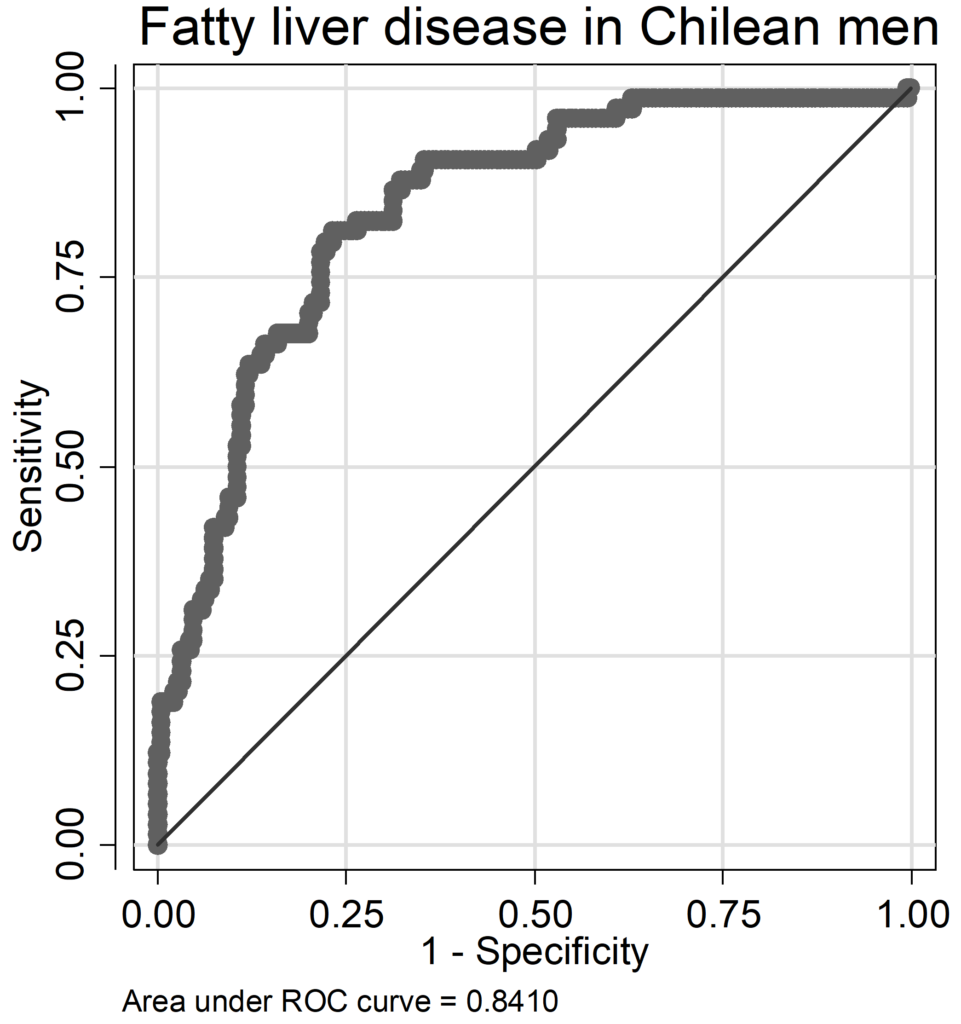
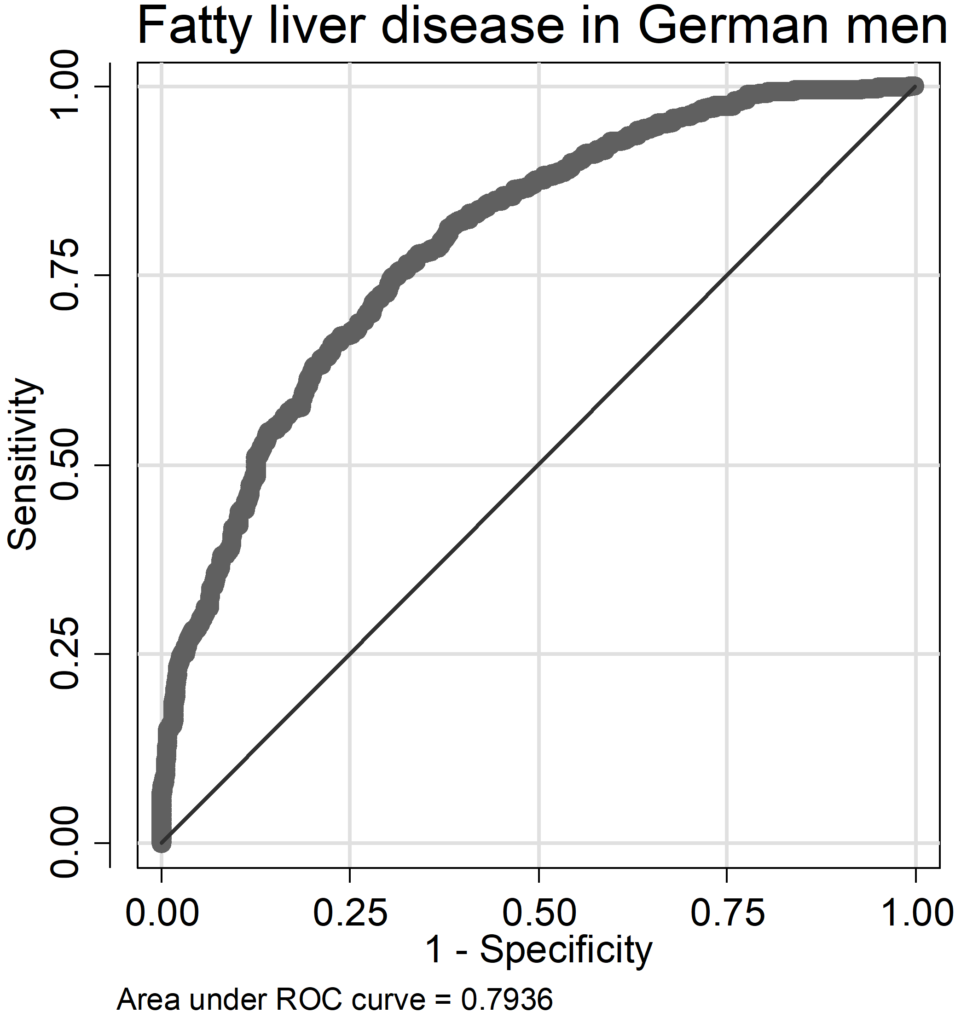
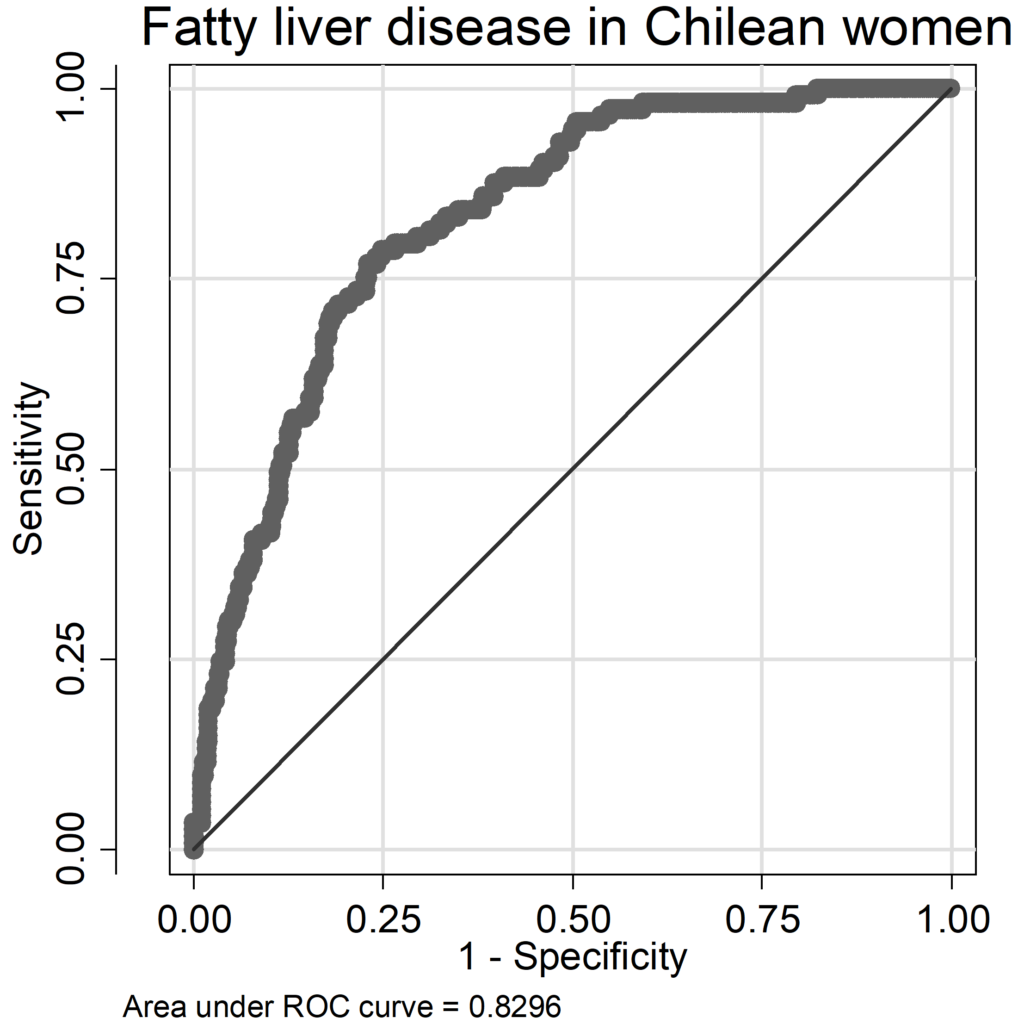
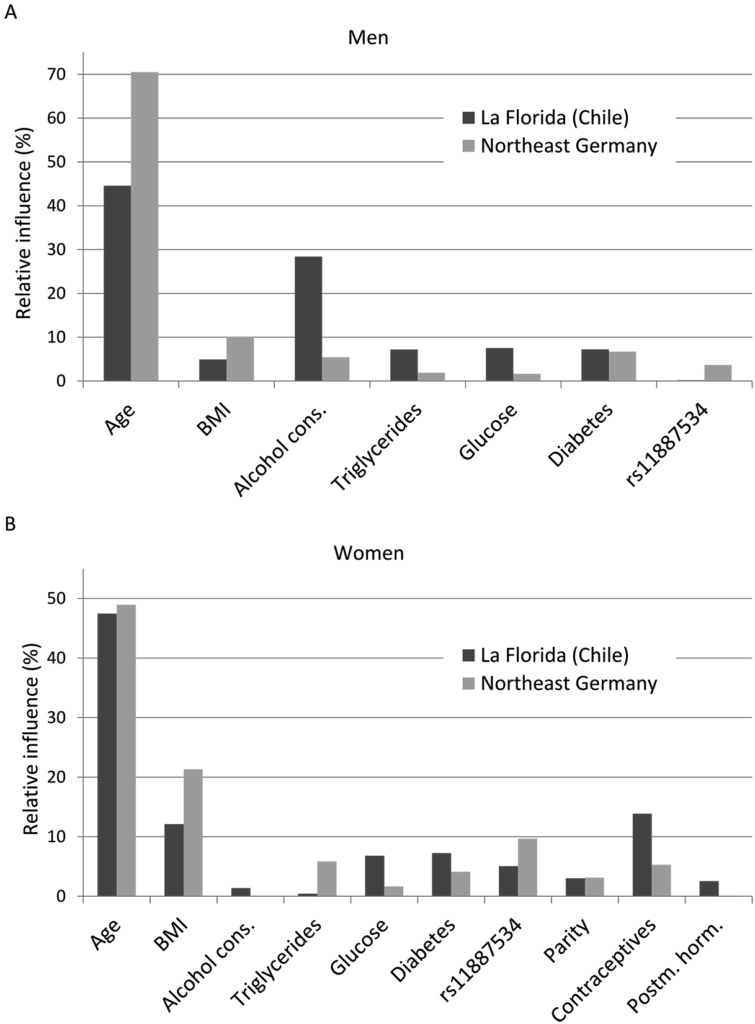
The regression models for FLD had AUC (area under the Receiver-Operation-Characteristic curve) values ranging from 0.79 to 0.88 (Chilean men: AUC=0.841, women: AUC=0.829; German men: AUC=0.794, women: AUC=0.884; ROC curves are given as supplementary data in the Appendices (A 9-A 16); pseudo-R2 values varied between 0.21 and 0.36 (Chilean men: pseudo R2=0.260, women: pseudo R2=0.239; German men: pseudo R2=0.211, women: pseudo R2=0.356). In Chilean men, occurrence of FLD was mainly influenced by the risk factors BMI and serum triglycerides, followed by the SNP rs738409; age, alcohol consumption, serum glucose level and diabetes status were of less importance; in German men, also BMI and serum triglycerides were important, additionally age (Figure 1A). The influence of alcohol consumption and serum glucose levels were weak in both cohorts but stronger in Germans compared to Chileans. The SNP rs738409 was of similar influence as in Chilean and German men. German women did not considerably differ from German man in the relative contribution of risk factors (Figure 1). However, in Chilean women there was a shift: compared to all other groups, serum triglyceride levels were less important, whereas the SNP rs738409 was much more influential having more than 30% relative influence on the occurrence of FLD (Figure 1 B). It is also striking that age provides a major influence in Germans but is neglectable in Chileans of both sex. The immutable risk factors age and rs738409 contributed together with 11.9% in Chilean men, 39.3% in German men, 31.1% in Chilean women and 28.8% in German women.
Figure 1: Relative independent influences of risk factors on the occurrence of fatty liver
disease for men (A) and women (B); cons.: consumption; Postm.: postmenopausal; horm.: hormones
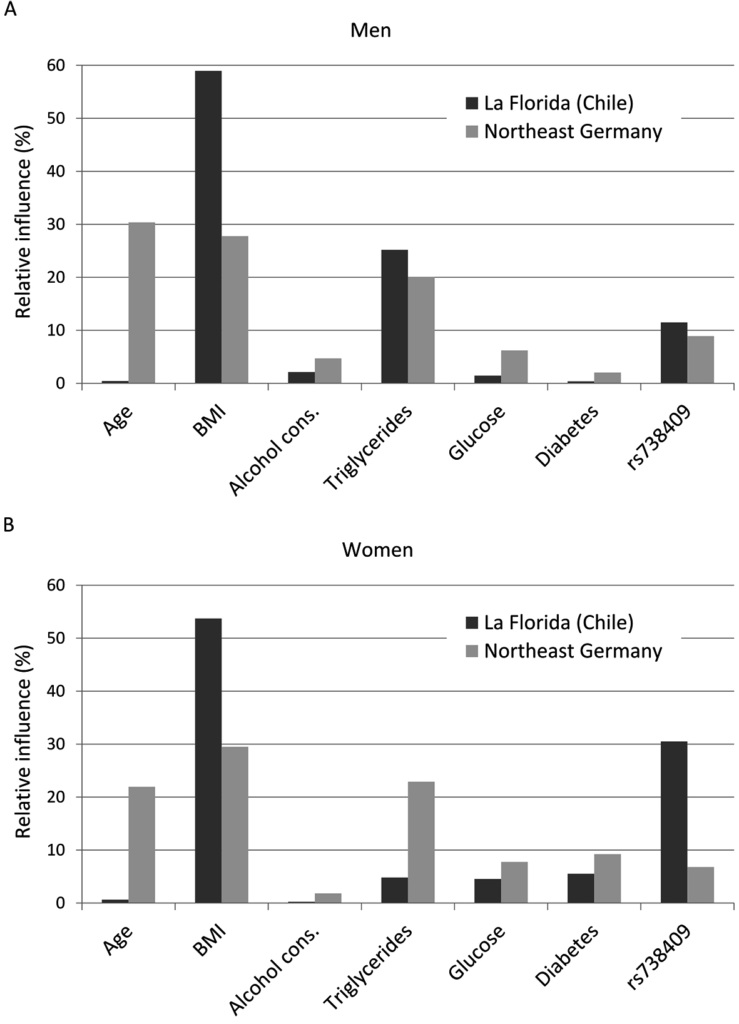
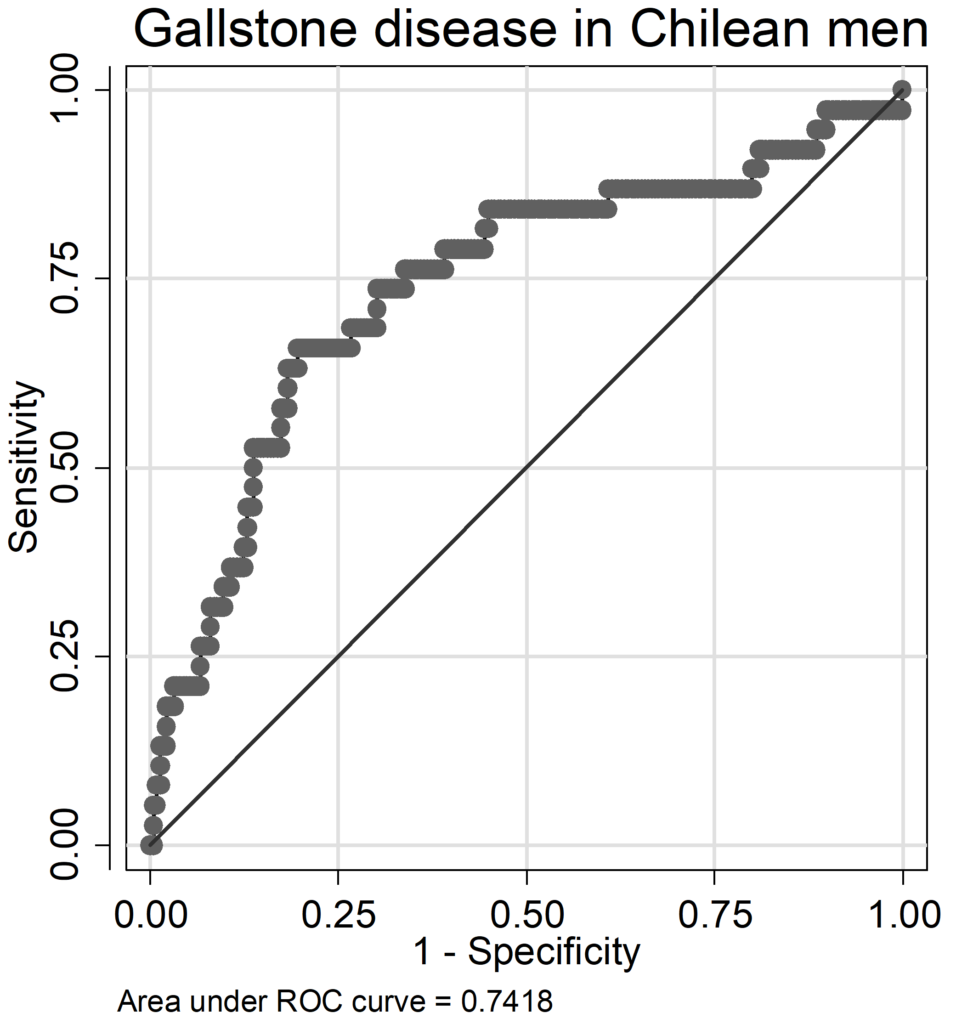
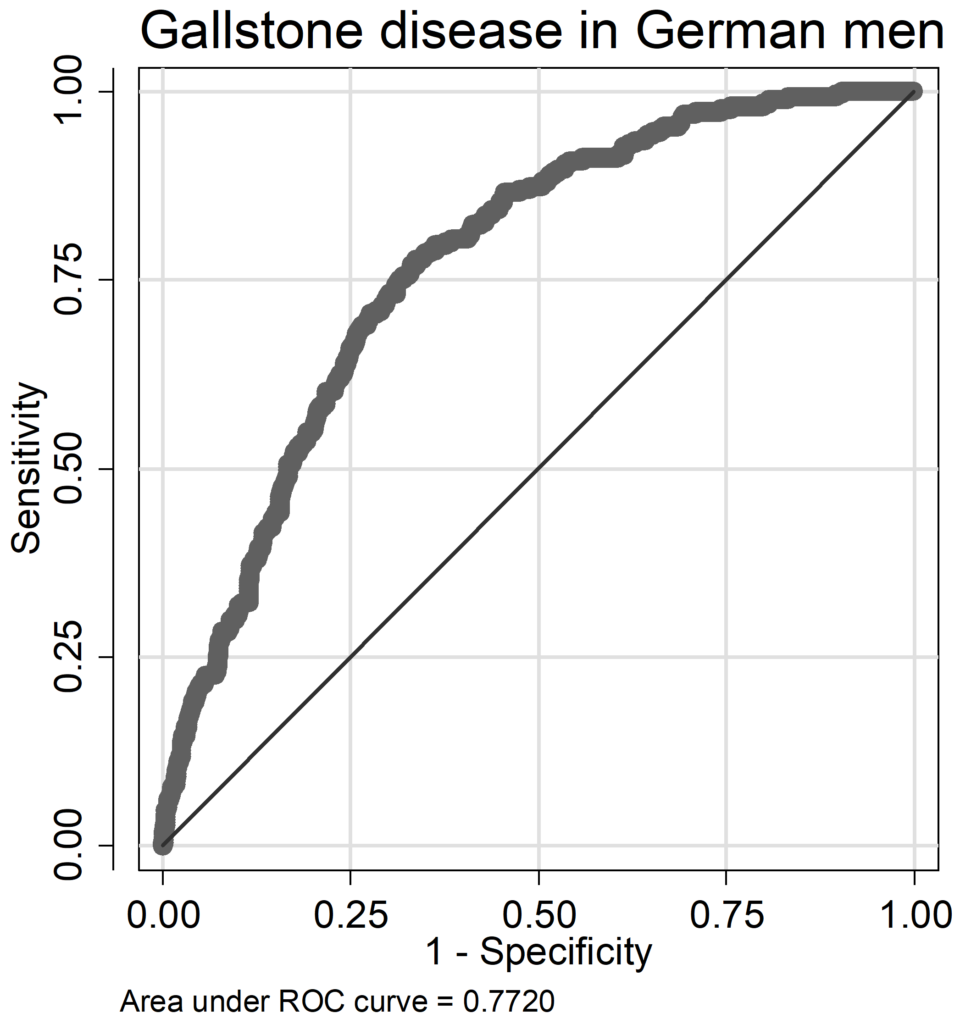
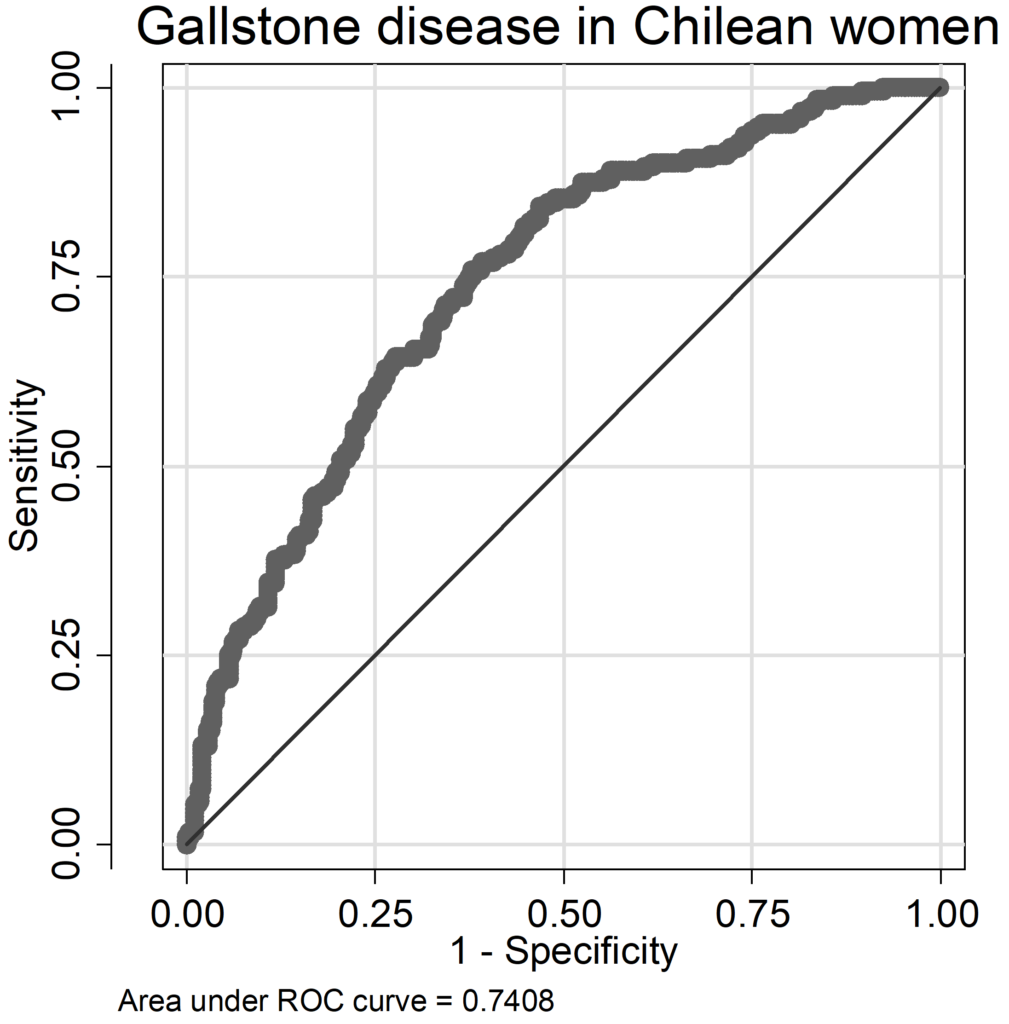
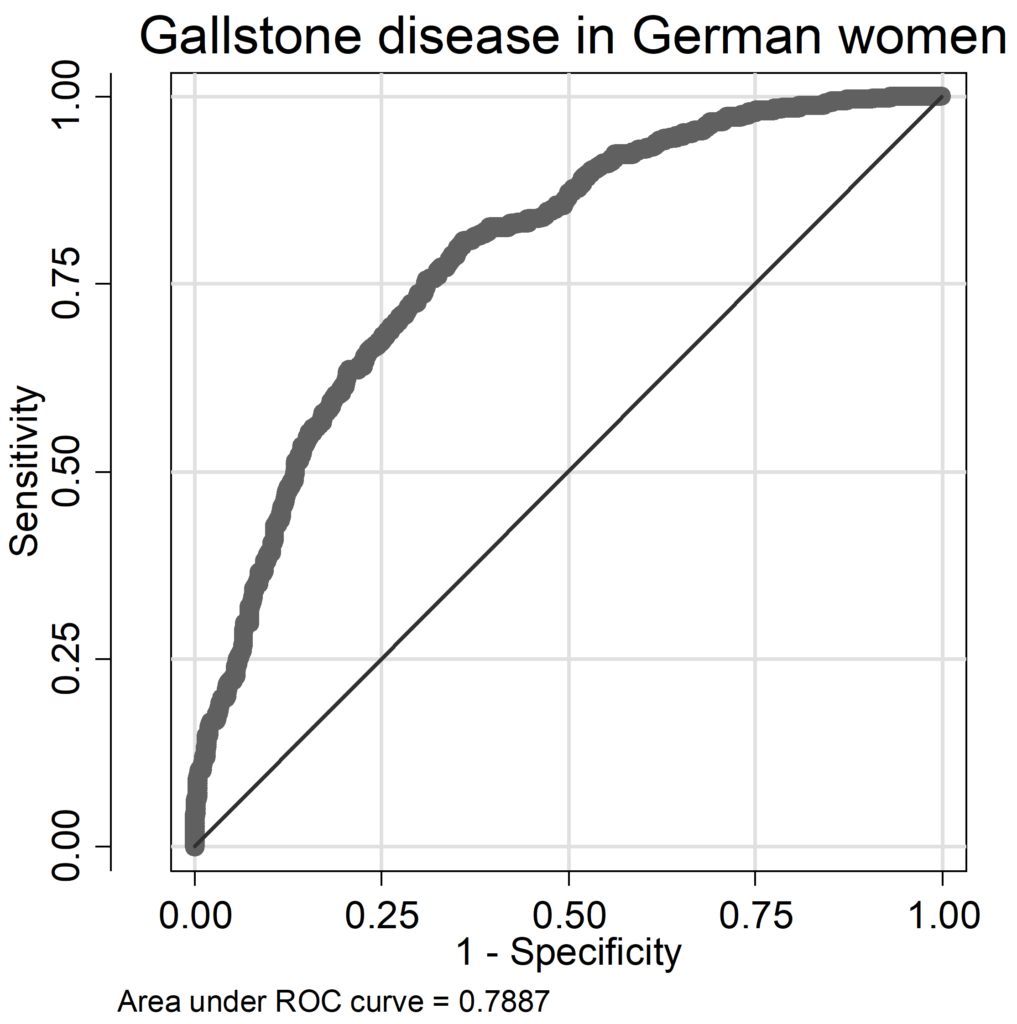
In GSD models, AUC ranged from 0.74 to 0.79 (Chilean men: AUC=0.742, women: AUC=0.741; German men: AUC=0.772, women: AUC=0.789), pseudo-R2 values were lower compared to FLD models (Chilean men: pseudo R2=0.102, women: pseudo R2=0.133; German men: pseudo R2=0.148, women: pseudo R2=0.190). In German men only age and BMI had a relative influence above 10%, whereas in Chilean men age and alcohol consumption contributed considerably to the occurrence of GSD (Figure 2A). Serum triglycerides, serum glucose and diabetes played only a marginal role, in Chile BMI was also not an important factor. While in German men alcohol was non-significant inversely related to GSD (OR=0.993, 95% CI: 0.983-1.002, p=0.119, Table A 6 of the Appendix), it was positively associated with GSD in Chilean men (OR=1.017, 95% CI: 0.999-1.036, p=0.066; Table A 5 of the Appendix) being borderline statistical significant. In women both age and BMI contributed substantially to the occurrence of GSD, in Chileans additionally use of contraceptives (Figure 2 B). In German women, the C allele of the SNP rs11887534 contributed with 10%, in the other groups between 0% and 5% with a stronger influence in Germans. The influence of the other risk factors ranged between 0% and 7%. The contribution of immutable risk factors age and SNP rs11887534 was low (7.2% in Chilean men, 1.9% in German men, 3.0% in Chilean women and 5.9% in German women).
Figure 2: Relative independent influences of risk factors on the occurrence of gallstone
disease for men (A) and women (B); cons.: consumption; Postm.: postmenopausal; horm.: hormones
DISCUSSION
We compared the prevalence of FLD and GSD between two ethnically different populations from Chile and Germany. Additionally, we assessed the occurrence of known risk factors for both disorders. Finally, we calculated the relative contribution of each risk factor to the occurrence of FLD and GSD.
Fatty Liver Disease
In our populations, FLD had a standardised prevalence of 20.8% to 23.1% with the exception of men from the SHIP that showed even a 37.5% prevalence (Table 1). Standardisation to the world population decreased the prevalence in Chile by five percent points. Worldwide prevalence of NAFLD, which make up the vast majority of FLD, has an assumed median of 20%.28 Population-based data from South America are scarce29; in Mexico the prevalence of NAFDL was 17.1%,30 and 23% in the same Chilean population we analysed for the current analysis.31 Regarding the exclusion of individuals with high levels of alcohol consumption for NAFDL in these reports, this might be of about the same prevalence as our findings. Two southwest German cohorts showed a lower prevalence of 24.0% and 18.7% (men and women combined) compared to our data.32 In the United States, the prevalence were of similar magnitude as in Western Pomerania: the Dallas Heart Study found 33.6% FLD measured by 1H magnetic resonance spectrography,33 in another population-based study the prevalence of NAFLD was 21.4%.34 The estimated prevalence highly depends on diagnostic tools (ultrasound, tomography, enzymes, biopsy, autopsy), on age and sex distributions and study design.28 The high prevalence in German men is plausible in the light of the high alcohol consumption, the high prevalence of diabetes and the high serum triglyceride levels (Table 2).
The relative contribution of each risk factor to the occurrence of FLD varied between the Chilean and the German population as well as between men and women. The most obvious difference between the study populations was the influence of age and BMI. This could possibly be attributed to the fact that elder Germans were on average more obese than younger ones, whereas elder Chileans have on average a lower BMI compared to middle-aged subjects. Here, the cross-sectional nature of the data has to be kept in mind: possibly, a change in lifestyle had occurred only in younger Chileans but not in elder ones. In consequence, age and BMI should have to be considered together rather than as single factors. In fact, the sum of the relative influences of age and BMI is comparable for Chile and the SHIP. Alternatively, Chileans may develop FLD and obesity earlier in life compared to Germans or independent of age because of life styles or genetic factors such as rs738409 or others to be discovered.
The SNP rs738409 had an influence of about 10% in SHIP and Chilean men despite the prevalence of the risk G allele was more than 130% higher in the Chilean compared to the German population in men and women. However, a major finding of this cross-ethnic study is that in Chilean women the relative contribution of the PNPL3 risk variant was above 30%. Inversely, serum triglycerides accounted for about 20% of the variation of FLD in men and women from the SHIP but only for 5% in Chilean women. Possibly, PNPLA3 gene is very closely connected with triglyceride storage and might be an explanation for the low impact of serum triglycerides in Chilean women. For the Chilean data but not for the German data, we also confirm previous findings10 that the influence of the SNP rs738409 on liver fat content is stronger in women than in men. An association of the rs738409 G allele with lower fasting serum triglycerides in overweight and obese individuals was found in two genetic studies35,36 and a cohort in northern Europe.37 Conceivably, the G allele of the rs738409 variant could cause an impaired hepatic triglycerides efflux resulting in lower serum triglycerides via a reduction of the very low density lipoprotein (VLDL) lipidation.37 Finally, the risk G allele of the PNPLA3 gene has been reported not only to be strongly associated with altered lipometabolism, but with chronic liver disease severity and progression.37,38 Since heritability of NAFLD has been estimated to be as high as 50% in some populations,39 this single PNPLA3 risk variant may explain about 60% of the heritability of fatty liver disease in Chilean women. Thus, at least in Chilean women, the evaluation of this risk variant may be a cornerstone in implementation of early detection and preventive actions for chronic liver diseases.
The influences of alcohol consumption, serum glucose and diabetes on FLD were low in both populations and sexes.
Gallstone Disease
The standardised prevalence of GSD in Chile was 15.1% for men and 40.5% for women, very similar to the original data reported for the entire cohort16 and one of the highest prevalence reported worldwide. The mean prevalence of GSD in European populations is 10-12%,40 a large study from Italy shows a prevalence of 8.5% for men and 18.9% for women.41 As reported earlier,3 Northeast Germany is a high-prevalence area for GSD. In contrast, two studies from Denmark report a much lower prevalence (men: 5.7%, women: 11.9%42 and men: 6.0%, women: 13.1%,43 respectively). Possibly, these dissimilarities are caused by considerable differences in BMI between Denmark and Germany. However, in the last-mentioned study, differences between known risk factors were only partly able to explain the difference in GSD prevalence between Denmark and Northeast Germany.
In GSD, age was the superior explanation in all groups, consistent with the chronic nature of this metabolic disease. In men, only alcohol consumption in Chileans had additionally a considerable relative influence with higher alcohol consumption being associated with a higher risk of GSD. Since German men drank much more alcohol, our data suggest that the amount of alcohol consumption is in Chileans more closely related to the occurrence of GSD. This could be attributed to genetic differences that cause differences in metabolism. A case-control study from Australia reported a protective effect of alcohol,44 but confounding cannot be ruled out for this finding. In women, the differences in the relative influence of BMI was higher for Chileans compared to Germans (22% versus 12%, respectively) and this trend is also observed in men, but the relative influence was lower. The differences in the relative contribution of serum triglycerides, serum glucose and diabetes were in general small.
Although the prevalence of risk factors for GSD differed substantially between German and Chilean women, their relative influences were comparable. Thus, what caused the extraordinary high prevalence in Chilean Women? Indeed, Chilean women had higher BMI, serum glucose levels and were more often pregnant than German women, but they also used less contraceptives and postmenopausal hormones. We assume that beyond BMI, an unmeasured factor contributed to the high prevalence in Chilean women. Model performances for GSD were worse for the Chilean data than for the German data, with smaller AUC and pseudo-R2 values. This could be indicative of one or several risk factors that occur only in the Chilean population. One possibility are specific not yet discover lithogenic genes, most probably associated to their Amerindian admixture.16,45 Indeed, we and others have proposed that heritability of GSD is significantly higher in Native Americans and admixture populations with Amerindian ancestry compared to other populations.46 The SNP rs11887534 indeed did explain some variation in GSD and had an odds ratio of about two in the German population, but it was able to explain only a comparatively small proportion of variance in the data. It is noteworthy that, although the frequency of this risk allele is significantly higher in Chileans, its effect on GSD risk was very small in Chileans compared to Germans. Possibly, other yet undiscovered genetic variants as well as gene-gene and gene-environment interactions may act beyond the impact of the single SNP, especially in Hispanics. BMI and serum triglycerides were slightly more important in the SHIP, whereas contraceptives had a stronger influence in Chile. Contraceptives may differ in their impact on GSD,47,48 and possibly, compounds used in Chile differ from those used in Germany; unfortunately data on the specific compounds were not available in our study. Moreover, the impact of contraceptives might be modified by different levels of BMI.49 The relative influence of BMI on GSD was in both populations much higher in women than in men. This corresponds to previous findings where obesity was associated with an increased risk of GSD in young women only.44
STRENGTHS AND LIMITATIONS
The strength of our data is the population-based design for both cohorts and a comparable data acquisition in a relatively short period in between 1997 to 2001. Limiting factors are that we do not have comparable data on socioeconomic status, diet, family history and physical activity and are thus not able to address the influences of these factors.
CONCLUSIONS
Overall, the contributions of the risk factors to the occurrence of FLD and GSD coincided widely, but not for all variables. A particularly strong influence on the occurrence of FLD had age in Germans and BMI in Chileans, further the SNP rs738409 in Chilean women, whereas the influence of serum triglycerides was exceptionally weak in this group. For GSD, particularly strong influence had alcohol consumption in Chilean men and use of contraceptives in Chilean women.
ACKNOWLEDGEMENTS
The SHIP is part of the Community Medicine Research net of the University of Greifswald, Germany, which is funded by the Federal Ministry of Education and Research (grants no. 01ZZ9603, 01ZZ0103, 01ZZ0403 and 03IS2061A), the Ministry of Cultural Affairs as well as the Social Ministry of the Federal State of Mecklenburg-West Pomerania. The Chilean study has been supported by Fondo Nacional Científico y Tecnológico (FONDECYT, grant no. 1130303 to JFM and and no. 1100020 to FN) and the FONDAP Center for Genome Regulation (grant no. 15090007) to JFM. The authors thank the community of La Florida, without whose participation and encouragement these studies could not have been performed.
CONFLICTS OF INTEREST
None.