INTRODUCTION
Prior to the commencement of a competitive season baseline fitness and performance testing often occur in order to establish normative data, create a baseline for training, and utilized to monitor and profile athletes throughout the season. By selecting tests that best identify the key physical attributes that relate to performance outcomes for a particular sport, coaches are better equipped to make informed tactical decisions regarding starters and non-starts as well as the amount of playing allocated to each athlete.
Basketball is a multifaceted sport that requires a unique blend of various physical attributes to be successful at the elite level. These attributes include strength and power,1,2,3,4,5 anaerobic and aerobic capacity,4,6,7,8,9 speed and agility.1,2,5,10,11,12,13 While these physical characteristics have been identified as characteristics of elite basketball athletes4,14; the percent contribution of these attributes may vary across players, and more specifically playing positions and the level of play.15 As a result it is therefore difficult to quantify “success” in a manner that is easy to analyze,4,15 when making comparisons between vastly different playing positions and level of play. Consequently, several research studies have examined the relationship between performance tests and playing time,11,16 in an attempt to determine the physical attributes associated with greater playing ime and successful basketball performance.
Change of direction, sprint speed, and vertical jump performance has previously been identified as critical sport-specific movements executed by all players throughout the duration of a basketball game.17,18 As such it would appear logical that these physical performance variables would determine playing time in basketball athletes. It has been shown in previous research that lower body strength, as measured by a 1-RM back squat (r=0.64) displayed a high correlation to playing time in Division I male basketball players.11 These authors also observed a low correlation between upper body strength, measured by a 1-RM bench press (r=0.14) and playing time in the same population.11 Lower body power as measured by a vertical jump (r=0.58)11 and standing long jump (r=0.67)16 has shown to have a strong correlation, whereas aerobic capacity (r=-0.42), 27 m sprint performance (r=-0.62) and t-test (r=-0.33) to have strong and consistent correlates of playing time in DI male basketball players, respectively. This is consistent with research demonstrating lane agility (r=-0.59), to be a strong and consistent predictor of game performance.16 These findings indicate the ability of physical performance testing to predict on field performance and subsequent playing time in basketball athletes.
Currently, no study has investigated the relationship between physical attributes and playing time among Division II basketball players. Thus, it is unclear as to whether the same physical attributes can be used to measure playing time at different levels of competition. Therefore, the purpose of this study was to investigate the relationships between pre-season testing performance and playing time within a men’s Division II basketball team.
MATERIALS AND METHODS
Performance data for 10 (n=10) male NCAA Division II basketball players (Table 1) was used in the study. Although, 15 players were tested, only 10 were used in the final analysis. Redshirt athletes (n=4) and those who did not complete the entire performance testing battery were not included in the subsequent analysis. The data analyzed in this study was collected as part of the team’s normal pre-season performance testing regime. Minutes played for each athlete was retrieved from the World Wide Web on the universities athletics page. Based on the archival nature of this data, this study qualified for exempt review through an Institutional Review Board (IRB) for human subjects.
Table 1: Pearson product moment correlation between playing time and anthropometrical, and physical performance data
|
Variable
|
Mean±SD |
r
|
| Avg. Playing Time (min) |
15.98±10.18
|
–
|
| Total Playing Time (min) |
463.50±295.33
|
–
|
| Weight (kg) |
90.23±9.65
|
90.23±9.65
|
| Height (cm) |
196.29±10.44
|
–
|
| Wingspan (cm) |
200.15±10.21
|
–
|
| Vertical Jump (cm) |
6.86±7.49
|
0.39
|
| Lane Agility (s) |
11.24±0.54
|
–
|
| 5 m Sprint (s) |
0.80±0.04
|
-0.57
|
| 20 m Sprint (s) |
2.80±0.08
|
–
|
| Line Drill (s) |
27.81±0.89
|
0.24
|
| Beep Test (# shuttles) |
65.89±9.90
|
–
|
| Est. VO2max (ml/kg/min) |
41.76±3.50
|
–
|
| Squat Predicted 1-RM (kg)* |
134.44±19.28
|
0.74
|
| Bench Predicted 1-RM (kg)* |
96.16±17.04
|
0.71
|
*Indicates significant correlation to playing time (p≤0.05).
All testing was performed indoors on a hardwood basketball court, 6 weeks prior to the 1st game of the season to ensure adequate fitness and minimal fatigue as a result of in-season competition. Testing was administered by the team’s strength and condition coach, and performed across 4 sessions separated by a minimum of 72 hours to minimize the effect of fatigue on subsequent results. Session one consisted of anthropometric measurements, lower body power, change of direction speed, sprint speed, and an anaerobic capacity assessment. Session 2 assessed subject’s aerobic capacity, while session 3 and 4 consisted of an upper and lower body strength assessment, respectively. Basketball players are often required to perform repeated accelerations and decelerations, directional changes, vertical jumping, and high velocity sprints within a game. Therefore, the physical performance tests used within the study were chosen due to their sport-specific relevance to basketball, and have previously been featured in other studies investigating basketball performance.2,4,10,13,15
Anthropometric measurements, including height and weight, were collected using standard procedures on a doctors beam scale (Cardinal; Detecto Scale Co, Webb City, MO, USA), with height recorded to the nearest 0.01 cm and weight to the nearest 0.1 kg. Wingspan was measured by placing a measuring tape horizontally on a wall. Each subject was instructed to place their arms out to the sides along the length of the tape measure with their chest against the wall. The distance between the middle finger of each hand was recorded to the nearest 0.01 cm.
Assessment of lower body power was measured by a counter movement jump performed on a Just Jump Mat (Just Jump, Pro Botics Inc, Huntsville, AL, USA). The mat was placed under a basketball goal with athletes performing 3 separate counter movement jumps (with arm swing) intercepted with 10 s recovery between trials. No specific instruction was provided to players regarding the speed or depth of each jump, other than to jump from a standing position and reach as high as possible on the backboard. The best score from 3 trials was retained for analysis and recorded to the nearest 0.01 cm. Compared to vertical jumps measured using a Vertec, the Just Jump Mat system has been shown to be a valid method (r=0.906) of assessing vertical jump height.19
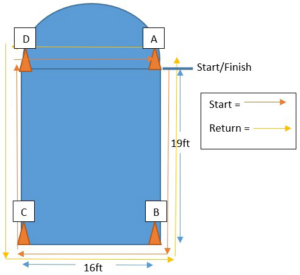
Change of direction speed was evaluated using the lane agility test. Cones were positioned at all 4 corners of the key-way on a standard sized basketball court (Figure 1). From a standing start at the left hand corner of the free throw line facing the baseline (cone A), players were instructed to sprint forward to the 1st cone at the baseline (cone B), shuffle right to the 2nd cone at the baseline (cone C), run backward to the 3rd cone at the free throw line (cone D), shuffle left to the 4th cone at the free throw line (cone A), change directions to shuffle to the right back to the 3rd cone (cone D), sprint forward to the 2nd cone (cone C), shuffle left to the 1st cone (cone B), and finish by backpedaling to the 4th cone at the original start position (cone A).16 Time required to complete each trial was measured using a dual beam electronic system (TC-System, Brower Timing Systems, Draper, UT, USA). Each subject was allowed 3 attempts with the fastest time being recorded to the nearest 0.01 s. The lane agility test has been shown to be a reliable assessment of change of direction ability in basketball athletes (ICC=0.99, CV=8.71%).20
Figure 1: Basketball lane agility test
Running speed was evaluated with a 5 m and 20 m timed sprint using a dual beam electronic system (TC-System, Brower Timing Systems, Draper, UT, USA). Timing gates were positioned at a distance of 5 m and 20 m from a pre-determined starting point. The athletes were instructed to run as quickly as possible from a standing start position. Each subject was allowed three attempts with the fastest time being recorded to the nearest 0.01 s.
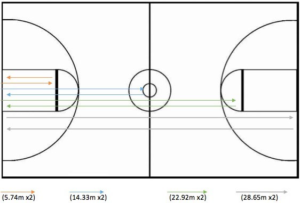
Anaerobic performance was assessed using the basketball line test, commonly referred to as “suicides”. Each player started standing behind the baseline, sprinting to the free throw line (5.74 m) and back to the baseline, then sprinting to half court (14.33 m) and back to baseline, then sprinting to the opposite free throw line (22.92 m) and back to baseline, and finally sprinting the full length of court (28.65 m) and back to the starting position. The total distance covered was 143.28 m. All athletes only performed this test once, with time recorded to the nearest 0.01 s using a hand-held stopwatch (Figure 2).
Figure 2: Basketball line drill.
Aerobic endurance was assessed using the 20 m multistage fitness test, also known as the beep test. Two cones were positioned in a straight line 20 m apart on the basketball court.
Each player ran between the 2 cones paced by an audible beep, on a pre-recorded audio file. As the test progressed, the time between each beep decreased, while the distance remaining the same. Warnings were provided if players did not reach the end line on time and the test was terminated when the player could not follow the set pace of the “beeps” and make it to the end of the 20 m lines within the given time on 2 successive shuttles, and/or stopped voluntarily. The highest level attained before disqualification was recorded, and the number of total shuttles performed was retained for analysis. Further the number of shuttles was converted to an estimated maximal aerobic power (VO2max) using the table of normative values provided in Ramsbottom.21
Three repetition maximum (3-RM) bench press and back squat were utilized to measure upper and lower body strength, respectively. Players were instructed to complete a warm-up prior to testing consisting of 5 repetitions at 30%, followed by 8 repetitions at 50%, followed by 6 repetitions at 60%, followed by 5 repetitions at 70%, followed by 3 repetitions at 80%, all separated by a three minute rest period.22 Following the warm-up additional weight was added in a linear progression to determine each athlete’s maximum load for each lift within 3 to 4 attempts, with 4 min rest provided between each attempt. Using previously established equations; the player’s 3-RM was converted to a predicted 1-RM, similar to previous research.23 Bench press was performed using a standard barbell and flat bench. The players lowered the bar to their chest, and then pressed the weight vertically, until the arms were fully extended; bouncing the bar off the chest was not permitted. Back squat was performed in a high bar position, with the bar positioned across the trapezius muscle. The athletes were instructed to squat as deep as they could safely, extending at the hip and knees to lift.
Descriptive statistical analysis was conducted on the total sample to determine the mean and standard deviations across all anthropometric and physical performance tests. Pearson’s product-moment correlation (r) was performed to determine the relationships between performance tests and playing time. The strength of the correlation coefficient was described as per Hopkins.24 An r value between 0 to 0.30, or 0 to -0.30, was considered low; 0.31 to 0.49, or -0.31 to -0.49, moderate; 0.50 to 0.69, or -0.50 to -0.69, large; 0.70 to 0.89, or -0.70 to -0.89, very large; and 0.90 to 1, or -0.90 to -1, near perfect for predicting relationships. Multiple regression analysis was used to estimate the best predictor of playing time. The level of significance was set at p≤0.05 for all the statistical analysis, unless otherwise stated. All statistical analyses were processed using the IBM SPSS statistics (Version 20.0; IBM Corporation, New York, USA).
RESULTS
Descriptive statistics and Pearson’s product moment correlations between anthropometric data, physical performance tests, and playing time are displayed in Table 1. The strongest correlations (r≥0.71) were observed between total playing time, predicted 1-RM bench press and 1-RM back squat. No statistically significant relationships were discovered between any of the other performance scores, or any of the collected anthropometric data. Playing time appeared to have a large non-significant correlation (r≥0.51) to body weight. Vertical jump and the basketball line drill displayed moderate non-significant correlations (r≥0.31, p=0.09), while 5 m sprint speed demonstrated a moderate negative correlation to playing time. Low negative correlations (r=-0.12 to -0.46) were observed between height, wingspan, lane agility, 20 m sprint, beep test and estimated VO2max, to minutes played.
DISCUSSION
There are a number of factors that contribute to successful sports performance and those athletes who receive greater playing time. Currently, only two studies have investigated the relationship between pre-season performance testing and playing time in male basketball players.11,16 However, the athletes observed in these studies competed in Division I collegiate level, with athlete competing in this league to be shown to have greater physical attributes compared to Division II and III collegiate basketball athletes.15 Therefore, findings from these studies may not directly transfer to athletes competing at different levels of competition. Despite this, based on previous research, it was hypothesized that lower body strength and vertical jump would be strongly related to playing time in division two basketball athletes. It was discovered that while lower body and upper body strength was strongly related to playing time no significant relationships were seen between other anthropometrical or physical performance tests and playing time in the population studied.
Several studies have outlined the importance of a greater strength capacity to be a predictor of success in collegiate basketball.2,4,8,14 Predicted 1-RM back squat displayed the strongest correlation to playing time compared to all the other variables tested in the current study. Similarly, Hoffman11 reported 1-RM back squat displayed a large correlation (r=0.64), to playing time in division I male basketball players. While the average back squat reported in the current study is lower in comparison to previously reported values in division I basketball athletes4,11; possessing greater lower body strength to efficiently execute athletic movements and proficiently move around the court is a deterministic factor for greater playing time. The importance of muscular strength for the execution of general and sport specific movements is well established,25,26 therefore it would appear logical that predicted 1-RM bench press displayed a strong correlation to playing time in the current study. However, this finding contradicts previous research reporting a low correlation (r=-0.04 to 0.14) between upper body strength and playing time division I male basketball players.11 While differences in upper body strength may be due to different priorities of the strength training program, position specific requirements, specifically power forwards and post players would benefit from greater upper body strength to withstand contact from opposing players when rebounding or contesting for positional advantage within the keyway.
Previous research focusing on collegiate male basketball players has not investigated the relationship between body weight and minutes played. This may be of value to coaches to determine if increasing or decreasing an athlete’s body mass to ultimately optimize one’s strength to weight ratio would improve performance on court. Findings of the current study reveal body weight has a large but non-significant correlation to playing time, indicating division II basketball athletes with a greater body mass are likely to receive longer playing time. While the composition of lean and fat mass to an athletes overall body weight was not determined in the current study, we can assume that possessing greater lean body mass increased on court efficiency and subsequent playing time. Previous research has demonstrated the importance of increased lean body mass to produce a faster change of direction5,27,28 and sprinting performance,29,30 and to achieve a greater vertical jump height13; all of which are typical sport-specific movements executed by basketball athletes.17,18 It should be noted that anthropometric characteristics including body weight, height and wingspan would vary depending on the positional role within the chosen sport.15 A limitation of the current study is the inability to compare between playing positions as a result of the small sample size. Guards for example are shorter in height and are therefore able to move around the court at a faster pace, compared to centers that are taller and heavier, suited to contest and rebound the ball in the post.15 This may explain the low correlation observed between height and wingspan in the current study.
In contrast to previous research, vertical jump height was not significantly correlated to playing time in Division II athletes. Findings from Division I basketball have reported strong correlations between measures of lower body power, including vertical jump height (r=0.68)11 and standing long jump (r=0.67)16 to playing time. Possessing a greater vertical jump height would provide a substantial defensive advantage for basketball athletes particularly when rebounding or attempting to block an opposing players shot for goal. However, it should be noted that vertical jump performance during a game requires correct timing, anticipation, and sufficient upper and lower body strength to withstand contact from opposing players to successfully rebound the ball. This significantly differs from preplanned testing conditions, as there are varying environmental and task constraints imposed on the athlete at any given time,31 which may explain the moderate correlation observed between vertical jump height and playing time in the current study.
Basketball involves high-intensity repeated bouts of activity including sprinting, changes in movement direction and vertical jumping,4,8,11,14 involving both anaerobic and aerobic metabolic pathways. Findings of the current study reveal a moderate correlation between the line drill and playing time, whereas a weak correlation was observed between the beep test and estimated VO2max to playing time. Anaerobic performance assessed via a repeat-sprint ability test or line drill has been shown to be a predictor of playing time in elite basketball athletes,32 and is considered a crucial element across numerous team sports.21 Therefore, the greater anaerobic capacity a player has to execute these movements, rapidly change direction and move up and down the court, provides them with an offensive and defensive advantage to successfully evade or pursue opponents. While aerobic endurance in basketball has been shown to be important to maintain a high level of activity for the duration of an entire game,33 it appears the level of aerobic capacity is dependent upon positional requirements. Previous research has reported that guards cover a significantly higher distance executing sport-specific movements at higher intensities, therefore requiring a higher VO2max compared to centers and forwards.34 While time-motion analysis reveals the importance anaerobic capacity for basketball performance, a high base of aerobic capacity is required to sustain these movements across the duration of a game.11 However, positional differences may explain the low correlation observed between aerobic performance and playing time in the current population.
While 20 m sprint demonstrated a weak correlation to playing time in Division II basketball athletes, similar to previous research11; 5 m sprint demonstrated a moderate inverse relationship to playing time (r =-589, p=0.09). This finding suggests that an athlete’s acceleration ability contributes to the amount of playing time received, in contrast to maximal speed. Timemotion analysis of Division I basketball reveal athletes complete 55 to 105 sprints, every 21 to 39 s, with each sprinting effort lasting less than 2 s.34 Further, sprinting efforts over 1 to 5 m throughout a game occurs 57% of overall game time, compared to 5% of sprinting efforts at 20 m or greater.18,34 As basketball players rarely sprint the full length of the court, a faster 5 m sprint time would enable short burst of acceleration to occur, which is a clear requirement for basketball athletes. Therefore, tests that require athletes to sprint over longer distances should be reconsidered as the performance outcomes and objectives do not appear to correspond well to game requirements.
Throughout the duration of a game basketball athletes complete 50-60 changes in movement direction,17,18 highlighting the importance of this physical quality. However, previous research has revealed mixed results indicating playing time shares a strong correlations to the lane agility test (r=-0.59),16 and weak correlations to the t-test (r=-0.30)11 in Division I athletes. The current study supports the latter, with a weak correlation observed between playing time and the lane agility test in Division II basketball athletes. While the lane agility test assesses change of direction ability and typical movements performed during a game (backpedaling, forward running and side-shuffling),5 it is a non-specific test failing to replicate the cognitive demand associated with movement execution during a game.28 Changing direction during a game requires decision-making to read appropriate cues from the opposition and environment to determine subsequent movement direction.28,35 The lane agility test fails to replicate the unpredictable nature in which movement demands are executed during game environments, and therefore could explain the weak correlation observed to playing time.
CONCLUSION
The findings of the study reveal the importance of upper and lower body strength to determine playing time for Division II basketball players. While body weight, 5 m sprint time and the line drill shared a moderate correlation; 20 m sprint time, the beep test, the lane agility test, height and wingspan shared a weak correlation to playing time and therefore offers minimal insight in determining playing time in the population studied. However, it should be noted that the small sample sized used in the study prevented additional comparisons between positional groups, which may reveal further insight into the physical characteristics that result in greater playing time. From a practical perspective, these findings emphasize the importance of resistance training to develop upper and lower body strength to increase playing time in Division II collegiate athletes.
CONFLICTS OF INTEREST
All authors certify that there are no known or perceived conflicts of interest.


