INTRODUCTION
Conflicting Diagnostic Criteria of Metabolic Syndrome
The increase in obesity over the past 30 years has been fueled by a complex interplay of unhealthy diet and physical inactivity, environmental, social, economic, and behavioral factors, acting on a background of genetic susceptibility.1,2,3 Obesity is a common risk factor for diabetes, hypertension, dyslipidemia and other lifestyle related diseases, and the preclinical condition has been summarized under the diagnosis of metabolic syndrome. The concept of metabolic syndrome was proposed by several committees, although there had been a considerable disagreement over the definition and diagnostic criteria. The use of definitions in conducting research into the metabolic syndrome resulted in wide-ranging prevalence rates, inconsistencies and confusion, and spurred on the vigorous debate regarding how the metabolic syndrome should be defined.4,5,6
Excess abdominal fat is an important and independent risk factor for metabolic syndrome. Research has shown that waist circumference is directly associated with abdominal fat and can be used in the assessment of risks associated with excess weight and obesity.7,8 The above Japanese cutoff point (85 cm for men and 90 cm for women) was calculated based on the CT scan data (100 cm2 abdominal fat area). In recent years, abdominal computed tomography (CT) has become available to determine the amount of abdominal fat directly and accurately.7
Fortunately, people who have a body mass index (BMI) of 30 or greater can improve their health by losing weight. A loss of 5-10% of initial body weight can do much to improve health by lowering blood pressure and other risk factors for obesity-related diseases.9 In addition, research showed that a goal of at least 7% weight loss from initial body weight brought by moderate diet and exercise could delay or possibly prevent type 2 diabetes in nondiabetic people.10
Longitudinal Epidemiological and Clinical Study in Saku
We have carried out a series of epidemiological and clinical studies in Saku, Nagano prefecture in Japan.11,12,13,14,15 Since 1990 a population-based Japan Public Health Center cohort study, consisting of 40-59-year-old residents, has been conducted in Saku. In Saku Health Dock Center each year about 7,000 examinees have come to the center for health checkups, including an oral glucose tolerance test (OGTT) by 75 g glucose intake, endoscopy, and recently abdominal CT, in addition to the routine laboratory test and physical check-up. The Saku Health Dock Center database contains approximately 196,000 records connecting to the hospital database.
The purpose of the cohort study was to identify cancer and cardiovascular disease risks, and it represented a novel approach that incorporated biological markers as health screening data, blood, urine, and gene storage for future analyses. We selected this area because of a long collaborative history for primary prevention of chronic diseases.16
Objective of this Study
The objective of this study was to examine the validity of diagnostic criteria of metabolic syndrome, especially focusing on the different criteria of waist circumference (WC) (International Diabetes Foundation (IDF) and Japanese criteria). We re-analyzed the data of our previous clinical study (saku control obesity program (SCOP)) and compared the efficacy of SCOP intervention (i.e. change in the rate of metabolic syndrome before and after the intervention) by using the Japanese and IDF criteria.
METHODS
Evidence-Based Approach: Saku Control Obesity Program (SCOP)
The saku control obesity program (SCOP), the details of which have been described previously.11 The SCOP study protocol included 235 Japanese obese subjects (116 men and 119 women) recruited from the database of medical health check-up of Saku Central Hospital Human Dock Center. The study participants were selected from medical records since 2000 and were aged 40-64-years-old with a body mass index (BMI: kg/m2) greater than 28.3 (the upper 5 percentile of all examinees). They were asked to participate in an intervention program for weight loss.
The number of participants was 116 males and 119 females, aged 52.9±6.6 and 54.4±6.5 years, respectively. Basal metabolic rate, measured in one-tenth of the participants, was 1659±226 kcal in males and 1477±210 kcal in females, and physical activity energy expenditure (PAEE) was 271±127 kcal in males and 246±102 kcal in females. Average body weight was 86.4±11.8 kg in males and 75.2±9.5 kg in females. Average BMI was 30.4±3.5 kg/m2 in males and 31.1±3.1 kg/m2 in females.
A cognitive-behavioral treatment was employed in a randomized intervention trial by diet and physical activity.13 All participants were randomly divided into two groups: Group A received intervention in year 1 and will be followed-up in years 2 and 3; Group B will receive intervention in year 2 and will be followed up in year 3. A diary to record body weight, body fat, number of steps, and success in achieving the established plan (e.g., not eating snacks, increase of 3,000 steps/day), as well as a dietary record, was given to each participant. The equipments for body weight and body fat scale and accelerometer (Lifecorder), were also provided.
The participants received individual counseling (30 minutes) by a registered dietician after physical examination and group sessions about effective exercise (20 minutes) by exercise instructors. Body composition parameters were measured at baseline and at 1, 3, 6 and 9 months during the intervention period.
Statistical Analysis
In this study, we undertook further analysis of the data of the SCOP. Body fat %, total fat area, subcutaneous fat area and visceral fat area after 1-year intervention in the intervention and control groups were compared by Student’s t-test. Spearman correlations were used to test the association among body weight, BMI, waist circumference and CT fat area. The significance of differences among the biomarkers at the baseline, after 1 year and 1-year follow-up were analyzed with repeated measure analysis of variance (Friedman test was used for adiponectin and leptin). The Japanese criteria of metabolic syndrome was defined as follows; WC≥85 cm for male and WC≥90 cm for female and having two or more the following risk factors: dyslipidemia (triglyceride≥150 mg/dl and/or HDL cholesterol<40 mg/dl), hypertension (systolic blood pressure≥140 mmHg and/or diastolic blood pressure≥90 mmHg) and hyperglycemia (fasting plasma glucose≥110 mg/dl). The IDF criteria was defined as follows; WC≥90 cm for male and WC ≥80 cm for female and the other criteria are as same as Japanese criteria.><40 mg/dl), hypertension (systolic blood pressure≥140 mmHg and/or diastolic blood pressure≥90 mmHg) and hyperglycemia (fasting plasma glucose≥110 mg/dl). The IDF criteria was defined as follows; WC≥90 cm for male and WC ≥80 cm for female and the other criteria are as same as Japanese criteria.
RESULTS
At baseline, the prevalence rate of the risk factor of metabolic syndrome was as follows; hypertension; 27.2% and 42.7% for males and females, respectively, hyperglycemia; 39.5% and 40.2%, dyslipidemia; 57.9% and 35.9% for males and females, respectively (Table 1).
| Table 1. Prevalence of Each Risk Factor of Metabolic Syndrome at Baseline |
|
Males n=116 |
% |
Females n=119 |
% |
| Hypertension |
31 |
27.2 |
50 |
42.7 |
| Hyperglycemia |
45 |
39.5 |
47 |
40.2 |
| Dyslipidemia |
66 |
57.9 |
42 |
35.9 |
| *Hyperglycemia is more than 7 mM by OGTT. |
People who are obese could reverse an earlier metabolic syndrome by adopting a healthy lifestyle and losing weight.
In males, the number of risk factors decreased from 40.4% to 35.1% with one factor, 15.8% to 19.3% with two factors, and 14.0% to 7.0% with three factors. In females, 28.1% to 35.1% with one factor, 26.3% to 15.8% with two factors, 7.0% to 3.5% with three factors (Table 2).
| Table 2. Number of Risk Factors Before and After the Intervention |
|
Baseline |
After 1yr intervention |
| Males n |
% |
Females n |
% |
Males n |
% |
Females n |
% |
| No risk factor |
17 |
29.8 |
22 |
38.6 |
22 |
38.6 |
26 |
45.6 |
| 1 risk factor |
23 |
40.4 |
16 |
28.1 |
20 |
35.1 |
20 |
35.1 |
| 2 risk factors |
9 |
15.8 |
15 |
26.3 |
11 |
19.3 |
9 |
15.8 |
| 3 risk factors |
8 |
14.0 |
4 |
7.0 |
4 |
7.0 |
2 |
3.5 |
|
57 |
|
57 |
|
57 |
|
57 |
|
A goal of 5% reduction of body weight attained more than half, and about one fourth achieved 10 kg reduction of body weight. Group A showed 4.5±4.4 kg decrease by the one-year intervention, and group B decreased by 5.4±6.1 kg body weight.
Anthropometric and Laboratory Data of SCOP
The waist circumference was measured twice at the umbilicus level while the subject was in a standing position using a fiberglass measuring tape; the average measurement was used for the analysis.
Total fat areas were assessed by a CT scan at the level of the umbilicus, with the subjects in the supine position, and calculated using the software (Fat Scan; N2 System Corp, Osaka, Japan) (Figure 1).
Figure 1. Abdominal Computed Tomography of Visceral Fat and Subcutaneous Fat
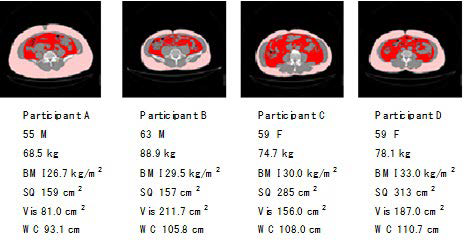
Abdominal CT photo was taken annually and total fat, subcutaneous and visceral fat was separately measured by the computer software. Body fat % was measured by InBody (body composition measurement by impedance) and change in fat measurements by 1-year intervention was compared (Table 3).17
| Table 3. Changes of Fat Volume and CT Area by 1year Intervention |
| Intervention group (Males (n=56)) |
Control group (M(n=49)) |
| Males |
Baseline |
After I year |
Baseline |
After I year |
p |
| Age (years) |
53.7±6.7 |
|
53.9 ± 6.3 |
|
|
| Body fat (%) |
28.5±3.6 |
26.8±4.4 |
29.2±4.6 |
29.6±5.1 |
** |
| Total fat area (cm2) |
393±82 |
333±81 |
417±137 |
397±104 |
** |
| Subcutaneous fat area (cm2) |
243±66 |
207±62 |
253±114 |
238±96 |
* |
| Viscera fat area (cm2) |
150±48 |
126±46 |
164±48 |
159±48 |
** |
| Intervention group (Females (n=52)) |
Control group (F(n=52)) |
| Females |
Baseline |
After I year |
Baseline |
After I year |
p |
| Age (years) |
55.0±6.6 |
|
54.5±6.2 |
|
|
| Body fat (%) |
39.7±5.2 |
37.8±5.9 |
41.8±5.4 |
41.8±5.8 |
** |
| Total fat area (cm2) |
467±98 |
402±93 |
468±123 |
455±108 |
** |
| Subcutaneous fat area (cm2) |
343±80 |
302±76 |
335±100 |
326±88 |
|
| Viscera fat area (cm2) |
125±47 |
100±38 |
133±47 |
130±45 |
** |
| Means±SD. Significant level between two groups after 1 year; *p<0.05 **p<0.01 |
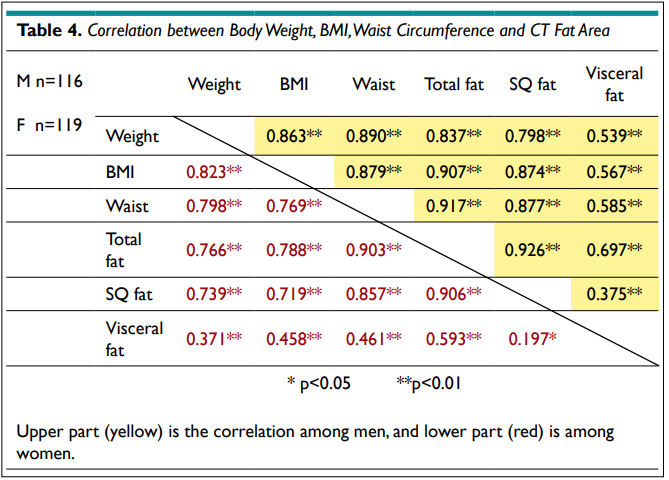
The correlations among body weight, BMI, WC, and total fat, subcutaneous and visceral fat area (cm2) by CT are shown in Table 4. BMI, WC and total fat area showed a significantly high association, and the visceral fat area only showed a mild association with total fat area and body weight. Visceral fat area had poor association with subcutaneous (SQ) fat area in female subjects.
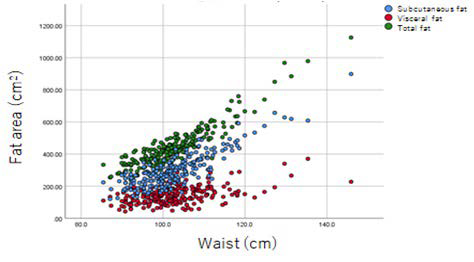
Even though the WC increases, the increase of visceral fat area is the lowest compared to the subcutaneous fat area (Figure 2).
Figure 2. Relationship between Waist Circumference and CT Estimated Fat Area
Following an overnight fast, blood samples were collected for biological analyses at the time of each health check-up. HDL cholesterol (HDL-C), LDL cholesterol (LDL-C), triglyceride (TG) and HbA1c levels were analyzed in the clinical laboratory of the Saku Central Hospital. High-molecular-weight form (HMW) adiponectin (μg/mL) and leptin (ng/mL) were measured by ELISA. Clinical and biological parameters were assessed at baseline (0 month), the end of intervention (12 months) and the end of follow-up (24 months).
Body weight, BMI, and other biological change are noted. Most of the biomarkers were significantly improved at the 12 and 24 months as compared with baseline (Table 5).
| Table 5. Change of Biomarkers at the Baseline, After 1year Intervention, and 1year Follow-up |
| Males (n=56) |
unit |
Baseline |
After 1year intervention |
1 year follow-up |
p |
| Weight |
kg |
84.2±8.5 |
79.3±8.7 |
80.5±1.2 |
** |
| BMI |
kg/m2 |
29.8±2.3 |
28.1±2.5 |
28.5±2.6 |
** |
| Systolic blood pressure |
mmHg |
131.9±15.4 |
125.8±14.3 |
128.3±12.6 |
** |
| Diastolic blood pressure |
mmHg |
81.1±14.2 |
79.3±11.2 |
80.4±10.1 |
|
| Waist circumference |
Cm |
100.0±6.5 |
96.0±7.5 |
96.7±7.3 |
** |
| Total fat area |
Cm2 |
393.3±82.2 |
333.1±80.7 |
350.3±82.0 |
** |
| Total cholesterol |
mg/dl |
205.4±29.3 |
203.3±34.1 |
196.6±29.9 |
** |
| HDL cholesterol |
mg/dl |
48.3±10.8 |
50.3±12.7 |
51.4±14.6 |
** |
| LDL cholesterol |
mg/dl |
123.2±28.9 |
124.4±30.9 |
120.8±31.2 |
|
| Triglyceride |
mg/dl |
169.7±98.1 |
142.8±74.4 |
146.4±81.9 |
* |
| HbA1c |
% |
5.7±1.1 |
5.5±0.8 |
5.7±0.7 |
** |
| Adiponectin |
ug/ml |
2.2 (1.5-3.6) |
3.2 (2.1-5.9) |
2.6 (1.6-4.8) |
** |
| Leptin |
ng/ml |
6.7 (4.2-9.1) |
5.7 (3.8-8.8) |
5.2 (3.6 |
** |
| Females (n=52)-7.3) |
| Weight |
kg |
74.5±8.4 |
70.7±9.3 |
71.9±1.3 |
** |
| BMI |
kg/m2 |
31.0±2.9 |
29.4±3.4 |
29.9±3.3 |
** |
| Systolic blood pressure |
mmHg |
132.6±16.1 |
126.8±17.3 |
126.1±17.4 |
** |
| Diastolic blood pressure |
mmHg |
81.3±11.4 |
79.8±11.7 |
78.9±10.9 |
** |
| Waist circumference |
cm |
103.2±8.1 |
99.2±9.6 |
100.7±9.2 |
** |
| Total fat area |
cm2 |
467.4±97.6 |
402.0±93.0 |
420.5±90.8 |
** |
| Total cholesterol |
mg/dl |
210.3±35.5 |
210.1±26.8 |
206.4±27.6 |
|
| HDL cholesterol |
mg/dl |
56.2±11.8 |
57.2±13.0 |
59.0±13.4 |
* |
| LDL cholesterol |
mg/dl |
128.0±31.8 |
129.2±25.9 |
126.8±25.0 |
|
| Triglyceride |
mg/dl |
130.8±60.7 |
118.4±57.9 |
112.9±53.9 |
* |
| HbA1c |
% |
5.9±1.2 |
5.6±1.0 |
5.9±1.0 |
* |
| Adiponectin |
ug/ml |
5.1 (4.1-8.4) |
6.8 (5.1-10.2) |
5.8 (4.8-8.5) |
** |
| Leptin |
ng/ml |
17.7 (13.2-23.5) |
15.7 (10.7-20.7) |
14.2 (9.5-18.2) |
** |
*p<0.05, **p<0.01 by repeated measure ANOVA (by Friedman test for adiponectin and leptin)
Means±SD. Adiponectin and leptin showed median and range (25 percentile and 75 percentile). |
Changes in adiponectin and leptin were a good biomarker for the trend in body weight decrease and rebound (Figure 3).
Figure 3. Leptin and Adiponectin Corresponding to the Quartile of Body Weight Decrease
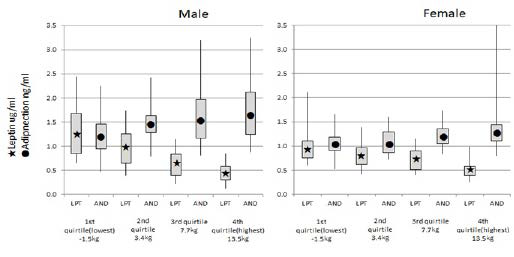
Adiponectin is associated with insulin sensitivity and atherosclerosis. Despite adiponectin being secreted from adipose tissue, plasma levels are lower in individuals with obesity, insulin resistance and type 2 diabetes (T2D). Leptin continued to decrease throughout 24 months despite weight regain between follow-up periods (Table 5). HDL-C continued to increase from baseline to 24 months. At 24 months, HDL-C was significantly higher than at baseline for both men and women.
Evaluation of efficacy of SCOP intervention by Japanese and IDF criteria
We evaluated the efficacy of SCOP intervention (i.e. change in the rate of metabolic syndrome before and after the intervention) by using the Japanese and IDF criteria. When we applied Japanese criteria, the rate of metabolic syndrome among men decreased from 100% to 97.3%, and among women 96.6% to 88.6% (Table 6). Three and 8% reduction in males and females occurred. However, when we applied the IDF criteria, the rate of metabolic syndrome among men decreased from 97.4% to 88.5%, and among women 100% to 100%. Metabolic syndrome rate decrease was found 9% in men, and none in women.
| Table 6. Number of Subjects by Japan and IDF Criteria |
| Baseline |
Japan criteria |
IDF criteria |
|
M |
% |
F |
% |
M |
% |
F |
% |
| MS – |
0 |
0 |
4 |
3.4 |
3 |
2.6 |
0 |
|
| MS + |
116 |
100 |
115 |
96.6 |
113 |
97.4 |
119 |
100 |
| total |
116 |
|
119 |
|
116 |
|
119 |
|
| After 1 year intervention |
Japan criteria |
IDF criteria |
|
M |
% |
F |
% |
M |
% |
F |
% |
| MS – |
3 |
2.7 |
13 |
11.4 |
13 |
11.5 |
0 |
0 |
| MS + |
110 |
97.3 |
101 |
88.6 |
100 |
88.5 |
114 |
100 |
| total |
113 |
|
114 |
|
113 |
|
114 |
|
| MS; metabolic syndrome, -; none, +; present, M; males, F; Females |
DISCUSSION
Different Prevalence of Metabolic Syndrome by Japanese, WHO and IDA Criteria
The first definition of criteria referring to abdominal obesity was proposed by the National Cholesterol Education Program Adult Treatment (ATPIII) in 2001. ATPIII adopted abdominal obesity estimated by the WC rather than by BMI in addition to hypertriglyceridemia, low High-Density Lipoproteins (HDL)-cholesterol, high blood pressure, and hyperglycemia.
In 2005, the International Diabetes Foundation (IDF) reported a new diagnostic criterion of metabolic syndrome, making abdominal obesity an essential factor required in the diagnosis.4 The representatives of the IDF, the International Atherosclerosis Society, and the American Heart Association/National Heart, Lung and Blood Institute agreed that abdominal obesity should not be a prerequisite for the diagnosis, requiring the present of any three of five factors. They also suggested that abdominal obesity should be defined based on the national cutoff point of each country.4 Most countries accept the criteria of IDF.
Matsuzawa5,18 accumulated data of abdominal CT scan in relationship to adiposity and diseases, and the Japanese committee adopted a cutoff point of 100 cm2 of the visceral fat area for both men and women because the risk of metabolic syndrome increased over this point in both men and women simultaneously. WC that corresponded to visceral fat of 100 cm2 was 85 cm in men and 90 cm in women.
When we compare the efficacy of intervention by Japanese criteria, the rate of metabolic syndrome among men decreased from 100% to 97.3%, and among women 96.6% to 88.6% (Table 6). Three and 8% reduction in males and females occurred. However, when we applied the IDF criteria, metabolic syndrome rate decrease was found 9% in men, and none in women. Such unbalance is curious in biological response. It also suggests the prevalence of metabolic syndrome by IDF criteria is underdiagnosis in men and overdiagnosis in women compared to the Japanese criteria.
Biological Rationale of the Japanese Criteria Based Upon the Abdominal Fat Area by CT
Controversies on the significance and cutoff point of WC may have arisen from a misunderstanding of the purpose and the significance of the measurement of WC.18
The adipose tissue had been considered as just an energy storage tissue, but recent studies reported that the tissue synthesizes and secretes various bioactive substances called adipocytokines, such as leptin, adiponectin, tumor necrosis factor-α (TNF-α), free fatty acids (FFAs), resistin and angiotensinogen.19 Many studies have been investigated about adiponectin and leptin among various adipocyte-derived cytokines, and it is thought to be related in the process of metabolic syndrome to the disease.20,21
So far, visceral adiposity measured by CT scan is a golden standard, and it fits into the pathophysiology of metabolic syndrome.
The cutoff point in Japan was the only one that was based on the visceral fat area for the prevalence of diseases. The first nationwide lifestyle intervention program to improve the risk factors for metabolic syndrome in healthy adults was recently reported by Tsushita et al.22 They used the registry of Specific Health Checkups and Specific Health Guidance focusing on metabolic syndrome in middle aged adults, 40 to 74 years of age, beginning in 2008 with follow-up period of 3 years. Number of participants to the program was 31,790 and non-participated controls were 189,726. Body weight reduction was 1.98 kg (participants) and 0.42 kg (non-participants) and WC reduction was 2.34 cm in men and 2.98 cm in women by the intervention, while among controls it was unchanged for 3 years.
So, the standardization of diagnostic criteria is important to compare the efficacy of intervention and prevention of diseases. It could be conclusive that the WC of Japanese criteria is appropriate avoiding both over-diagnosis and under-diagnosis. WC reflects both visceral fat and subcutaneous fat of the abdominal wall, women in middle age usually have more subcutaneous fat than visceral fat. A similar distribution is found among sumou wrestlers. The subcutaneous fat area did show a low correlation with visceral fat area (CC=0.197) in women (Table 4).
As developing countries are simultaneously facing increasing obesity and lifestyle diseases, collaboration in research and programs is urgently needed to prevent disease through dietary and lifestyle intervention.
ACKNOWLEDGEMENT
Drs. Masahiro Morioka, Masahiko Noda, Toru Takebayashi and participants in the SCOP study are appreciated for their cooperation and support. We acknowledged Dr. Yuji Matsuzawa for discussing the diagnostic problems of metabolic syndrome.
ETHICAL ISSUE
The protocol of SCOP was approved by the National Institute of Health and Nutrition and the SAKU General Hospital. The Ministry of Health, Labour and Welfare supported the study by funding.
CONFLICT OF INTEREST
The authors declare that they have no conflicts of interest.


