INTRODUCTION
The quality of healthcare is an emerging concern worldwide and this is particularly true of practice in North America. The Institute of Medicine (IOM) report ‘To Err is Human: Building a Safer Health System’ released in 1999 estimated 44,000-98,000 deaths in United States of America every year resulting from medical error, a prime manifestation of inadequate quality of care.1 This epoch making report promoted wide spread public outcry regarding the state of healthcare in the United States of America. We have previously reviewed the systemic nature of medical errors and their prevalence in critical sectors of healthcare including clinical diagnostic laboratories, emergency medicine and intensive care units.2,3 The issue of quality in healthcare has been a recurring topic in many discussions and debates with the healthcare quality debate primarily focusing on what processes should be used and what outcomes are to be achieved.4
The International Organization of Standardization (ISO) has defined quality as “the degree to which a set of inherent characteristics fulfils requirements”.5 The term ‘quality’ in the healthcare context has been appropriately defined by the IOM.6 It defines, “quality of care is the degree to which health services for individuals and populations increase the likelihood of desired health outcomes and are consistent with current professional knowledge”. More recently, quality has been simply defined as “doing the right things for the right people, at the right time and doing them right the first time”.7 There may be a number of domains that quality encompasses. In recent years, there seems to be a consensus emerging that quality involves safety, effectiveness, appropriateness, responsiveness or patient centered care, equity or access and efficiency.8
The quality of healthcare has been a primary concern of many Governments worldwide. The IOM conducted a National Roundtable on Healthcare Quality as early as 1996 to deliberate quality of health and healthcare issues in the United States of America.9 The roundtable comprised of twenty representatives of the private and public sectors, medical and nursing practitioners, academicians, business professionals, patient advocates, media persons and health administrators. The role of National Health Service (NHS), United Kingdom, in improving the quality of patient care was outlined clearly in the Government white paper ‘The NHS: Modern and Dependent’.10 The concept of clinical governance has been vividly set in the paper. Clinical governance is defined as a “system through which (NHS) organizations are accountable for continuously improving the quality of their services and safeguarding high standards of care by creating an environment in which excellence in clinical care will flourish”.11 Chassin and Galvin,9 making a statement on the IOM National Round Table, wrote, “Problems in healthcare quality are serious and extensive; they occur in all delivery systems and financing mechanisms”. The authors further noted that “Americans bear a great burden of harm because of these problems, a burden that is measured in lost lives, reduced functioning and wasted resources”, and called for urgent action.9
The attaining of industrial grade quality performance is still far from achievement. The industrial sectors have been far ahead in enhancing their quality as compared to healthcare. This wide chasm can be attributed to many factors, particularly, the complexity of medicine and disease processes. In addition, an essential component of today’s health care delivery is largely dependent on a complex set of internal systems working smoothly and efficiently in a coherent manner.12 Unlike most healthcare areas, the industrial sectors have fairly well-established protocols and processes where every step is precisely defined and well-controlled with little or no variability. Another major difference between these sectors is the slow response shown by healthcare administrators in accepting and adapting to new quality improvement initiatives. The healthcare delivery system is constantly changing; it is fraught with newer risks everyday and in such a setting the traditional quality improvement techniques such as Continuous Quality Improvement (CQI) and Total Quality Management (TQM) are inadequate and the need for embracing newer quality management models is inevitable and essential.
The present day need is for healthcare services to build on their past successful strategies and adapt to the modern challenges of managed health care, competition and increasingly complex healthcare delivery systems. This need is best accomplished by increasing the focus on improving the processes themselves. In this scenario, the industrially tested and proven six sigma methodology, through its statistical component and process focused approach provides an optimal solution to ease at least some of the healthcare quality woes. In some ways, the slow and guarded response of healthcare sectors in implementing the six sigma strategy may be a blessing in itself. The industrial and manufacturing sectors have tried, tested and repaired any kinks in the methodology. As a result, it has gone through the grind and been refined, and with a proven record, the six sigma approach is now ready for application in enhancing the quality and patient safety in healthcare.
NEW ISSUES WITH CONTEMPORARY SOLUTIONS
The six sigma methodology is an industrial quality improvement tool. The industrial sector particularly Motorola (six sigma is a federally registered trade mark of Motorola), General Electric (GE) and Allied Signal have employed six sigma strategies with remarkable gains in terms of efficiency, client/ customer satisfaction and overall profitability.13 Unlike other quality initiatives borrowed by the health care sector from the industrial sectors like the TQM and CQI, six sigma is different in that the improvement obtained through this approach provides sustained strategic achievements with long-lasting benefits. The six sigma philosophy is based on a reduction of variation in a process, customer oriented and data driven decisions.
Sigma (σ) is a Greek alphabet letter, used to describe variability in a process. In the six sigma methodology, the unit used is defects per unit. A sigma value indicates the frequency of defects occurring in a process. Therefore, a higher sigma value translates in lower defects and a lower sigma value means a higher number of defects. A process is cited to be performing at ‘world class’ levels when it is functioning at levels of six sigma.13 In other words, a process performing at six sigma level translates into a phenomenal 3.4 Defects per Million (DPM) opportunities, the practical limit to perfection. The present day healthcare services are only functioning at 3 sigma and in some cases 4 sigma levels that translate roughly into 66,807 and 6,210 DPM opportunities respectively (Table 1). The only healthcare sector that has been close to achieving six sigma performance is Anesthesia, with mortality rates (taken as defects) as low as 5 per million opportunities.14 Though six sigma quality performance may not be ideally achievable by all, the goal of six sigma surely is. A six sigma performance aims at an overall improvement in the performance of the process and if this is set as a fundamental goal in healthcare services, we start getting closer to six sigma level, thereby improving the performance of the process exponentially. It has been suggested that reaching a rate of 3.4 DPM opportunities is less important than developing a process to evaluate error rates and bring about systematic changes that increase reliability.15
Table 1. Levels of Sigma Performance and Corresponding Defects per Million Opportunities
|
Sigma Level
|
DPMO*
|
|
6
5
4
3
2
1
|
3.4
233
6,210
66,807
308,537
690,000
|
| *Defects per Million Opportunities |
Improving healthcare quality to six sigma levels becomes imperative when one considers the percentage of population using healthcare services. With such a large denominator and millions of healthcare events occurring every day, even a minuscule percentage of errors represent a large number. On the same front, it is worth considering the fact that even a small error may terminate with catastrophic consequences to a patient’s health. The current day healthcare system is content if their process functioning lies within ±2 Standard Deviations (SD) of the mean. In a Gaussian distribution, this would result in only a 4.5% defect rate, but considering the potential of healthcare usage, this would translate into an appalling 45,400 DPM opportunities. These figures would be of little solace to an already ill patient. The clinical diagnostic laboratories are content if their results enclose ±2 SD or ±3 SD limits. In other words, they find defect rates of 45,400 DPM opportunities and 2,700 DPM opportunities (Table 2) as acceptable performance.16
Table 2. Gaussian Distribution in Terms of Defects per Million Opportunities
|
Gaussian Distribution
|
DPMO*
|
|
> 2 SD
> 3 SD
> 4 SD
> 5 SD
> 6 SD
> 7 SD
|
45,400 DPMO
2700 DPMO
63 DPMO
0.6 DPMO
0.002 DPMO
3×10⁻⁶ DPMO
|
| *Defects per Million Opportunities |
It may well be argued that little is gained from improving a process performance beyond the five sigma (233 DPM) level. It is felt that six sigma method applications can actually tolerate small shifts in the process mean and not increase the defect rate that significantly. With a six sigma process, we are assured that the process is still producing results within the desired specifications and with low defect rates. The six sigma process provides an added advantage by being easily monitored with any Quality Control (QC) procedure unlike a process at five sigma or lower sigma levels where the choice of QC procedure is more important.
In any process, variation is inherent. It is the variation in the process, which creates the opportunities for errors to happen, and therefore should be seen as the “enemy”.17 The concepts of variation are devised by Walter Shewart.18 These variations exist as two types in a process, common cause and special cause. The common cause variations are intrinsic to a process and require action on the process itself to decrease the variation, whereas special cause variation occurs due to factors extrinsic to the process, which require identification and action on these special causes. The key lies in minimizing this variation and producing a stable process. These stable processes exhibit common cause variation, which are best reduced by correcting the underlying process.19 It is the variation in a process that has to be minimized and controlled to achieve high quality results. The reduction in variation is also a core concern in clinical governance.11
Shewart18 also devised the control charts, a graphical methodology to differentiate the two types of variation. The defects occurring through the common cause variation fall within the upper and lower lines of the graph (control limits) and special cause variation are represented by the data points falling outside the control limits. Shewart18 suggested using limits set at three sigma from the mean. If beyond these points, it was suggested that the process required correction. If one were to apply the three sigma limits for accepting a process, it would translate into 66,807 DPM opportunities.
QUALITY AND BUSINESS BENEFITS
If six sigma quality initiatives are applied correctly, they offer a high level of quality at reduced costs. They bring with them a reduced cycle time with improved profits and a competitive edge in business. The managements may be wary at first to join the six sigma quality bandwagon, citing the high costs involved in its training and implementation. However, six sigma techniques, if wisely applied and practiced, are well worth every penny spent. With total organizational commitment, the six sigma techniques help achieve overall reduction in costs of the process. The benefits are often more than financial. An organization, which has successfully implemented six sigma techniques, can also boast of time efficient, effective and less chaotic work force that produces a higher degree of client satisfaction. The dollars spent on implementing six sigma are eventually realized by eliminating rework, reducing errors and increasing patient volume.20
The success stories of implementing six sigma are abundant. The results of successful implementation of six sigma methodologies have been reviewed and profiled by Scalise.21 Scalise documented the application of six sigma techniques in various hospitals in reducing emergency department wait times, improving the registration process, decreasing diagnostic lab delays, and improving the quality of heparin administration and subsequent monitoring. These are only a few areas where six sigma implementation resulted in savings ranging from $166,000-$406,000 annually. The savings generated by implementing six sigma techniques are a lot more in comparison to the costs incurred in training a ‘black belt’, the professional directing a six sigma project. The training costs may vary between $8,000-$20,000 depending upon the consultant support required and time spent by the executives/consultants to oversee the six sigma efforts. It is suggested that many of these costs are offset by training the staff onsite.20 The real potential of six sigma is best exemplified by an estimated $1.5 million in profits made by GE in 1999 because of six sigma application.22 The Malcolm Baldridge National Quality Award criteria describes how organizations are to use the measurement and analysis of performance through a data driven approach along with information, competitive comparisons and benchmarking information to improve their performance. The six sigma methodology may be an ideal strategy for clinical diagnostic laboratories to match up to these exacting criteria.
The six sigma methodology must be distinguished from ISO 9001, another international standard quality management system that is widely used.23 The ISO has recently published a new ISO 9001:2000 based ‘sector specific’ standard for use in medical laboratories. This new standard, ISO 15189:2003, ‘Medical laboratories-Particular requirements for quality and competence’, has been introduced in some clinical laboratories in Canada. As previously mentioned, a process performing at six sigma will have very few defects per million opportunities. The six sigma methodology sets a quantitative goal in everyday clinical laboratory performance and provides the clinical laboratories with the tools and concepts necessary for improving a process. The six sigma methodology is based on delivering consistent and reliable output through an effective strategy designed to eliminate variation associated with the output. The results associated with the successful implementation of six sigma are exponential in nature. The ISO 9001 model is the quality management system that prescribes basic compliance to the standard. The ISO model fails in comparison with the six sigma in ensuring an efficient and effective performance of a system or a process. In addition, the ISO model fails to guarantee that processes will provide consistent high quality output. The ISO 9001 provides the foundation for organizations that do not have a quality system. It offers a measure of protection to an organization that is looking to establish and define standards necessary to meet customer requirements. The importance of six sigma methodology over ISO 9001 quality management system lies in that it is a ‘breakthrough’ management strategy that focuses on continuous improvement in processes. At best, we believe that six sigma, a quality improvement tool, can be used along with ISO 9001, a quality management system, to enhance the overall quality of a process and achieve dramatic results.
THE SIX SIGMA STRUCTURE
The central theme of any six sigma project is improving a process. It is suggested that any organization before implementing six sigma in a big way must use six sigma strategies on a smaller scale. This provides an opportunity of learning the methodology and better implementation for bigger and more important projects ahead. Every organization is different and has its own unique demands and structure. This justifies the different six sigma approaches employed by organizations. Whatever the organizational approach, the foundation for deploying a successful six sigma strategy lies primarily on a sound and effective infrastructure and a strong management support. The infrastructure itself may determine the scope and impact of six sigma strategies in enhancing quality and profits. Another important component is training personnel, who after a short period of training assume various roles as Champions, Master Black Belts (MBB), Black Belts and Green Belts. The personnel with these unfamiliar and intimidating titles play key roles in actual implementation of six sigma projects. The intimidating titles may be coined as a just reflection of the power a six sigma approach wields in influencing the quality of a process.
The Champions are at the higher end of the hierarchy, usually a high-level executive or division head who is fully responsible for quality issues and quality improvement of the organization. Their role is particularly critical in the initial stages of six sigma implementation, where the project may experience technical and administrative hitches. Master Black Belts as the name suggests are involved in training the Black Belts. Besides training, they provide technical consultation and leadership to Black Belts. Master Black Belts are experts in six sigma analytical tools and have a critical role in sustaining the momentum of change, quality enhancement and cost savings. The Black Belts are also involved full time with six sigma projects and direct these projects, focusing on finding the defects and eliminating them totally from the process. It can be safely argued that a Black Belt’s role is the most critical of all, as they are the inspiration and driving force behind all the process improvements. The Black Belts provide leadership to many six sigma projects in a year. The Green Belts also receive six sigma training and are involved with the projects only parttime as an additional duty, with a regular job and accompanying normal duties. The Green Belts do however play a crucial role in bringing the concept and analytical tools of six sigma training directly to everyday activities of the work and the process. It is principally for this reason that organizations desiring greater success in the six sigma projects think about training a large segment of their work force to be Green Belts. Six sigma totally involves every stage in an organizational hierarchy by the top most level providing the leadership and the bottom level driving the whole process.
The performance improvement methodology or model used in six sigma is most often ‘DMAIC’ (Define, Measure, Analyze, Improve, Control). Each letter standing for one of the different stages involved in the implementation of a six sigma strategy. Though other methodologies also exist to implement six sigma strategies, they are practiced by a few and hence will be discussed briefly later. When six sigma is referred to, it is invariably the ‘DMAIC’ methodology that is being mentioned (Figure 1). This is a stepwise graded approach in enhancing quality of a process to produce the desired goals. The various stages are: Define–the problem with the process; goals, the project intends to achieve; custom deliverables and any other components essential to quality. Measure–the process quantitatively, which is best achieved by data gathering. It helps in assessing the current performance levels and comparison with the best practices. Analyze–adapts a root cause analysis approach to determine where the problem is originating and which problem is contributing majorly to deteoriating quality of the process. Improve–the process by eliminating the defects through identification of causes. Control–the process, so that the improvements are sustained and defects do not re-emerge later. It should be re-emphasized here that through the ‘DMAIC’ approach the six sigma quality improvement strategies aid in achieving a very low number of DPM opportunities, ideally equal to 3.4 DPM opportunities, which betters 99% performance levels by being 99.9997% perfect all the time. Such a high level of perfection eventually means higher efficiency leading to reduced costs, efforts, time and overall client satisfaction.
Figure 1: The Stepwise“DMAIC” Approach in Enhancing Quality
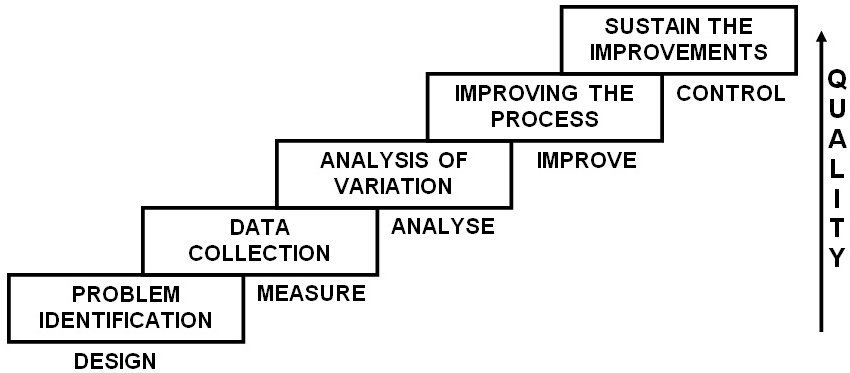
Apart from the ‘DMAIC’ methodology, which is essentially used for a pre existing process that is defective, the ‘DMADV’ (Define, Measure, Analyze, Design, Verify) methodology is used when a new process is being developed or a pre existing defective process has failed even the ‘DMAIC’ correction. In the ‘DMADV’ approach, the goals and methods are similar to ‘DMAIC’, i.e. to reduce defects to levels below 3.4 DPM opportunities and data driven respectively. The difference lies only in the last two steps, ‘Design’ – detailed design of the process to meet the customer needs and ‘Verify’- the design performance and its ability in meeting the customer needs. There are other less commonly used methodologies like ‘DMADOV’ (Define, Measure, Analyze, Design, Optimize, Verify) a variant of ‘DMADV’; ‘DCCDI’ (Define, Customer Concept, Design, Implement); ‘IDOV’ (Identify, Design, Optimize, Validate) and ‘DMEDI’ (Define, Measure, Explore, Develop, Implement).
QUALITY IN CLINICAL DIAGNOSTIC LABORATORIES
Clinical diagnostic laboratories play a critical role in the diagnosis of many human diseases; it has been doing so for decade’s now.24 Laboratory testing influences a majority of clinical decision-making. With such a high degree of influence, it is not difficult to fathom the importance of quality in laboratory testing. In today’s healthcare environment of managed care and cost containment processes, laboratorians have to work collaboratively with other healthcare professionals, the sole focus being on improvement in medical outcomes. It has been suggested that the importance of laboratorians must be proven in guaranteeing the quality of tests and improved quality of the services.25 In a healthcare delivery system that is interdependent on other departments, where the quality of one department has an effect on another, it becomes essential for clinical diagnostic laboratories to set high standards and raise the bar for other departments to follow.
Statistical QC was first introduced in clinical laboratories by Levey and Jennings26 in 1950. The QC gained wide acceptance in later years and most laboratories adopted it as a standard of practice by 1960’s. Laboratory medicine has been at the forefront of many quality improvement initiatives since then. It has been demonstrated previously that modern quality tools and techniques have been applied to improve medical processes by finding the causes as well as solutions to the defects plaguing the system.27,28
In clinical diagnostic laboratories, the mistakes and blunders contribute primarily to erroneous laboratory results. The precise magnitude of the error rate is difficult to determine for two important reasons, under-reporting or a complete lack of feedback and difficulty in error detection. The standard practice followed by laboratories to report quality indicator data is as percent variance. This most often yields very low values and pushes the laboratories into an exaggerated sense of good quality performance. Despite the low error rates, the magnitude of usage of clinical laboratories in healthcare is so high, that even the low variances translate into a very high number of defects as a small percentage of a big number can itself be a big number.29 It is in such instances that the true value of adopting six sigma quality initiatives can be appreciated. It should also be noted that in the six sigma methodology, the errors are expressed as rates and not as absolute numbers.
The research on error and blunder rates in clinical diagnostic laboratories is scarce. However, the few studies that have been reported give varying results. McSwiney and Woodrow30 reported a 2-3% blunder rate. This was followed by another study that detected a blunder rate of 0.3% in a large clinical biochemistry laboratory.31 Kazmierczak and Catrou32 reported a total error rate of 9.36% in their study of 438 results of replicate creatinine analysis. Lapworth and Teal33 reported a blunder rate of less than 0.1% of requests in their study lasting over a year in two district laboratories in the United Kingdom. The study reported nearly 120 blunders committed in a total of approximately one million test results, which translated into approximately 120 DPM opportunities (Other related study results and corresponding DPM are shown in Table 3). In Australian chemical pathology laboratories the reported error rates have been as high as 39% for transcription and 26% for analytical results, with the best laboratory performing error free business only 95% of the time.34 This high rate of errors occurring in the laboratories is much worse than the 16.6% predicted rate of adverse events occurring in hospital admissions of Australia.35 Witte et al27 reported 447 DPM unacceptable results (results differing from expected values byblunder rate of less than 0.1% of requests in their study lasting over a year in two district laboratories in the United Kingdom. The study reported nearly 120 blunders committed in a total of approximately one million test results, which translated into approximately 120 DPM opportunities (Other related study results and corresponding DPM are shown in Table 3). In Australian chemical pathology laboratories the reported error rates have been as high as 39% for transcription and 26% for analytical results, with the best laboratory performing error free business only 95% of the time.34 This high rate of errors occurring in the laboratories is much worse than the 16.6% predicted rate of adverse events occurring in hospital admissions of Australia.35 Witte et al27 reported 447 DPM unacceptable results (results differing from expected values by<7 SDs or Coefficient of Variations) and suggested these to be a result of special cause variation. The authors suggested that the results, which were likely to alter patient care, occurred at a rate of 41 DPM opportunities. Another study on errors in a stat laboratory revealed a relative frequency of 0.47% in 3 months at various departments of a University Hospital.28 An error rate of 0.38 % was reported in clinical genetic testing laboratories during a 10-year period.36 In a Thai clinical laboratory with ISO 9002:1994 certification at a large hospital, a total error rate of 0.13% was detected.37 Bonini et al38 studied the laboratory testing error rates in in- and out-patients, they reported an error rate of 0.60% and 0.039% respectively. The authors attributed the large difference in the two settings primarily due to lower skill of ward staff in blood drawing, higher complexity of tests performed and also higher frequency of blood drawings for inpatients. More recently Ismail et al39 reported a total error rate of 0.53% in the analytical phase of common immunoassay tests for Thyroid Stimulating Hormones (TSH) and Gonadotropins. The authors concluded that these errors were a result of analytical interference and stressed on early identification of interference in cases with results not compatible with the clinical scenario. Marks40 studied the influence of analytical interference on assays of 74 analytes. A total of 66 laboratories across seven countries participated in the study. Marks observed 8.7 % of the results to be erroneous and 49% of these were not corrected even by the addition of a blocking reagent.
Table 3. Review of Error Rates in Clinical Diagnostic Laboratories Represented in Defects per Million Opportunities and Six Sigma Scale
|
Authors
|
Study Design
|
Total Analytes/Results
|
Error Rates1
|
DPMO*
|
Sigma Level
|
Data Collection Period
|
| Chambers et al31,1986 |
Prospective |
Data not available |
0.3%
|
NA
|
NA
|
9 Weeks
|
| Kazmierczak and Catrou32, 1993 |
Prospective |
438
|
9.36%
|
93,607
|
2.82
|
8 Days
|
| Lapworth and Teal33, 1994 |
Prospective |
998,018
|
< 0.1%
|
120
|
5.17 |
1 Year
|
| Plebani and Carraro28, 1997 |
Prospective |
40,490
|
0.47%
|
4,668
|
4.10
|
3 Months
|
| Witte et al27, 1997 |
Retrospective
|
219,353
|
0.08%
|
807
|
4.65
|
18 Years 6 Months
|
| Hofgartner and Tait36, 1999 |
Retrospective
|
4,2342
88,3943
|
0.38%2
0.33%3
|
3,7792
3,3373
|
4.172
4.213
|
10 Years2
1 Year3
|
| Wiwanitkit35, 2001 |
Prospective |
941,902
|
0.13%
|
1,316
|
4.51
|
6 Months
|
| Marks40, 2002 |
Prospective |
3,445
|
8.7%
|
8,7,083
|
2.86
|
NA
|
| Ismail et al39, 2002 |
Prospective |
5,310
|
0.53%
|
5,273
|
4.06
|
NA
|
| NA- Not Applicable. *Defects per Million Opportunities
1Different authors have used different terminologies (i.e. errors, mistakes, blunders, outliers, problems, unacceptable results).
2Inspected laboratories.
3Data collected through a survey questionnaire. |
Clinicians overwhelmingly rely on data generated by laboratory to aid in their clinical decisions. They assume that laboratorians being trained in QC and Quality assurance (QA) detect errors before the reports leave a laboratory. Identification of random errors such as interferences occurring in a laboratory is difficult to detect and may affect patient care; Marks40 advised clinicians to be aware of these limitations of a laboratory. A clear and direct communication between the laboratorians and a clinician regarding doubtful results and clinically suspect results may be a simple and safe way of promoting quality care to the patients.
The results from studies on errors in clinical diagnostic laboratories give a wide range of rate of errors, varying from 0.1%33 to 9.36%32 with an Australian study reporting an error rate as high as 39% for transcription errors alone.34 Various reasons may be attributed to this difference in the rates of error cited by the different studies. It may be due to the different study designs adopted, prospective and retrospective. A second reason may be due to the variability of the process itself at the specific time with some laboratories performing at their peak quality level and others performing at their worst levels. A third reason may be the different criteria adopted by authors to define an error itself, with some being very strict in their definition and others being relatively lenient. A fourth factor may be due to the nonuniform method of choosing a laboratory for their study, with some laboratories having high quality standards as compared to others. Therefore, some chosen laboratories may be performing exceptionally with regards to quality while others may be under-performing. The fifth reason may be due to imperfect error detection methods employed by laboratories, where some errors that may have occurred have not been reported at all. Whatever the limitations of the reported data, the fact remains that clinical diagnostic laboratories are error prone and abundant opportunities for improvements in the process exist. These improvements may translate into beneficial outcomes to the patients.
A standard laboratory process is usually divided into 3 stages: Pre-analytical, Analytical and Post-analytical. An error at any step during the acquisition, processing and analysis of a specimen, and reporting of a laboratory result can invalidate the quality of analysis and cause the laboratory to fall short of its quality goals.41 The types of errors detected in clinical laboratory services are similar both in the UK and America.30,42 The geographical similarities apart, a majority of the literature on error rates in clinical laboratories has agreed on one other point: the analytical stage of clinical laboratories is more efficient and leagues ahead in quality performance than the other two stages. Lapworth and Teal33 quote an approximate 32% of total errors occurring in the analytical stage, mainly due to wrong patient sample analysis. Khoury et al34 studied the rate of transcription and analytical errors in Australian chemical pathology laboratories and reported error rates as high as 39% in transcription of reports in comparison with a highest rate of 26% for analytical results attributed to the worst performing laboratory. Plebani and Carraro28 estimated a huge 68.2% of errors occurring in the pre-analytical stage of testing, 18.5% in the post-analytical and 13.3% in the analytical stage of a laboratory process. In the clinical genetic testing laboratories, 60% of errors were in the pre-analytical phase, 32% in the analytical phase and a mere 8% in the post-analytical phase.36 However, a study by Kazmierczak and Catrou32 presents a different view. The authors suggested that a phenomenal 95% of the errors in the study could be attributed to the analytical stage of testing, though the criteria adopted by them to classify an error could be termed rather strict. Wiwanitkit37 studied the types and frequency of pre-analytical errors in a large hospital laboratory. The study revealed an approximate 85% of errors occurring in the pre-analytical stage and a mere 4.35% of errors occurring in the analytical stage.
The quality cycle in a laboratory is not dependent on the control of analytical processes alone. The precision and accuracy of reported laboratory results, in addition to the analytical stage are also dependent on the pre- and post-analytical stages of the testing process. The high rates of pre- and post-analytical errors necessitate the involvement of non-laboratory personnel including clinicians to improve the quality of laboratory results. The heavy balance of errors occurring in the pre- and postanalytical stages of a laboratory testing process re-confirm the susceptibility of a process to human error. It has been estimated that up to 97% of mistakes occurring in laboratory processes result from human error.43 It is therefore suggested that clinical laboratories should employ maximum automation and robotics and minimize human involvement in the process wherever possible. In fact, the use of automated systems reduces the Risk Priority Number (RPN) from 5304 in manual systems to 129 and also demonstrated a 90% to 98% reduction in the defect opportunities.44 The laboratory automation provides for standardized workflow and helps eliminate many error prone steps undertaken by humans. In doing so, it provides an opportunity for processes to escape the influence of human factors like stress, fatigue, negligence and cognitive impairment. In addition, they enhance the quality of a laboratory result and reduce the turnaround times of results.
QUALITY FAILINGS- PITFALLS, BARRIERS AND OPPORTUNITIES
Like any other system, clinical diagnostic laboratories also face numerous barriers in developing and implementing a quality agenda. However, the precise knowledge and delineation of each and every step in a laboratory process and prior experience with using and analyzing statistical data for quality improvement activities allows for some comfort. Clinical laboratories have the advantage of relatively well defined laboratory processes and prior experience with using and analyzing statistical data for quality improvement activities. This advantage, which is not enjoyed by any other healthcare sector, offsets some of the barriers faced by clinical diagnostic laboratories.
A principal barrier is the inadequacy of research to provide a universally accepted definition of error. This makes it difficult to comprehend, as what actually constitutes a ‘tolerable error’ in clinical laboratories. The clinical diagnostic laboratories work in an atmosphere of cost constraints, which poses a second barrier. This in turn does not bode well for quality promotion and enhancement activities. A third barrier is posed by the attitude of laboratory personnel towards quality. An already overworked and tired laboratory workforce views the quality aspects of a laboratory process as ‘extra work’, which interferes with their actual jobs. Imbibing quality aspects in the work culture and offering incentives for quality promotion activities and achievements may help bring an attitude transformation. Another barrier may be a sense of complacency towards quality. Adopting and developing newer quality improvement tools and methodologies may help us realize how far we are from the ideal rates of quality. The most important barrier is the limited control exercised by clinical diagnostic laboratories in the most influential part of the laboratory testing process, the pre-analytical phase. As reviewed earlier, a majority of errors are occurring in this stage. What a laboratory analyses is actually what it is delivered, therefore the pre-analytical factors have a direct bearing on the analytical and post-analytical stages of the testing process. This influence of the pre-analytical stage of a testing process is not only restricted to a centralized laboratory model but also to Point of Care Testing (POCT). In a well-reviewed paper on the various aspects of POCT, St-Louis45 has stressed the demands that the POCT presents in terms of quality and the importance of QA to address all phases of a test performance.
Six sigma can be applied widely in all the three stages of a clinical diagnostic laboratory testing process. In the preanalytical stage, it can be used to enhance quality of information on requisitions, patient identification, specimen collection and transportation. In the analytical stage, it can find applications in reducing laboratory testing errors, misinterpretation, misreading and misjudging of the results. Vanker et al46 in their retrospective study have highlighted the clinical impact of errors made during the pre-analytical phase. They used the six sigma guideline to test the laboratory information system and reported significant number of errors (72 errors in 47543 tests, equating to a six sigma score of 4.46) that occur in the pre-analytical phase. Also, use of six sigma quality improvement techniques by a team from the Uganda Makerere University in their clinical laboratory led to a 60.5% error reduction in data entry from 423 errors (4.34 Six sigma) to 166 error a month (4.65 Six sigma). The reduction in 257 errors per month led to savings of $50,115 on an annual basis.47 In the post-analytical stage, it can be used successfully to reduce the turnaround time of the results.
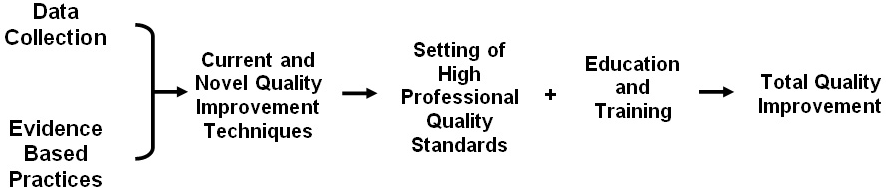
Previous research in this field has failed to provide us with clear directions for improving quality in our laboratories. It has, rather inadvertently, focused on descriptive statistics and fallen short of exposing the real underlying issues of quality failures. These failures and barriers offer abundant opportunities for further research and development of processes that are efficient and of high quality. In summary, quality in clinical laboratories is driven by application of data driven approaches and evidence based practices (Figure 2). This approach along with our previously suggested ‘no-fault’ error reporting model helps in setting up high professional quality standards, and coupled with education and training helps transform a laboratory culture into a ‘Quality Conscious’ setting.48,49
Figure 2: Factors Driving Quality in Clinical Diagnostic Laboratories
CONCLUSIONS
It is imperative for the healthcare sector in general and clinical diagnostic laboratories in particular to promote and develop a culture of safety with the aid of modern quality management techniques and tools. The present day quality assurance and improvement activities in clinical laboratories are governed by the Clinical Laboratory Improvement Amendments of 1988 (CLIA’88) and Joint Commission on Accreditation of Healthcare Organizations (JCAHO) guidelines. However, it must be mentioned that the influence of CLIA’88 and JCAHO guidelines is largely confined to clinical laboratories in the United States of America and may not apply to clinical laboratories in Canada and elsewhere. The criteria of CLIA’88 and JCAHO though highly effective are not very demanding for analytical performance and are based on two sigma to three sigma process goals only. The goals of six sigma quality are impressive and set demanding standards which appear to be more compatible with patient safety. In addition, the present day philosophy of quality assurance being ‘find a problem, fix a problem’ is not feasible and significant improvements in laboratory performance call for more systematic approaches.29 The six sigma concept provides an opportunity for major improvements and helps achieve the vision of ultimate quality to deliver error free and timely clinical diagnostic laboratory services.
CONFLICT OF INTEREST
The authors have no conflict of interest.


