INTRODUCTION
Grain legumes are rich and less expensive sources of dietary proteins and water-soluble vitamins. Legumes contain twice as much protein as cereals and, except for the sulphur-containing amino acids (methionine and cystine which are adequate in cereals) the amino-acid profile of most legumes complement those of cereals.1 Among the legumes, cowpea is believed to be the most widely grown, distributed and traded food commodity in Africa.2 Cowpea, like other grain legumes, is an important foodstuff in tropical and subtropical countries.3 Nutrients provided by cowpea make it extremely valuable where many people cannot afford proteins from animal sources such as meat and fish.4 Cowpea also cultivated in Ethiopia and use for traditional food preparation and animal feed as a meat source. It is well adapted to the stressful growing condition of the tropics and has excellent nutritional qualities.
Extrusion combines a number of unit operation i.e. mixing, cooking, shearing, puffing, final shaping and drying in one energy efficient rapid continues process5 and can be used to reduce a wide variety of starchy foods including snacks, ready to eat (RTE), confectioners, and extruded crispbreads. This process of hightemperature short time extrusion brings gelatinization of starch, denaturation of protein, modification of lipid and inactivation of enzymes, microbes and many anti-nutritional factors.6 The aim of this research was to develop and evaluate the substitution of wheat by cowpea and then investigate the quality of value-added products.
MATERIALS AND METHODS
Sample Collection, Transportation, Preparation and Storage
Cowpea samples were collected from Measo Agricultural Research and Satellite Center, and hard wheat variety was obtained from Debrezeit Agricultural Research Center. All research samples were packed with polyethylene plastic bags and stored at dry condition in the room temperature at food engineering laboratory for further use.
Blend Formulation
The cowpea grains were steeped in tap water at 28 °C and decorticated. De-hull cowpea grain was dried at 52 °C and milled with laboratory miller (CIT-LDM-15, USA) sieve size of 750 µm.7 Blended flour for cowpea and wheat flour were prepared as B0 (0:100), B1 (90:10), B2 (40:60), B3 (65:35), B4 (78:22), B5 (53:47), B6 (100:0)(wheat to cowpea flour), respectively using D-optimal mixture software.
Biscuit Products Development
The various blends formulated from a mixture of cowpea and wheat flours were mixed separately with the same quantity of other ingredients (350 g flour, 115 g sugar, 50 mL baking fat, 10 g milk powder, 0.25 mL vanilla, 1.75 g salt, 71 mL water and baking powder 2 g) adapted from Gamal et al.8 The fat was creamed with sugar until fluffy, and other ingredients were also added. The batter was kneaded on a rolling table to acquire the desired thickness. The batter was later cut to square shape with the aid of knife cutter. It was baked in the oven at 205 °C for 10-minutes, cooled and packaged for further use.
Extrusion Process
The blended samples were also fed manually through a rotatable and screw operated conical hopper using Twin-screw extruder (Clextral, 42702 Firmly, France). The hopper, which was mounted vertically above the end of the extruder, equipped with a screw speed which was adjusted to 7 and 8 rpm and water pump stoke level adjusted to give 18 and 21% feed moisture; respectively. The blended flour was extruded at a screw speed of 175 and 200 rpm, barrel temperature (100, 110,120 °C), and feed moisture (18 and 21%) with 1.0 mm die diameter of extrusion. The barrel temperature at zone three was controlled with a temperature sensor probe fit which is controlled by cold water motorize pump. Experimental samples were collected when a steady state (constant temperature and torque) was achieved. The extrudate products were kept on aluminum foil with benches to dry. Finally, all samples were packaged in polyethylene bags for further analysis.
Analyses Methods
Flour quality analysis
pH of flour: The pH values of the blended flours were determined using the official association of analytical communities (AOAC) method.9 About 20 g blended flour sample was put into 100 mL of distilled water and the supernatant was poured into another measuring cylinder. Finally, the pH of the homogenate was measured at room temperature with Jenway, UK, 3505 pH meter.
Water absorption (WAI) capacity: WAI capacity was determined using a method described by Solusulski.10
Foaming capacity and foam stability: Foaming capacity and foam stability was determined according to the method described by Ohizua ER et al.11
Bulk density and dispersibility of flour: According to Narayana K. and Narasinga Rao, bulk density of flour was determined with leveled flask tube which was weighed and filled with a sample to 5 mL by constant tapping until there was no further change in volume.12 Bulk density was calculated as the mean of the triplicate determination of the weight determined by difference per unit volume of the sample. Dispersibility of blended flour in water was also determined with accurately weighed 10 g of each flour sample was placed in a 100 mL measuring cylinder followed by addition of distilled water up to the 100 mL mark. The sample was vigorously stirred, mixed and next allowed to settle for 3 hr. The volume of the settled particles was recorded and subtracted from 100 to give a difference which is considered as percentage dispersibility of each blended flours.13
Proximate composition analysis: Moisture content, crude fat, crude protein, ash, the crude fiber of sample was determined according to AOAC official method number 925.10, 920.39, 992.15 (39.1.16), 923.03 (32.1.05) and 978.10; respectively.9
Mineral concentration: The method described by AOAC official method number 984.27, using atomic absorption spectrophotometer (AAS) (Shimadzu, 7000, Japan) was used for mineral contents determination.9 The minerals determine were iron, magnesium, calcium and zinc at 248.52 λ, 285.49 λ, 422.81 λ, and 214.11 λ; respectively.
Bioactive compounds: Phytate content was determined based on complex formation of phytic acid and Fe (III)-ion at pH 1-2, after extraction in 1.2% hydrogen chloride (HCl) solution containing 10% Na2 SO4 as described by Thompson and Erdman (1980).
An excess of Fe (III)-ion present in the solution would react with thiocyanate ion to form a characteristic pink complex, Fe (SCN). The optical density at 465 nm was measured,14 and an inverse linear relation was found for phytate concentration from 40 to 200 nmol/L.
About 0.2 g of the sample was placed in 100 mL conical flask to determined tannin. Ten milliliters 1% HCl in methanol (v/v.) was added. The contents were mechanically shaken for 20 minutes and centrifuged at 2500 rpm for 5-minutes. One milliliter of supernatant was pipetted into a test tube and 5 mL of vanillinHCl regent (mixing equal volume of 8% concentrated HCl in methanol and 1% vanillin in methanol) were added according to price et al.15 The optical density was read using a colorimeter. At 500 nm after 20-minutes’ incubation at 30 °C, a blank sample was carried out with each run of samples. A standard curve was prepared to express the result as catechin equivalents, i.e. amount of catechin equivalent expressed in mg per mL which gives color intensity equivalent to that given by tannin after correcting for blank. Then the tannins amount calculate as follows:
Tannins (mg/100 g) =Ad×wt.s×10 Eq(1)
Biscuit quality assessment: Bulk density, WAI, and water solubility index (WSI) were determined using a method described by Solusulski.10 Fracture strength of biscuits was measured with the Texture Analyzer (Model TA-XT2i, Stable Microsystems, Haslemere, U.K, 2014) using a 2-point Bending Rig and 5 kg load cell. The distance between the two beams was 40 mm. Another identical beam was brought down at a pre-test speed of 1.0 mm/s, test speed of 3.0 mm/s, post-test speed of 10.0 mm/s. The downward movement was continued until the biscuit broken. The peak force that used to crash was reported as fracture strength expressed in Newton.
Quality evaluation of ready-to-eat extruded products Bulk density (ρb): The bulk density of the extruded product was calculated after measuring weight, length, and diameter of the extrudate immediately after extrusion.16
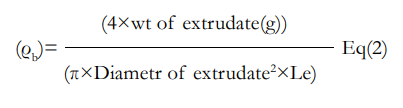
Where: Le=length of extrudate
Degree of expansion: The diameter of the extrudate was measured with an electronic digital caliper and also the weight of extrudate was measured by a digital balance. The degree of expansion (expansion ratio) (diametrically) was defined as the ratio of the diameter of the extrudate to the diameter of the die hole.16
Water absorption (WAI) and water solubility index (WSI): WAI and WSI were determined using a method described by Solusulski.10
Where:
Wrac=Weight of residue after centrifuge
Wcad=Weight of crucible after drying
Wec=Weight of empty crucible
Microbiological Analysis
The microbiological analysis (total aerobic bacteria, yeast, and molds) sample was also carried out.17 Plate count agar (PCA) and potato dextrose agar (PDA) was used for enumeration of bacteria, yeast, and mold; respectively.
Sensory Quality Attributes
The biscuit and extrudate samples with controls were presented separately for 36 semi-trained panelists in food engineering laboratory for sensory acceptance tests. All samples were tested by each individual of untrained panelist for color, appearance, flavor/aroma, crispness, and overall acceptability. The samples were evaluated on nine (9) hedonic scale method as described by Ihekoronye et al.18
Experiential Research Design and Statistical Data Analysis
A completely randomized design experiment was applied in the evaluation of grain quality analysis, flour quality analysis, and biscuit samples quality evaluation with one factor (blending ratio) in order to minimize unknown and uncontrolled factors or variables.
For the extrudate also used a mixed general full factorial design (3×2×2) experiment. Mixed general factorial design experiment was used to study the main factors affecting the drying process in the experiment namely, barrel temperature (100 °C, 110 °C and 120 °C), feed moisture (18% and 21%) and screw speed (175 rpm and 220 rpm) and interaction between the main factors at 95% confidence interval for the final extruded product. Oneway analysis of variance (ANOVA) was used to for comparison of means (p<0.05). All data were expressed mean with standard deviation and list of significance difference (LSD) analyzed using statistical package for social scientists 20.0 (SPSS), and design expert version 7.0 software.
RESULTS AND DISCUSSION
Physical Properties of Cowpea Grains
The physical properties of the bole cowpea grains such as density, WAI, hydration capacity and index, swelling capacity and index, hydration coefficient, swelling coefficient, mass of seed coat, soak ability and cooking time studies were 1.200 g /mL, 93.27%, 0.151 g/seed, 1.507, 0.16 mL/seed, 0.800, 2.195, 2.255, 0.402/10 g, 100% and 13-minutes; respectively (Table 1).
| Table 1. Physical Properties of Cowpea Grains |
|
Physical Property
|
Mean±SD |
| 100 seed/kernel mass (g) |
17.185±0.460
|
|
100 seed/kernel volume (mL)
|
14.333±0.577 |
| Seed density (g/mL) |
1.200±0.056
|
|
Water absorption (%)
|
93.270±1.260 |
| Hydration capacity (g/seed) |
0.151±0.008
|
|
Swelling capacity (mL/seed)
|
0.160±0.029 |
| Swelling index |
0.800±0.144
|
|
Hydration coefficient
|
2.195±0.059 |
| Swelling coefficient |
2.255±0.135
|
|
Mass of seed coat/10g
|
0.402±0.032 |
| Seed soak ability (%) |
100
|
|
Cooking time (min)
|
13±1
|
| All results are expressed as means±standard deviation (SD) with triplicate determination |
The physical properties of the seed are a useful tool to know to handle, transporting and processing equipment design and system as well as to determine the amount of water required for processing from raw material up to end products. The density of bole cowpea grain is a measure of hardness and heaviness which is related to machine operation, yield during flour production, water consumption in wet processing, power consumption, de-huller design, separator equipment design, and determine handling and storage material selection as well as equipment design. All these physical properties are used in predicting the grain machine operation condition.19
The amount of seed coat of bole cowpea is 4% (w/w), this indicate the nature of the cowpea is more solids and less waste (hull) which has advantages in flour production yield. Hydration capacity and swelling capacity is also an important parameter in order to determine the cooking time and the energy required to process.20 Higher values of hydration capacity and swelling capacity shows that less cooking time, which is better cooking quality and less energy consumption. Soak ability of bole cowpea was determined as 100%. These values show bole cowpea has no non-soak ability seeds which indicate a higher flour yield and best quality of seed. Cooking time also an important parameter in order to predict the amount of energy consumption as well as energy cost during processing.20
Physical Properties of Blended Flours
Cowpea flour and wheat flour blends B0, B1, B2, B3, B4, B5, and B6 of Physical properties studies were presented in below Table 2 pH, bulk density, and dispersibility of cowpea flour and its blends was range from 6.31 to 6.70, 0.60 to 0.79, and 71.50 to 76.00; respectively. The pH was indicating the nature of the flour which is around neutral pH zone and it’s may need good packaging’s and storage controlled condition to prevent microbial growth and flour damage. Bulk density also useful tool to related and determine to the design of storage equipment, transport and flow rates of the flour.19 Bulk density mainly affected by internal moisture and particle size of the samples.21 The coarse particle size of flour was a lower bulk density and fine particle size had a higher bulk density as well as a higher moisture content of flour may also increase bulk density due to a little incremental of flour weight. The cowpea flour has a higher bulk density 0.791±0.031, which means, it has a fine flour particle size and higher moisture content.
| Table 2. Physical Properties of Blended Flour Samples |
|
Sample Code
|
Physical Properties |
|
pH
|
Bulk Density (g/mL)
|
Dispersbility (%)
|
| B0 |
6.70±0.020a |
0.791±0.031a
|
75.500±3.109a
|
|
B1
|
6.34±0.010d |
0.693±0.035b |
68.500±2.121c |
| B2 |
6.56±0.032b |
0.601±0.061c
|
76.000±1.414a
|
|
B3
|
6.49±0.015bc |
0.693±0.026bc |
73.500±2.121ab |
| B4 |
6.44±0.026c |
0.773±0.009ab
|
74.000±2.828ab
|
|
B5
|
6.54±0.049b |
0.757±0.017ab |
73.500±0.707ab |
| B6 |
6.31±0.015d |
0.688±0.025bc
|
71.500±0.707bc
|
| a-dAll results are expressed as means±standard deviation with triplicate determination. Values expressed with similar subscripts are not significantly different by Duncan multiple range Test across columns (p<0.05).
Where: B0 (0:100), B1 (90:10), B2 (40:60), B3 (65:35), B4 (78:22), B5 (53:47), B6 (100:0) (wheat to cowpea flour); respectively. |
Dispersibility blended flour showed that there was no significant difference between B0 (100% cowpea flour) and B2 (40% wheat and 60% cowpea flour). As well as there were no significant difference across the column among B3 (65% of wheat and 35% of cowpea flour), B4 (78% of wheat and 22% of cowpea flour) and B5 (53% of wheat and 47% of cowpea flour). But, there were a significant difference between B0 (100% cowpea flour), B1 (90% of wheat and 10% of cowpea flour) and B6 (100% of wheat flour). Dispersibility of B2 blended flour was higher values among the other, it shows that the flour has higher WAI and the dough will easily reconstitute to give fine consistency during mixing and baking in different baked products. Hundred percent of wheat flour dispersibility was lower than 100% of cowpea flour and its wheat and cowpea flour composite, however, all dispersibility values of blended flour has relatively higher, hence the dough was easily constituting during mixing.22
Functional Properties of Blended Flour
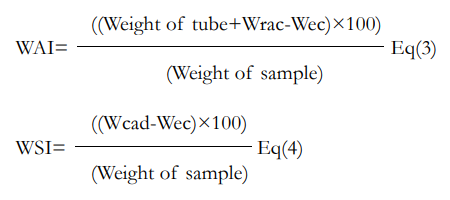
The WAI capacity of the blended flour was presented in Where: B0 (0:100), B1 (90:10), B2 (40:60), B3 (65:35), B4 (78:22), B5 (53:47), B6 (100:0) (wheat to cowpea flour); respectively.
Figure 1, WAI capacity higher in B1 and lower in B5 which is 56.649% and 52.100%, respectively. This result shows a significant difference and has an effect on yield and consistency of flour dough. The WAI capacity of flour determined the amount of water absorbed and hold by starch granules and indicates the integrity of starch in aqueous phase dispersions. WAI capacity also related to hydrophilic properties of starch and protein in the flour and indicates a higher WAI capacity helps to improve food consistency and yield in food preparation.23
Figure 1. Water Absorption Capacity of Blended Flour Samples
Where: B0 (0:100), B1 (90:10), B2 (40:60), B3 (65:35), B4 (78:22), B5 (53:47), B6 (100:0) (wheat to cowpea flour); respectively.
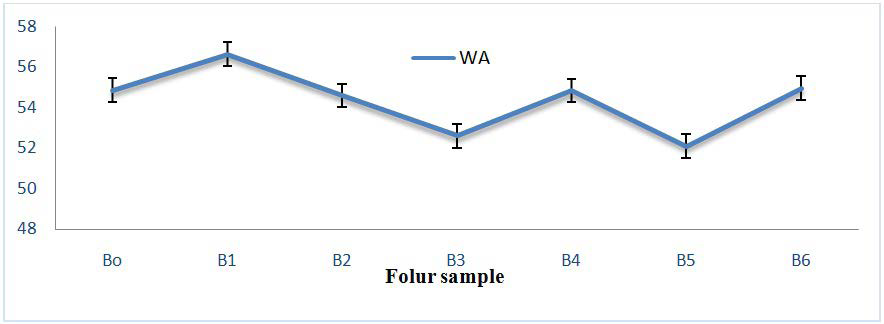
Functional properties of the blended flour especially foam capacity and foam stability are dependent on the configuration of flexible protein molecules which have a good foaming capacity. But large conjugated globular protein molecules give low foam formation capacity.24 Foaming properties are also dependent on the amount of carbohydrate present in the flour besides of water-dispersible protein.23 This enables to form interfacial films on the upper surface and maintain air bubbles in suspension and slows down the rate of coalescence. Food ingredients with good foaming capacity and stability can be used in bakery products to improve texture, consistency, and appearance of foods.25 This study shows that 100% cowpea flour (B0) and 65% of wheat and 35% cowpea blend flour (B3) had higher foam stability and capacity (Figure 2). Besides this, cowpea flour had higher foaming properties. Because, it contains free water dispersible nitrogen and carbohydrates. It plied an important role in bakery products to enhance sensory qualities. The pure cowpea flour foam capacity was 21.05% and foam stability was 7.89% after 40-minutes stability time. This finding is also in agreement with reported by Peter.25 But, the concentration of the cowpea flour increased in wheat flour foam capacity and foam capacity was decreased.
Figure 2. Foam Capacity (FC) and Foam Stability (FS) of Blended Flour Samples
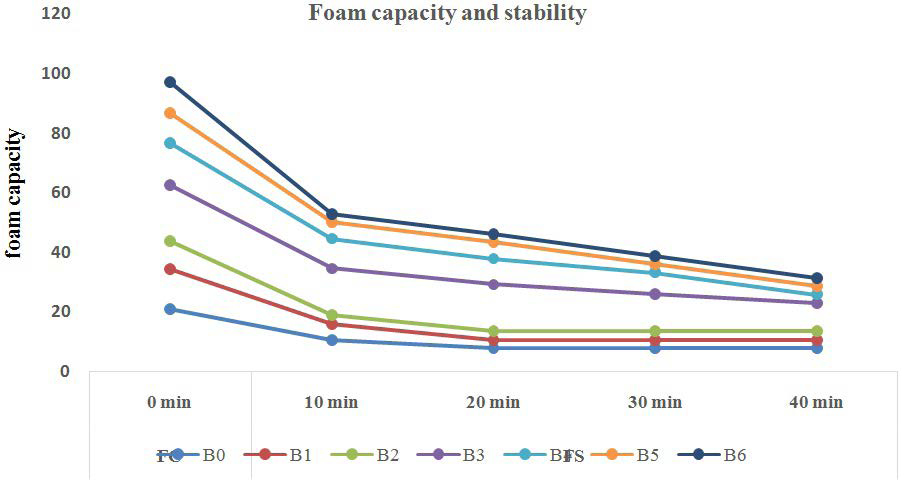
Where: B0 (0:100), B1 (90:10), B2 (40:60), B3 (65:35), B4 (78:22), B5 (53:47), B6 (100:0) (wheat to cowpea flour); respectively.
Proximate Analysis of Blended Flour
Legumes are very essential to provide plant protein and carbohydrate. Bole cowpea with wheat blended flour proximate compositions results were presented in Table 3. The amount of crude protein in each blending ratio has a significant change respect to the bole cowpea flour crude protein concentration. The amount of bole cowpea flour increased in blending, the concentration of crude protein also increased proportionally. According to Yadahally et al cowpea has a good source of crude protein.26 Total energy of the flour had minimum value on cowpea flour and maximum value at the B5 (53% and 47%) of wheat and cowpea flour respectively. This is due to a higher amount of carbohydrate of wheat and higher amount of crude protein also in cowpea flour. The amount of moisture present in cowpea was minimum values than other bleeding flours because of flour particle size of cowpea was fine than the wheat flour.
| Table 3. Proximate Composition Results of Blended Flour (Wheat and Cowpea) |
|
Code
|
Moisture
(%) |
Crude Fiber (%) |
Fat
(%) |
Crude Protein
(%) |
Total Ash
(%) |
Carbohydrate
(%) |
Energy (kJ/100g) |
| B0 |
7.892±0.130d |
2.050±0.000d |
2.000±0.00b |
22.350±0.136a
|
3.392±0.272a
|
62.218±0.539e |
1506.46 |
|
B1
|
9.700±0.141ab |
3.170±0.254a |
2.000±0.000b |
13.323±0.093f |
1.399±0.275d |
70.407±0.255a |
1500.23 |
| B2 |
8.981±0.257bc |
2.440±0.282c |
1.500±0.00c |
17.588±0.169b
|
2.200±0.283b
|
66.789±0.426d |
1504.94 |
|
B3
|
8.608±0.554dc |
2.715±0.007b |
1.500±0.000c |
16.277±0.132d |
1.996±0.005bc |
68.402±0.409c |
1512.29 |
| B4 |
9.209±0.270bc |
2.840±0.155b |
2.000±0.000b |
14.903±0.127e
|
1.444±0.785d
|
69.603±0.543b |
1510.42 |
|
B5
|
10.490±1.569a |
2.340±0.099c |
1.000±0.00d |
16.889±0.267c |
1.602±0.562cd |
66.677±1.764d |
1490.55 |
| B6 |
9.690±0.127ab |
3.313±0.035a |
2.250±0.004a |
12.687±0.124g
|
1.402±0.279d
|
70.904±0.318a |
1499.13 |
a-gAll values were means of duplicate determination±SD (Standard deviation) and expressed in dry basis, except moisture. Values expressed with similar subscripts are not significantly different by Duncan multiple range Test across a column (p<0.05).
Where: B0 (0:100), B1 (90:10), B2 (40:60), B3 (65:35), B4 (78:22), B5 (53:47), B6 (100:0) (wheat to cowpea flour); respectively. |
The amount of crude fiber in pure cowpea flour recorded 2.05% and 3.13% (w/w) in pure wheat flour and in all blending flour, crude fiber was increased proportionally with increasing of the amount of wheat flour. This is due to the higher amount of fiber present in wheat grain and the fiber of cowpea grain was removed before preparation of blended flour. Ash content of pure and blended flour range from 1.399% in 90% and 10% of wheat and cowpea flour and 3.392% in 100% cowpea flour. The amount of ash present in the higher amount into pure cowpea flour, this is implying that besides of higher amount of carbohydrate and crude protein of cowpea flour, it has also a higher concentration of ash and it is an important implication of the presence of different minerals in cowpea flour. Whatever it is, cowpea flour is unique for cowpea flour-based product development in the bakery industry to enhance nutrition status in higher amount respect to wheat based products. The total carbohydrate in pure cowpea is 62.218% and 70.904% in pure wheat flour, but total carbohydrate of the blending is increased proportionally with incremental of wheat flour concentration in the flour. Proximate composition result of cowpea flour which is present in Table 3 similarly reported in Henshaw findings.27
Quality Evaluation of Biscuit
Bulk density: Bulk density of biscuit samples presented in Figure 3. The highest and lowest bulk density was observed in cowpea (B0) and wheat biscuit sample (B6) alone, respectively, from the seven samples which were prepared at a different blending ratio of flour. This study shows that the bulk density of each sample relies on between 0.906 g/cm3 to 0.665 g/cm3 . Bulk density is an important parameter in the design and selection of packaging material. It is also an indication of the porosity of the product, wettability, and crispness. Furthermore, it also helps in infant feeding, if the product has less bulk density.28 Biscuit sample which is developed from B3 (65% wheat and 35% of cowpea flour) has the smallest bulk density next to the control sample B6 (100 % wheat flour). The lowest bulk density means that it has a higher crispness, higher porosity and good product physical qualities.25
Figure 3. Bulk Density of Biscuit Samples
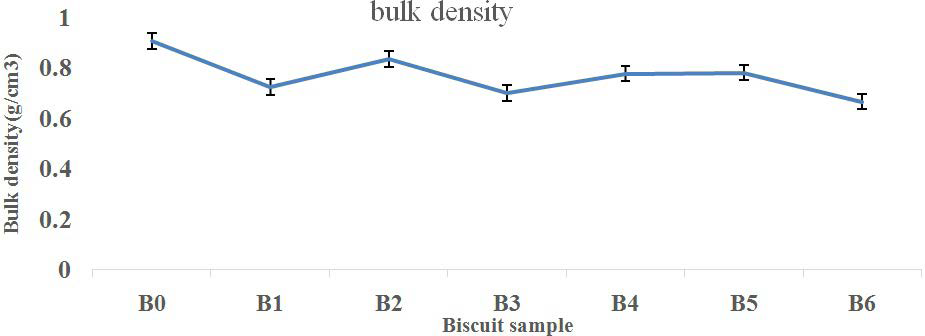
All results were expressed mean± SD of three independent determinations. Where: B0 (0:100), B1 (90:10), B2 (40:60), B3 (65:35), B4 (78:22), B5 (53:47), B6 (100:0) (wheat to cowpea flour); respectively.
Fracture strength of biscuit: Fracture strength (break load) versus peak load of biscuit samples were plotted in the following Figure 4. A breaking load is a measure of force that required to splitting biscuit structure easily. B3, B1, B4 and B6 (control) have a minimum break load force beyond the other three biscuit samples. This indicates a direct relationship with human mouth feel (crispness). It means a lower break force required to break the biscuit sample directly represents a higher value in the crispness of the biscuit product. The fracture strength of biscuit B3 was lowest than the others. This may have observed due to less gluten content of cowpea flour. Similar findings also observed in buckwheat flour biscuit.29 Which was decreasing in gluten content buckwheat flour, the fracture strength of biscuit was lowest. It implies that the biscuit sample has more crispness characteristics.
Figure 4. The Fracture Strength (Peak and Break Load) of Biscuit Sample
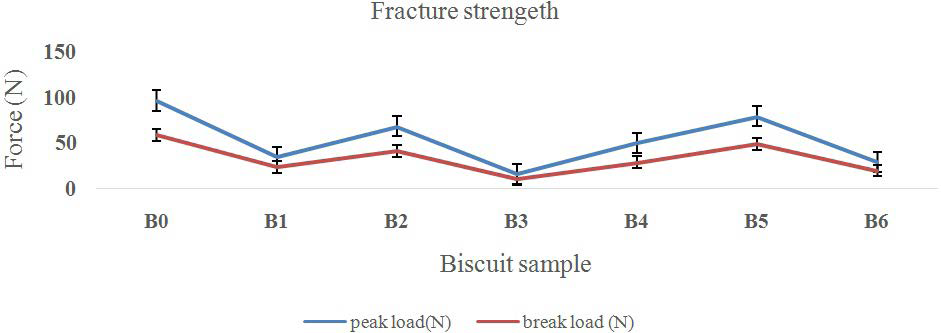
Where: B0 (0:100), B1 (90:10), B2 (40:60), B3 (65:35), B4 (78:22), B5 (53:47), B6 (100:0) (wheat to cowpea flour); respectively.
Water absorption and water solubility index (WAI & WSI): WAI index of biscuit samples was presented in Figure 5. The least and highest WAI of biscuit sample were found in sample B0 (100% of cowpea flour) and B5 (53% wheat, 47% cowpea flour). WAI index shows the quality of the biscuit sample which is soluble or not and starch was not converted into plastics natures or retrograde during oven baking. It is also an index of starch gelatinization or measures the amount of water absorbed by starch.30
Figure 5. Water Absorption Index of Biscuit Samples
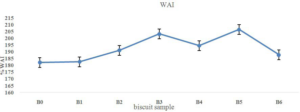
Where: B0 (0:100), B1 (90:10), B2 (40:60), B3 (65:35), B4 (78:22), B5 (53:47), B6 (100:0) (wheat to cowpea flour); respectively.
WSI of biscuit sample B0 (100% of cowpea flour) and B4 (78% of wheat and 22% cowpea flour) have a maximum and minimum values; respectively (Figure 6). WSI is also an important vehicle in infant feeding beyond adult age consumption.28 It is also an indicator of degradation of a starch molecular component during processing. The higher baking temperature could increase the degree of starch gelatinization that could increase the amount of soluble starch resulting in an increase in WSI.31
Figure 6. Water Solubility Index of Biscuit Samples
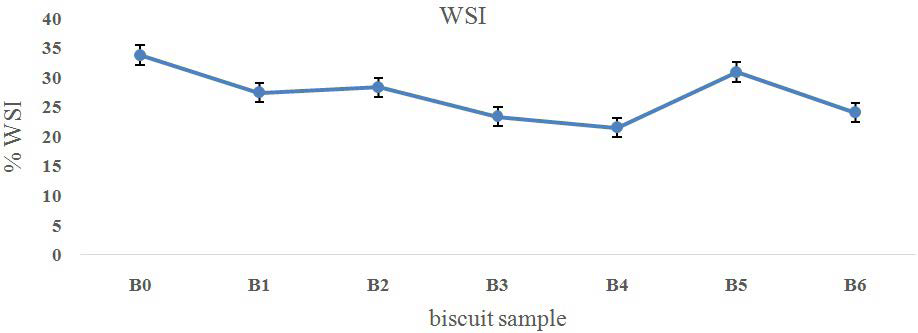
Where: B0 (0:100), B1 (90:10), B2 (40:60), B3 (65:35), B4 (78:22), B5 (53:47), B6 (100:0) (wheat to cowpea flour); respectively.
Flake-extrudate Quality Analysis
Expansion ratio: Expansion ratio describes the degrees of puffing perpendicular to the extruder die which a sample as it exits the extruder. This phenomena’s dependent on the viscosity and elastic properties of the dough in the extruder.32 Expansion of extrudate is an important physical property of a snack and ready to eat food in food industries.33
The expansion ratio of an extruded product also was mainly dependent on the barrel temperature, screw speed and the interaction between screw speed and feed moisture of the extruder. ANOVA shows, this extruder parameter (barrel temperature, screw speed and the interaction between screw speed and feed moisture) significantly affected the wheat-cowpea extrudate.
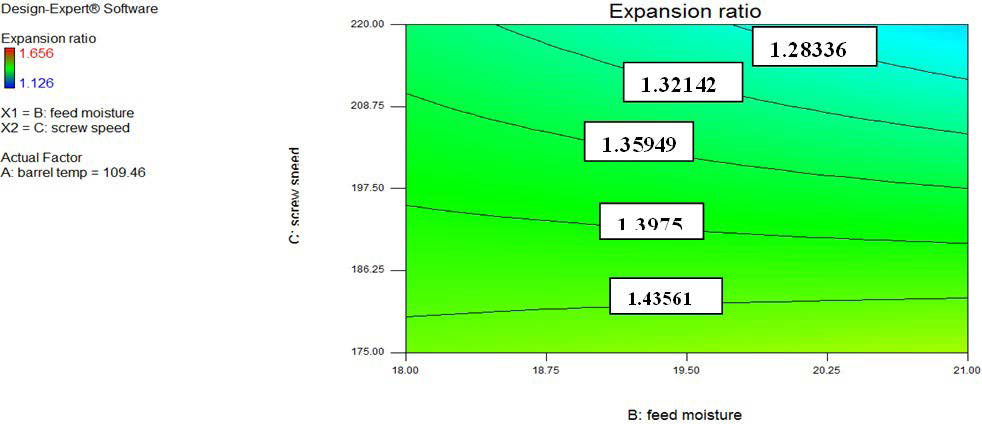
The expansion ratio measured for all extruded samples of Ex-3 (65% wheat and 35% cowpea flour) ranged from 1.126 to 1.656. The expansion ratio of extrudate increase as barrel temperature increases, this is due to the enhancing of melting and gelatinization of starch component34 that goes to the increment of volume of the extrudate and while decreasing the bulk density. As temperature increase too much, the gelatinization process may go to the weakening structure of starch before plasticization and expansion ratio would decline. According to Figure 7, expansion ratio increased gradually, while screw speed decreased, this is due to the energy of screw exerted on dough without sufficient time of gelatinization temperature in the extruder. Due to this, maximum screw speed the expansion ratio would be minimum and at minimum screw speed, the expansion ratio would be higher. The interaction effect of feed moisture and screw speed had a negative effect on expansion ratio (Figure 8), expansion ratio decrease as screw speed and feed moisture values increase from low to high level at constant barrel temperature. And that, screw speed decrease from higher to lower level the feed moisture effect on the Ex-3 extrudate goes to constant.
Figure 7. Effect of Screw Speed and Barrel Temperature on the Expansion Ratio of Extruded Product at Constant Moisture Content
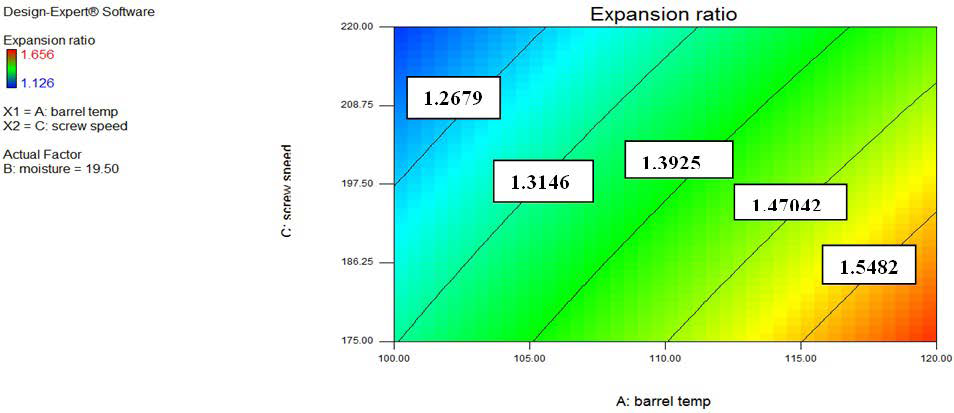
Figure 8. The Interaction Effect of Screw Speed and Feed Moisture on Expansion Ratio of the Extrudate at Constant Barrel Temperature
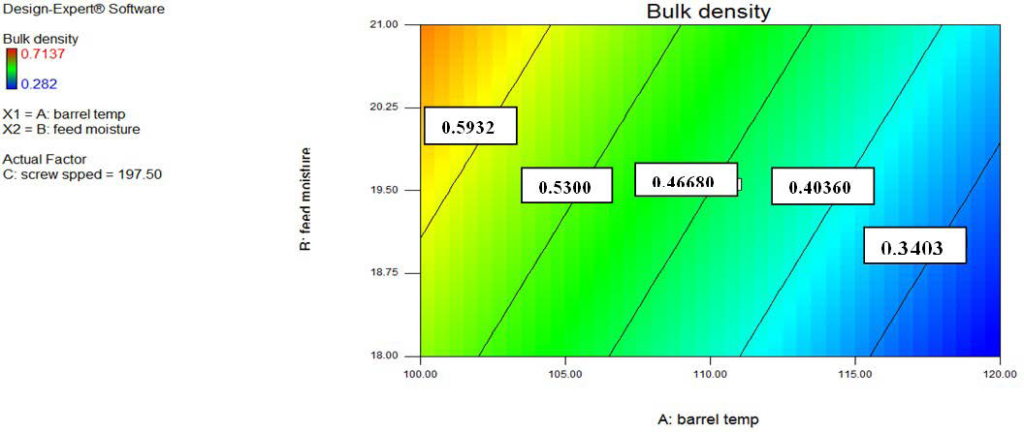
Bulk density: The effect of extruder parameter on extrudate bulk density is in Figure 9 on the contour surface plot. The extruder parameter (barrel temperature, feed moisture, and screw speed) significantly affected the bulk density of extrudate. Bulk density is related to expansion ratio which describes puffing character in all direction of the extrudate.32,35 As bulk density decrease, indirectly expansion of extrudate would be increased. As shown below in the contour surface plot, feed moisture of the dough increases the bulk density of the extrudate increases, but when barrel temperature increases bulk density would decrease. During this, the feed moisture also decreases. This is due to that barrel temperature would be vaporized the lower feed moisture than the higher feed moisture easily from the melted and expanded product and forms pores (puff) structure. The formation of expanded products is associated with high pressure and temperature.33 The increasing of feed moisture would decrease the temperature of the dough in the barrel zone between the screw and barrel. This would be a reduction of starch gelatinization and puff formation that leads to reduce the expansion of products. Therefore, the bulk density of the extrudate would increase as decreasing of expansion.
Figure 9. Effect of Barrel Temperature, Feed Moisture and Screw Speed on the Bulk Density of Extrudate Contour Line
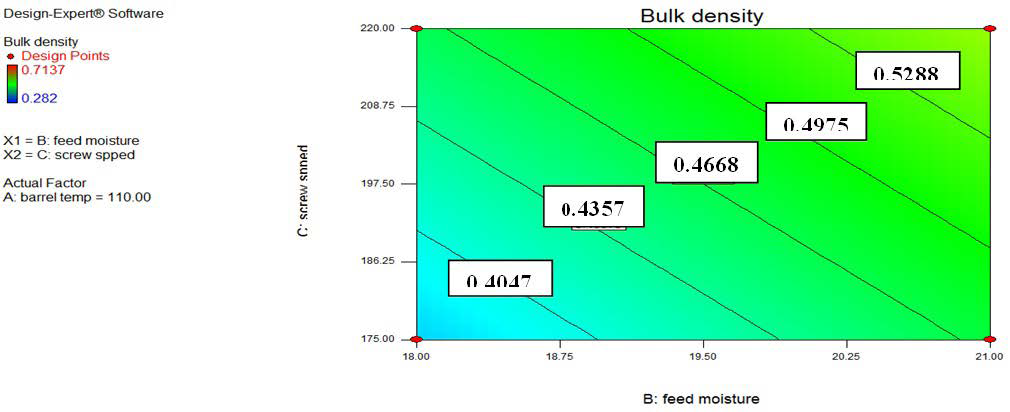
Screw speed also influences on the bulk density of extrudate. The screw speed increase means output rate increases, regarding of this exposure of dough to barrel temperature was insufficient to melt and gelatinize of protein and starch component to form puff structure. The result shows that as screw speed and feed moisture increases the bulk density of extrudate also increases. However, bulk density values ranged from 0.282 to 0.7137 g/cm3 and this shows that quality of extrudate was high at lower values of bulk density as decreases screw speed and feed moisture with increasing barrel temperature. But, barrel temperature increases beyond the maximum limit bulk density goes to decrease due to plasticization and causing a reduction in melting and gelatinization of dough. Evidence from cohort findings shows that feed moisture and barrel temperature are detriments of bulk density as well as expansion ratio. The result from these studies is a cohort and has similar ranges with other findings.33,36
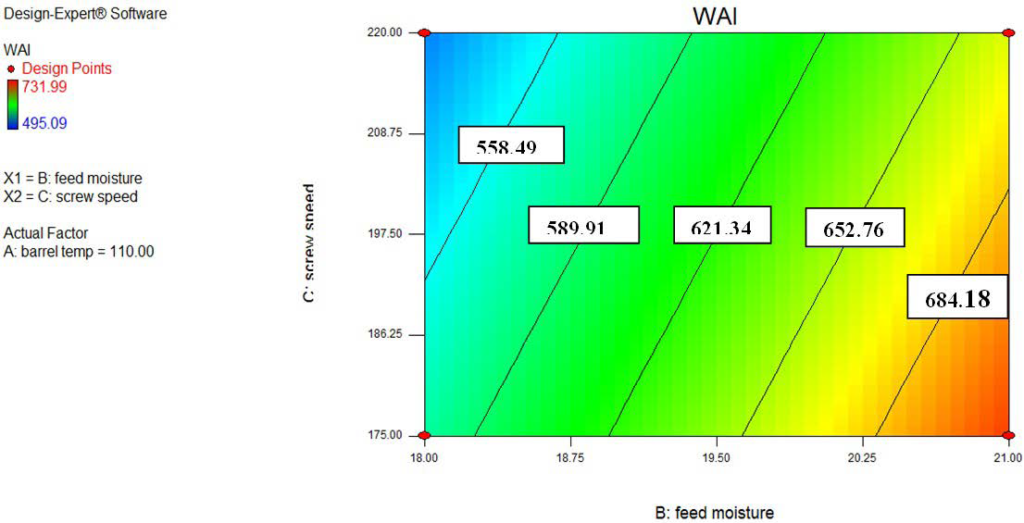
Water absorption indices (WAI): WAI and WSI are very important characteristics of extrudate and measured the degree of starch damage or conversion into amylase and amylopectin due to the effect of extrusion processing parameter.34 WAI measures the amount of water absorbed by starch component, which maintains the integrity of starch in aqueous dispersion,16 and shows the index of starch gelatinization. The ANOVA shows that linear terms of screw speed and feed moisture affect WAI significantly (p<0.05).
Values of WAI range from 495.09 to 731.99% of the extrudate. Figure 10 shows that, feed moisture increased to result in increasing WAI. Higher feed moisture which is increased gelatinization of starch in continues heating that causes to increase in WAI of extrudate.31 WAI also decreased as increasing of screw speed, which means that at a higher level of screw speed was make fragmentation of starch molecules and cause to lose the structure of starch in aqueous dispersion. But WAI increased at a higher temperature before plasticization occurs.37
Figure 10. Effect of Barrel Temperature, Feed Moisture and Screw Speed on Wai of Extrudate
Water solubility indices (WSI): The water solubility indices used as an indicator of degradation and conversion of starch molecules into water-soluble polysaccharides such as amylase and amylopectin.38 The barrel temperature, feed moisture and screw speed of the extrusion parameter would affect the WSI of the extrudate, significantly p<0.05. Values of WSI range from 6.87-17.28% at constant screw speed which is presented in Figure 11. Decreasing of feed moisture and barrel temperature would cause to increase in WSI. This is due to that at lower moisture content, the viscosity of starch was high and enhance starch degradation but decrease starch gelatinization.34 Similar effect was also reported in Ding et al, works.31
Figure 11. Effect of Barrel Temperature, Feed Moisture and Screw Speed on Wsi of Extrudate
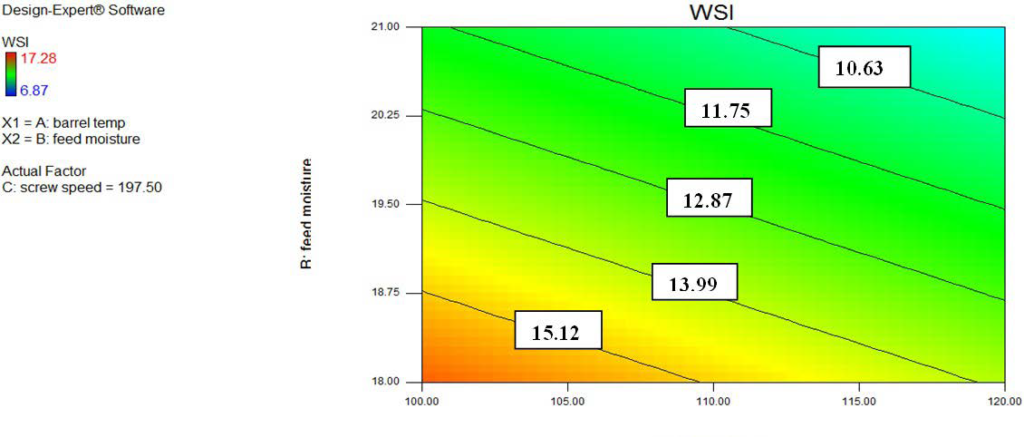
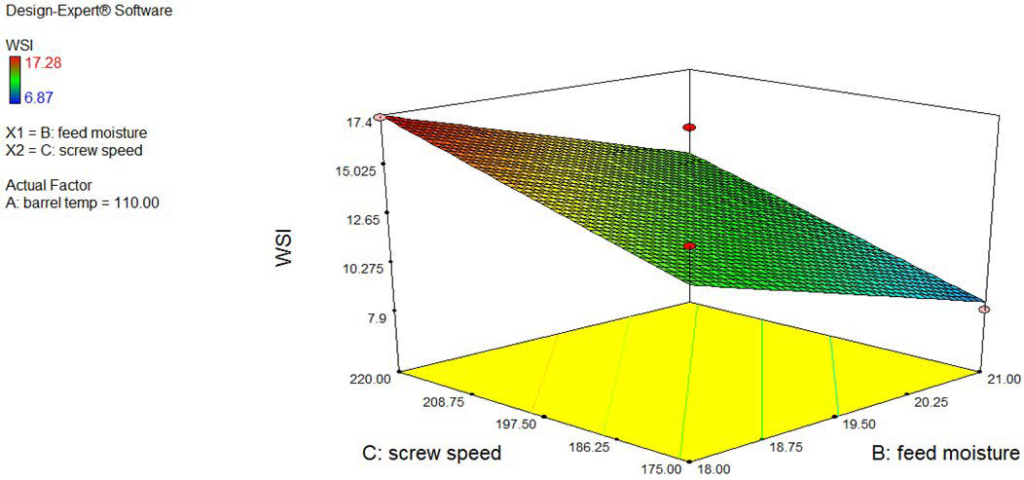
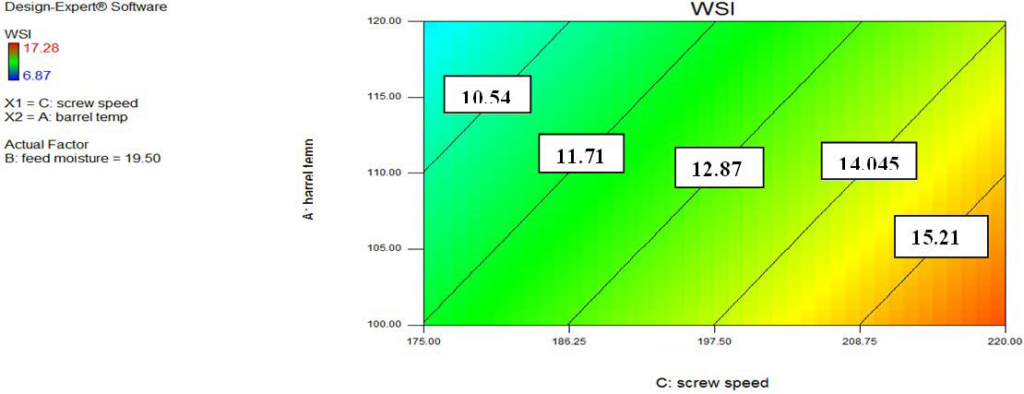
WSI also increases significantly p<0.05 as increasing screw speed, but decreasing in barrel temperature and feed moisture. Higher values of screw speed cause to develop high mixing energy at low feed moisture results to enhance starch degradation and fragmentation, which are more soluble in water. But at low screw speed with high feed moisture cause to develop low mixing energy results to enhance starch gelatinization and decrease degradation, which means an increase in WAI and decrease in WSI at constant heating barrel temperature.
Proximate Composition of Biscuit and Extrudate Sample
The proximate composition and gross energy of biscuit sample were presented in Table 4. Based on sensory analysis and fracture strength (crispness) of biscuit samples, we selected only three samples (B1, B3 and B4) analyzed their proximate composition, minerals and bioactive components from total seven samples including the control. The major difference between the three samples was mainly based on their crude protein. B3 had higher crude protein concentration than the other biscuit samples, this result shows that, it has a good protein and could influences costumer choose over the control biscuit sample. This result also coherent with other findings.25 The total gross energy also higher in B4, B3 and B1 respectively, but the higher gross energy was recorded in B4 because of higher in carbohydrate and fat composition of biscuit sample raw material constituent. Crude fiber result also has low in B1 and higher in B4 corresponding to the wheat flour concentration in biscuit sample. The moisture of the biscuit sample also an important factor in determining storage condition and shelf life of biscuit sample and this result may good in order to preserve from microbial growth in addition to packaging materials.
| Table 4. Proximate Composition and Energy of Biscuit Samples |
|
Code
|
Moisture
(%) |
Crude Fiber (%) |
Fat
(%) |
Crude Protein
(%) |
Total Ash
(%)
|
Carbohydrate
(%)
|
Energy (kJ/100g)
|
|
B1
|
6.219±0.128a |
2.105±0.063b |
10.558±0.079c |
12.803±0.089c
|
1.905±0.021a
|
66.381±0.05a
|
1738.515C±2.936c
|
|
B3
|
5.392±0.006c |
2.200±0.240b |
11.632±0.075b |
15.972±0.125a |
1.930±0.084a |
62.872±0.13c |
1773.671±5.113b |
| B4 |
5.835±0.059b |
2.655±0.318a |
12.569±0.149a |
14.211±0.143b |
1.68±0.014b
|
63.048±0.39b
|
1786.336±7.010a
|
| a-cAll values are means of triplicate determination±SD and expressed in dry basis, except moisture |
The proximate composition and gross energy of extrudate also presented in Table 5. Depending on the sensory result, we were selected two extrudate among five extrudates and make a further physico-chemical analysis. Flake extrudate (Ex-3), has higher in protein concentration, carbohydrate, total energy, and total ash but lower in moisture, crude fiber and ash compared to Ex-4 which has lower cowpea during extrudate production. Extruded products are useful for children and adults based on their carbohydrate and protein sources beyond their minerals. The aims of this studies also produce such products which have higher in protein and carbohydrates as well as their energy values like Ex-3 beyond that how much cowpea flour substitute in the production of wheat-based products and preferred over extruded produce from wheat flour only. Similar findings in product development from cowpea and wheat flour show that increase in protein concentration due to incremental of cowpea flour for different types of Nigerian products according to Akubor (2003) and Akubor (2004).25,39
| Table 5. Proximate Composition and Energy of Extruded Samples |
|
Code
|
Moisture
(%) |
Crude Fiber (%) |
Fat
(%) |
Crude Protein
(%) |
Total Ash
(%)
|
Carbohydrate
(%)
|
Energy (kJ/100g)
|
|
Ex-3
|
6.35±0.028b |
2.22±0.014b |
0.67±0.042b |
15.915±0.251a |
2.505±0.035a |
72.340±0.315a |
1517.024±0.612a |
| Ex-4 |
10.6±0.014a |
4.36±0.028a |
0.775±0.021a |
14.256±0.127b |
2.185±0.036b
|
67.822±0.098b
|
1435.655±0.098b
|
a-bAll values are means of triplicate determination±SD and expressed in dry basis, except moisture.
Where: B1 (90:10), B3 & (Ex-3) (65:35), and B4 & (Ex-4) (78:22) (wheat to cowpea flour), respectively.
Values expressed with similar subscripts are not significantly different by Duncan multiple range test across a column (p<0.05) |
Mineral Composition of Biscuit and Extrude
Mineral composition of biscuit and extruded samples were presented in Table 6. Cowpea flour is good sources of minerals as a whole and de-hulled one.40 Calcium concentration of biscuit sample was higher in B1, while magnesium, iron, and zinc were higher in B4. Biscuit sample B3 was significantly differencing in iron concentration from another biscuit sample which is a minimum concentration exist in B3. Magnesium concentration was higher in B3 next to biscuit sample B4. The iron and zinc mineral concentration of extrudate also higher in Ex-3 compared to Ex4. Whereas, calcium and magnesium concentration was higher in B4 extruded samples.
| Table 6. Mineral Composition of Biscuit and Extruded Samples |
|
Biscuit & Extrudate Sample
|
Ca (ppm) |
Mg (ppm) |
Fe (ppm) |
Zn (ppm)
|
|
B1
|
3.824±0.024a |
2.564±0.002c |
1.081±0.019b |
1.505±0.028ab |
|
B3
|
2.205±0.080c |
2.571±0.003b |
0.836±0.018c |
1.386±0.045b
|
| B4 |
2.849±0.027b |
2.575±0.001a |
1.369±0.002a
|
1.590±0.107a
|
|
Ex-3
|
6.601±0.603b |
1.887±0.087b |
1.661±0.606a |
1.537±0.020a |
| Ex-4 |
6.976±0.520a |
1.999±0.465 |
0.546±0.089b |
1.408±0.003b
|
| a-cAll values were means of duplicate determination±SD (Standard deviation).
Where: B1 (90:10), B3 & (Ex-3) (65:35), and B4 & (Ex-4) (78:22) (wheat, cowpea flour), respectively.
•Values expressed with similar subscripts are not significantly different by Duncan multiple range Test across the columns (p<0.05).
• Ex-3 and Ex-4-Extruded samples three and four |
The Bioactive Component in Biscuit and Extruded Samples
Bioactive component (tannin and phytate) analyses of products were presented in Table 7. The result of tannin analysis after processing reveled mg/100 g. Whereas, 69.723 mg/100 g was the highest values of tannin in B1, and 32.540 mg/100 g was the lowest value in B4 biscuit sample. Furthermore, the tannin in extruded sample was below the detection limit. Phytate concentration was highest in B4 and lowest in B1 biscuit sample and also higher in Ex-4 and lower in Ex-3 in Flake-extruded samples.
| Table 7. Tannin and Phytate Concentration of Biscuit and Extrudate Products |
|
Biscuit Sample (mg/100g)
|
Extrudate Sample (mg/100g)
|
|
s/code
|
B1 |
B3 |
B4 |
Ex-3
|
Ex-4 |
|
Tannin
|
69.723±6.061a |
61.193±0.000b |
32.540±0.000c |
BDL |
BDL |
| Phytate |
70.301±17.42e |
89.552±8.167d |
108.528±0.945c |
122.240±5.601b
|
125.28±2.984a
|
| a-eAll values were the means of duplicate determination±SD (Standard deviation).
Values expressed with similar subscripts are not significantly different by Duncan multiple range Test across the row (p<0.05). Where: BDL-Below detection limit.><0.05)
Where: BDL-Below detection limit. |
The evidence from epidemiological studies indicate that diets rich in pulse grains are also associated with a lower risk of several degenerative diseases, because of that pulse based products contain several non-nutritive bioactive compounds (healthpromoting mixture) of phytochemical’s which act as natural antioxidants and protects deoxyribonucleic acid (DNA) damage,41 like phytate act as anticarcinogen and regulates chromatin remodeling, endocytosis, and nuclear messenger Image result for rNA full form www.javatpoint.com42 ribonucleic acid (RNA) export. The phenolic compound which consists of tannin act as antioxidant properties due to their potential for oxidation and reduction process, which enables them to act as reducing agents, donating hydrogen and neutralizing free radicals.43
The Microbial Load of Biscuit Extruded Sample
Microbial load (total plate count, yeast and molds) of samples result were analyzed and presented in Table 8 before sensory analysis was performed. Biscuit and extruded sample generally have a lower aerobic-bacteria and yeast and mold at 10-5 and 10-3 series dilution respectively. Even, yeast and mold were not detected in biscuit B3 and extruded sample. This result also shows a smaller number of aerobic bacteria and yeast and mold counts of other coherent studies.44 This result was in safe limits and it shows cowpea flour addition in product development do not have any microbial related problems.
| Table 8. Microbial Load of Biscuit and Extruded Samples |
|
Biscuit Samples
|
Extrudate Samples |
|
Types of Microbe
|
Dilution Series |
B1 |
B3 |
B4
|
Ex-3 |
Ex-4
|
|
Aerobic bacteria, 35 °C
|
10-5 |
37 |
42 |
225 |
42 |
46.5 |
| Yeast & Molds 25 °C |
10-3 |
69 |
BDL |
32
|
BDL
|
BDL
|
| All results were triplicate determination. Where: BDL-Below detection limit. |
Sensory Evaluation of Biscuit and Flake-extruded Samples
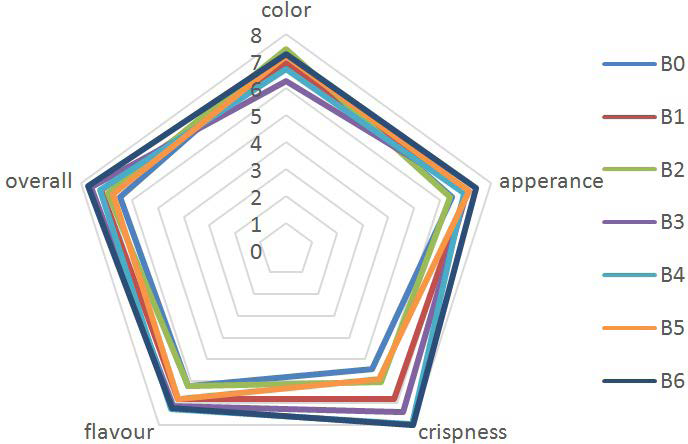
Each product was evaluated for color, appearance, crispness, flavor and overall acceptability with nine hedonic scales.18 According to untrained and semi-trained panelist, the color evaluation was performed for the products and shows that B2 has a higher value and B3 has lower values. As shown in radar plots of biscuit samples sensory evaluation results shows as the cowpea flour concentration increases, the color acceptance of the product was a higher degree of acceptance (Figure 12). Nevertheless, in crispness, the higher degree of acceptance was depended upon the concentration of the wheat flour rather than the cowpea flour in the products. This is due to the content of gluten which is found in wheat and forms porous internal structure during cooking or baking and it helps to lose moisture easily. In B0, B2 and B5, flavor acceptance was lies between like slightly and like moderately, but in B1, B3, B4 and B6 (control) flavor was higher acceptance (like moderately). In general, the sensory result shows that B3 has higher overall acceptance next to B6 (control) and B0 has a lower overall acceptance.
Figure 12. Radar Plots of Biscuit Sample Sensory Evaluation Results
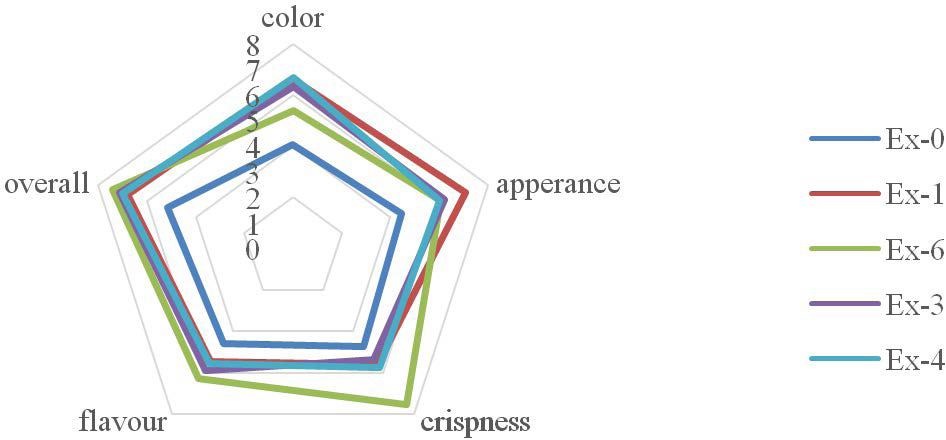
In flake-extrudate, Ex-4, Ex-1, and Ex-3 have a higher in color, appearance, crispiness, and flavor; respectively (Figure 13). The crispness of the extrudate was a higher degree of acceptance which is the wheat flour concentration in extruded was higher and the bole type cowpea flour was in low amount. The whole color was higher in Ex-1, Ex-4, and Ex-3 of extrudate which is prepared from the blending of the two flour, this higher acceptance may be due to the browning reaction of sugar (carbohydrate) of two flour dough and the higher concentration of protein in cowpea flour at a higher temperature. But, extruded produce in independent flour was a lower degree of acceptance of color. Ex-3 and Ex-4 have a value greater than 7 (like moderately) which is similar to Ex-6 (control) of the overall degree of acceptance.
Figure 13. Radar Plots of an Extruded Product Sensory Evaluation Results
CONCLUSION
Based on the results, it was revealed that cowpea-wheat blended flour have a good nutritional quality on the biscuit and extrudate products. Crude protein for biscuit and extruded products were increased as a result of increasing the amount of cowpea flour addition. Cowpea flour with 35% blending ratio could substitute in both biscuit and extruded products which in turn have best sensory quality in terms of crispness (low fracture strength). The best-fitted extrusion process parameter for the extrudate was 1200C barrel temperature, 21% feed moisture and 175 rpm screw speed. The extrusion parameters including expansion ratio, bulk density and WAI index were having a good quality measure of the extrudate product which was produced from 35% of cowpea and 65% wheat flour blends. Nevertheless, further investigation on product amino-acid profile, protein and starch digestibility and mineral bioavailability are required for commercial application of the products.
ACKNOWLEDGMENTS
The Authors would like to thank Addis Ababa University, Debre Zeit Agricultural Research Center and Melkassa Agricultural Research Centre for their support in finance for analyses and supply of cowpea and wheat samples for research.
COMPLIANCE WITH ETHICAL STANDARDS
This study protocol for sensory quality analysis was reviewed and approved by the institutional review board of the Addis Ababa Institute of Technology, School of Chemical and Bio-Engineering, Food Engineering Graduate Program. Informed consent was waived by the board. The manuscript is in line with the International recommendations for the ethical standards.
CONFLICTS OF INTEREST
The authors declare that they have no conflicts of interest.


