INTRODUCTION
Malnutrition is a major public health problem among preschool children, specifically tribal preschool children in India. Generally, the nutritional status of an individual depends on their food consumption. Human needs a wide range of nutrients to lead a healthy and active life, and these are derived through the diet. Although nutritional status is a sensitive indicator of a community’s health, in order to formulate any public health strategy to reduce malnutrition, we first have to assess the nutritional status of a community.1 Malnutrition is associated with a higher mortality rate among preschool children. Nearly half of the preschool children were underweight and stunted in India, as documented by the National Family Health Survey (NFHS)-1, 2 and 3 reports, and 59% of preschool children (per 1,000 live births) lost their lives before attaining their fifth birth day.2,3,4 It was much higher than the global child mortality rate (46%).5 Malnutrition was to blame for the high mortality rate. It was more prevalent among preschool children from disadvantaged areas with lower socioeconomic status. The scenario was worse among a tribal community inhabiting rural and impassable area of the country.6 More than one-third of the world’s wasted and stunted children live in India. Malnutrition has an impact on the health, growth, and development of children, and it is an indicator of national progress toward developmental goals, reducing a nation’s strength and capacity.7
According to the NFHS-3 of India, 60% of preschool tribal children were underweight.8 It has also been reported that the nutritional status of Indian children from tribal and lower socioeconomic groups is very poor.9,10 As per our records, there was no previous study based on thinness (low body mass index (BMI)-for-age) among the Sabar preschool children of West Bengal. In view of the above, the present study was undertaken to assess the prevalence of malnutrition in the form of thinness among the Sabar tribal preschool children of Purulia district, West Bengal, India.
The Sabar is a Mundari-speaking tribe found in the hill regions of Orissa, Andhra Pradesh, Madhya Pradesh, Bihar (now Jharkhand) and West Bengal. In West Bengal, Sabar is also known as Kheria, Kharia, and Savar. Hill Kharias, Dhelki Kharias, and Dudh Kharias are the three types of Kharias based on their geographical location, culture, and a few other aspects of life.11 Hill Kharias is the most primitive and in the worst condition. They live in Purulia, Bankura, West Bengal, as well as hilly areas of Orissa and Jharkhand. Keeping in mind the present study aimed to see anthropometric characteristics as well as to assess the prevalence of malnutrition in the form of thinness using an age- and sex-specific international BMI cut-off.12
MATERIALS AND METHODS
Settings
The present household based cross-sectional study was carried out at the seven villages of Barabazar, Manbazar-II, and Bundwan blocks of Purulia district, West Bengal, India. The information was gathered between October 2020 and February 2021. All three blocks are situated approximately 225-255 km away from Kolkata, the provincial capital of West Bengal.
Sampling
The present article was developed based on the partial findings of a household-based health study. The sample size (household) of the study was estimated through Emergency Nutritional Assessment (ENA) software. It was assumed that the estimated prevalence of undernutrition was 20% (on the basis of NFHS-3, the wasted value of preschool children was 20%), the desired precision was 5, the average household size was 5, under five children were 21%, and non-responding households were 3%. Therefore, the calculated minimum household size was 292 to address the objectives. Simple random sampling was used to select the households. A minimum of 100 households were selected from each block. Finally, 356 households were included in the present study.
Sample
A total of 104 available preschool children (49 boys and 55 girls) were included in the present study. The children’s ages were determined using their birth certificates and immunisation records.
Anthropometric Measurements
The preschool children’s height and weight were measured using the standard procedure recommended by Lohman et al.13 Martin’s anthropometer was used to measure height with an accuracy of 0.1 cm, and a weighing machine (Libra, India) was used to measure weight with a difference of 500 g.
Assessment of Malnutrition
The BMI was calculated using an internationally accepted standard equation.14 Cole et al12 recommended an age- and gender-specific BMI cut-off was used for assessing the thinness status. Low BMI for- age was defined as thin as CED grade-III (as corresponding values for adults BMI>16.00 kg/m2), CED grade-II (as corresponding values for adults BMI: 16.00-16.99 kg/m2), and CED grade-I (as corresponding values for adults BMI: 17.00-18.49 kg/m2), which are referred to as severe, moderate, and mild thinness, respectively.
Statistical Analyses
All statistical analyses were performed using the Statistical Package for the Social Sciences (SPSS) (Version: IBM 25), the Emergency Nutritional Assessment, and Microsoft Office Excel (Version 2007).
An independent sample student t-test was performed to see the significant sex differences in mean height, weight and BMI. One-way analysis of variance (ANOVA) was computed to see the significant age variations of mean height, weight and BMI. All statistical analyses were set at p<0.05.
RESULTS
Anthropometric Characteristics
Age- and sex-specific means (standard deviations) of weight (kg), height (cm), and BMI (kg/m2) of the studied preschool children were tabulated in Table 1.
| Table 1. Anthropometric Characteristics of the Tribal Preschool Children |
|
Age in Year
|
Weight (kg) |
Height (cm) |
BMI (kg/m2) |
| Boys:
Mean (SD) |
Girls:
Mean (SD) |
Sex-combined
Mean (SD) |
Boys:
Mean (SD) |
Girls:
Mean (SD) |
Sex-combined
Mean (SD) |
Boys:
Mean (SD) |
Girls:
Mean (SD) |
Sex-combined
Mean (SD)
|
|
2
|
9.72(0.73) |
9.52(1.41) |
9.62(1.09) |
84.13(3.89)^ |
79.46(4.92)^ |
81.89(4.93) |
13.78(1.34)^ |
15.07(1.72)^ |
14.40(1.64) |
| 3 |
10.72(0.58) |
10.17(1.36) |
10.45(1.06) |
87.81(2.94) |
88.89(2.97) |
88.35(2.93) |
13.91(0.56)^^ |
12.82(0.94)^^ |
13.36(0.94)
|
|
4
|
12.13(2.02) |
12.67(2.03) |
12.48(2.01) |
94.83(6.40) |
97.27(7.13) |
96.40(6.86) |
13.43(1.36) |
13.33(1.10) |
13.36(1.18) |
| 5 |
13.41(1.31) |
13.03(1.42) |
13.23(1.35) |
101.85(4.55) |
101.72(5.03) |
101.79(4.70) |
12.92(0.81) |
12.59(0.95) |
12.76(0.88)
|
|
Age-combined
|
11.62(1.94) |
11.63(2.20) |
11.62(2.07) |
92.85(8.56) |
93.08(10.00) |
92.97(9.30) |
13.45(1.11) |
13.41(1.49) |
13.43(1.32) |
| F-values |
22.82*** |
15.38*** |
35.66*** |
41.23*** |
41.71*** |
77.49*** |
2.37 |
10.76*** |
8.81***
|
| Standard deviations (SD) are presented within the parentheses
Level of significance ***=p<0.001; significant sex difference ^=p<0.05, ^^=p<0.01 |
Overall, the weight, height, and BMI means (SD) were 11.63 (2.2), 93.08 (10.00), and 13.41 (1.49) for girls and 11.62 (1.94), 92.85 (8.56), and 13.45 (1.11) for boys. The boys were significantly taller than girls at the age of 2-years (t=2.64; p<0.05). But the girls of the same age showed a higher mean value of BMI compared to the boys (t=-2.10, p<0.05). Whereas, just after reaching a higher age (3-years), boys had a higher mean value of BMI (t=3.14, p<0.01) compared to their counterparts. Overall, there were no significant sex differences found in mean weight. The results also revealed that mean height depicted maximum age variations (sex combined: F=77.49; p<0.001, boys: F=41.23; p<0.001, girls: 41.17; p<0.001) followed by mean weight (sex combined: F=35.66; p<0.001, boys: F=22.82; p<0.001, girls: 15.38; p<0.001). The mean values of BMI also showed significant age variations among children except boys (sex combined: F=8.81; p<0.001, girls: F=10.76; p<0.001).
Nutritional Status
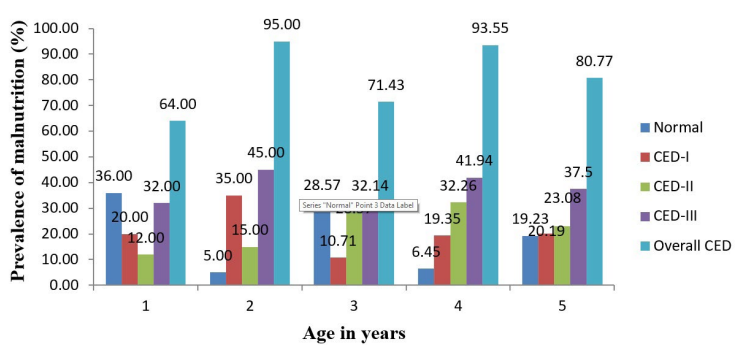
Table 2 shows the age- and sex specific prevalence of malnutrition among the studied preschool children. The overall prevalence of malnutrition was 80.77%, (boys: 85.71%; girls: 76.40%). All of the boys at the age of 3-years were thin, but mild thinness (CED-I) was the highest (60%) and severe thinness was the least (10%). Girls had a higher prevalence of severe thinness (41.82%) than boys (32.65%). Figures 1, 2 and 3 depict the prevalence of thinness in boys, girls and overall children, respectively.
| Table 2. Age and Sex Specific Prevalence (%) of Malnutrition among the Sabar Preschool Children |
|
Gender
|
Nutritional Status |
Age (years) |
Age-combined |
| 2 |
3 |
4 |
5 |
| F |
% |
F |
% |
F |
% |
F |
% |
F |
%
|
| Boys |
Normal
|
3 |
23.08 |
0 |
0.00 |
3 |
30.00 |
1 |
6.25 |
7 |
14.29 |
| CED-I |
1 |
7.69 |
6 |
60.00 |
1 |
10.00 |
2 |
12.50 |
10 |
20.41
|
|
CED-II
|
3 |
23.08 |
3 |
30.00 |
3 |
30.00 |
7 |
43.75 |
16 |
32.65 |
| CED-III |
6 |
46.15 |
1 |
10.00 |
3 |
30.00 |
6 |
37.50 |
16 |
32.65
|
|
Overall CED
|
10 |
76.92 |
10 |
100.00 |
7 |
70.00 |
15 |
93.75 |
42 |
85.71 |
| Girls |
Normal |
6 |
50.00 |
1 |
10.00 |
5 |
27.78 |
1 |
6.67 |
13 |
23.64
|
|
CED-I
|
4 |
33.33 |
1 |
10.00 |
2 |
11.11 |
4 |
26.67 |
11 |
20.00 |
| CED-II |
0 |
0.00 |
0 |
0.00 |
5 |
27.78 |
3 |
20.00 |
8 |
14.55
|
|
CED-III
|
2 |
16.67 |
8 |
80.00 |
6 |
33.33 |
7 |
46.67 |
23 |
41.82 |
| Overall CED |
6 |
50.00 |
9 |
90.00 |
|
72.20 |
14 |
93.33 |
42 |
76.36
|
|
Sex-combined
|
Normal
|
9 |
36.00 |
1 |
5.00 |
8 |
28.57 |
2 |
6.45 |
20 |
19.23 |
| CED-I |
5 |
20.00 |
7 |
35.00 |
3 |
10.71 |
6 |
19.35 |
21 |
20.19
|
|
CED-II
|
3 |
12.00 |
3 |
15.00 |
8 |
28.57 |
10 |
32.26 |
24 |
23.08 |
| CED-III |
8 |
32.00 |
9 |
45.00 |
9 |
32.14 |
13 |
41.94 |
39 |
37.50
|
|
Overall CED
|
16 |
64.00 |
19 |
95.00 |
20 |
71.43 |
29 |
93.55 |
84 |
80.77
|
Figure 1. Prevalence of Malnutrition among the Boys
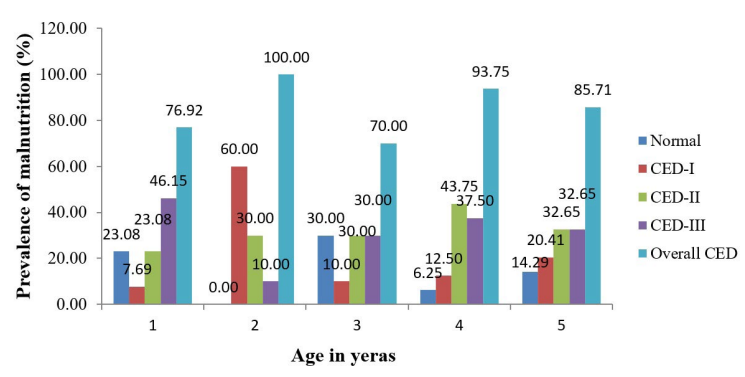
Figure 2. Prevalence of Malnutrition among the Girls
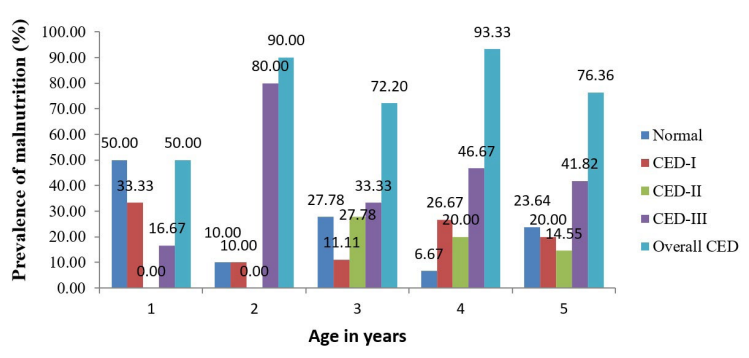
Figure 3. Age Specific Sex-combined Prevalence of Malnutrition among the Sabar Preschool Children
DISCUSSION
A healthy adult depends on his or her health in early childhood, and nutrition has a vital on it.15 Malnutrition leads to a succession of metabolic abnormalities, physiological changes, reduced organ and tissue function, and loss of body mass.16 Previously, evaluating malnutrition based on BMI was not feasible due to a lack of appropriate cut-off points. Suitable cutoff points have now emerged to assess the level of malnutrition in the form of thinness among the children aged 2-18-years.14
It is stated that thinness (low BMI-for-age) is a more appropriate way to assess malnutrition than wasting (low weight-for-height).14 Though several nutritional development programmes are running in India, these programmes have failed to improve the nutrition status of the children.17 Large population sizes, illiteracy, poverty, poor infrastructure, and inappropriate healthcare facilities lead to a high prevalence rate of thinness.18 Underweight among preschool children has been linked to the mother’s educational status and colostrum feeding.19,20 Malnutrition is more likely to affect tribal children than their rural counterparts.21
The comparison of the sex-specific prevalence of malnutrition in the previous studies with the present study is presented in the Table 3 and Figure 4. All these studies were evaluated based on the international BMI cut-off as developed by Cole et al.12 The boys in the present study had the highest prevalence of malnutrition (85.71%) compared to the boys in the other studies. Whereas, the girls had the second highest prevalence of malnutrition (76.36%) after the Integrated Child Development Scheme (ICDS) preschool children of Hooghly district, West Bengal.22 A study of urban preschool children in the North 24 Parganas district, West Bengal found a much lower rate of malnutrition in both sexes (boys: 48.2%, girls: 46.2 %) than the present study.23,24 Other national25,26 and regional9,22,23,24,27,28 studies also showed lower prevalence of malnutrition than the present study. The comparison also revealed that overall, preschool children from the different regions of India are still suffering from serious malnutrition problems, which might be a result of different health problems. Apart from the above discussion, the present study had some limitations. This article was developed from a family-based (household) study; therefore, some age groups had a lower representation. We missed some children during the anthropometric survey due to the migratory occupational status of their parents. No data were collected on the food consumption of the studied preschool children.
| Table 3. Comparison of the Overall Prevalence (%) of Malnutrition of Previous Studies with of the Present Study12 |
|
State
|
District |
Studied Children |
Age group |
N |
Prevalence (%) |
References |
| Boys |
Girls |
| West Bengal |
Nadia |
Preschool children |
3-5 yrs |
2016 |
49.7 |
51.6 |
Biswas et al24
|
|
West Bengal
|
Hoogly |
ICDS children |
2-6 yrs |
1012 |
84.8 |
85.6 |
Mandal et al22 |
| West Bengal |
North 24 Pargana |
Urban Poor preschool
Children |
2-5 yrs |
798 |
48.2 |
46.2 |
Bisai et al23
|
|
West Bengal
|
Purulia |
Santal preschool children |
2-6 yrs |
251 |
59.5 |
53.3 |
Das et al9 |
| Karnataka |
Belgaum |
Rural preschool children |
2-5 yrs |
697 |
63.4 |
58.6 |
Nayak et al25
|
|
Telangana
|
Adilabad |
Kolam tribal preschool Children |
2-5 yrs |
284 |
72.9 |
72.1 |
Bharathi et al26 |
| West Bengal |
Jhargram & Paschim Medinipur |
Tribal preschool children |
2-5 yrs |
643 |
69.5 |
69.2 |
Mahapatra et al27
|
|
West Bengal
|
Purulia |
Kora-Mudi preschool children |
2-5 yrs |
221 |
77.1 |
67.0 |
Chandra et al28 |
| West Bengal |
Purulia |
Sabar tribal preschool children |
2-5 yrs |
104 |
85.7 |
76.4 |
Present Study
|
CONCLUSION
The present study established that the nutritional status of the Sabar preschool children was not satisfactory, indicating a serious problem in health and nutrition. A community health development programme should be taken into account to develop their nutritional status. The present findings will be helpful to policymakers for the effective formulation of developmental and healthcare programs, and it is also necessary to observe the ongoing intervention programmes.
ACKNOWLEDGEMENTS
All subjects who participated in the study are gratefully acknowledged. Special thanks go to Sidho-Kanho-Birsha University and the local governments in these areas.
ETHICAL APPROVAL
Institutional ethical approval was taken from the Sidho-Kanho-Birsha University’s Institutional Ethical Committee. Prior to the survey, consent was obtained from the parents of the children.
CONFLICTS OF INTEREST
The authors declare that they have no conflicts of interest.


