INTRODUCTION
The Drug and Poison Information Center (DPIC) in Singapore was run as a pilot project over 4-years from April 2004 to March 2008. The primary objective of the center was to provide a telephone consultative service to both healthcare professionals and the general public to assist with toxic exposure assessment and recommendations for optimal medical management. In addition, drug information and adverse reactions advisory services were also provided. This service was provided free at no cost to the end user.
The aim of this study was to analyze the demographics of poison exposures from the perspective of this pilot poison call center.
METHOD
Drug and poison information inquiries were captured and entered into a formatted database by pharmacists and poison information specialists providing caller assistance at the DPIC. A retrospective review of poisons records stored in the poison information center call database was made covering the entire period of its operations from April 2004 to March 2008. Drug information and adverse effects calls were excluded from the study and only toxic exposure calls were analyzed. Demographic data, toxic exposure, advice provided and outcome information were analyzed.
RESULTS
There was a total of 15227 calls to the DPIC since its operation on April 04 to March 2008. Of these 13364 calls were excluded as they covered drug information and adverse drug reaction related inquiries. A further 46 calls were excluded as they were inquiries on toxins with no patient involvement. The remaining 1817 (11.9%) included in the study were on acute toxic exposures involving patients.
DPIC User Profile
Healthcare workers in public hospitals were the most frequent users (71.4%) of the DPIC service (Table 1), predominantly from the Emergency Departments (86%). Overall, physicians (78.8%) were the primary users of the service with majority originating from junior level medical staff (70%) including house officers and medical officers. Calls from members of the public mainly non-medical persons accounted for 16.6% of the call volume.
| Table 1. Origin of Poison Information Calls |
| Location |
Number of Calls |
| Public Restructured hospitals |
1296 (71.4%) |
| Private hospitals |
53 (2.9%) |
| GP Clinics |
108 (5.9%) |
| Other healthcare institutions* |
32 (1.8%) |
| Other+ |
26 (1.4%) |
| Member of Public@ |
302 (16.6%) |
| Total |
1817(100%) |
*Includes polyclinics, private pharmacies, National Dental Centre, National Cancer Centre, National Heart Centre, National Neuroscience Institute, National Skin Centre, and Singapore National Eye Centre.
+Includes research institutions, pharmaceutical companies, government organizations.
@includes self, relatives, friends, colleagues, witnesses |
Toxic Exposure Patient Demographics
The age of patients ranged from 3 months to 99 years (mean age 21.1 years) with a bimodal distribution with peaks in the under 5 age group and the 20 to 40 year age group (Table 2). The racial distribution followed local demographics with almost equal gender representation with 50.3% of the cohort being males.
| Table 2. Age Distribution of Poisoning Cases |
| Age (years) |
Number of Incidents (Total) |
| 0-5 |
425 (37.1%) |
| 6-10 |
50 (4.4%) |
| 11-15 |
68 (5.9%) |
| 16-20 |
98 (8.6%) |
| 21-30 |
203 (17.7%) |
| 31-40 |
133 (11.6%) |
| 41-50 |
75 (6.6%) |
| 51-60 |
38 (3.3%) |
| 61-70 |
19 (1.7%) |
| >70 |
37 (3.2%) |
| Total |
1146 |
| Missing data |
671 |
| Total |
1817 |
Toxic Exposure Incident Information
The most common site of incidence was home (69%) and the majority was of an accidental nature (67.4%) (Table 3). The number of agents involved in each exposure ranged from one (84.5%) to a maximum of 6 (<1%) co-ingestants. Prescription medications were responsible for most exposures (46.8%) Table 4 with exposures to analgesics (13.5%), antidepressants and sedatives (10.6%), industrial chemicals (5.7%) and bites and stings (8.4%) forming the bulk of agents involved. The commonest route of exposure was oral (70.4%).
| Table 3. Toxic Exposure Incident Site |
| Place |
Number of Incidents |
| Home |
1072 (69%) |
| Workplace |
116 (7.4%) |
| Public areas* |
242 (15.6%) |
| Unknown |
124 (8%) |
| Total |
1554 (100%) |
| Missing data |
263 |
| Total |
1817 |
| *Includes places such as beach, parks, and other recreational placese.g. pubs |
| Table 4. Agents Used in Poisoning |
| Agent |
Number of Agents (% of total exposures) |
| Acids/Alkaline/Corrosives |
65 (3%) |
| Alcohol |
33 (1.5%) |
| Analgesics (excluding paracetamol) |
119 (5.5%) |
| Analgesics- Paracetamol |
175 (8%) |
| Antidepressants |
102 (4.7%) |
| Antihistamines |
112 (5.1%) |
| Antimicrobials |
2 (0.1%) |
| Antipsychotics |
46 (2.1%) |
| Asthma medications |
26 (1.2%) |
| Cardiac medications |
51 (2.3%) |
| GI medicines |
17 (0.8%) |
| Sedatives |
129 (5.9%) |
| Other Western medicines |
241 (11.1%) |
| Traditional Medicine |
33 (1.5%) |
| Bites and Stings |
183 (8.4%) |
| Pesticides |
87 (4%) |
| Household Cleaning Products |
128 (5.9%) |
| Cosmetics |
29 (1.3%) |
| Food products/substances |
24 (1.1%) |
| Illicit Drugs |
13 (0.6%) |
| Industrial Chemicals |
124 (5.7%) |
| Smoke Inhalation |
20 (0.9%) |
| Vitamins/mineral supplements/OTC* products |
41 (1.9%) |
| Others+ |
361 (16.6%) |
| Unknown |
18 (0.8%) |
| Total |
2179 (100%) |
Note that some exposures may involve more than 1 agent.
+includes silica gel, etc.
*OTC (over the counter)
281 (15.5%) incidents involved >1 agent |
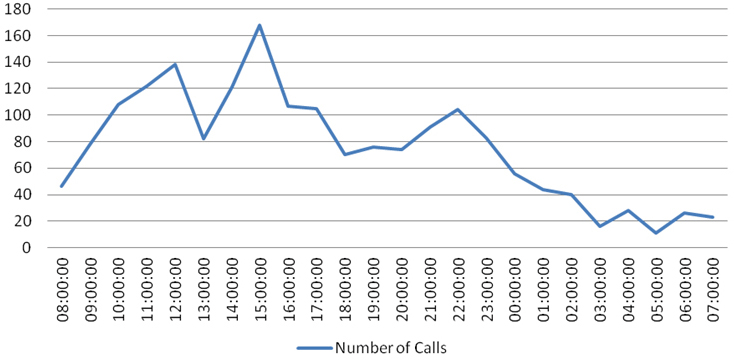
The distribution of calls during the DPIC pilot phase is shown in Figure 1. The calls were evenly distributed by month of the year with no significant seasonal variation except for a slight dip in the middle of the year and a more significant number in the second half of the year (Figure 2). There was also no significant daily variation by day of the week except for a notable dip in calls on Sundays. The daily distribution of calls showed a peak at 1500-hours and 2200-hours with an equitable distribution between office (0800-1700 hours over 9-hours) and after office hours (1700 hours till 0800-hours the following day) (Figure 3). A proportionally larger distribution of toxic exposure calls occurred outside working hours during the late evenings and nights as well as public holidays.
Figure 1: Distribution of Poison Call Volume 2004-2008
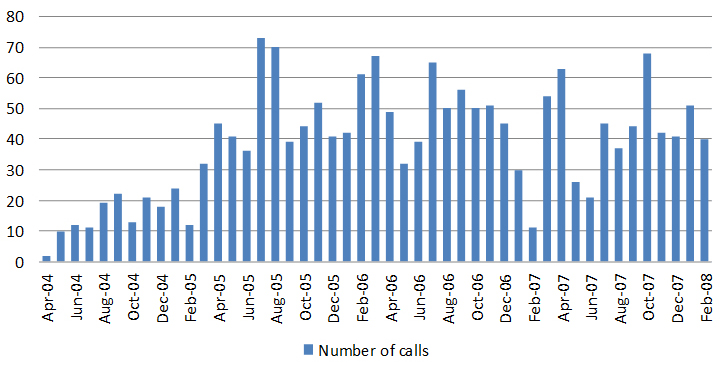
Figure 2: Distribution of Calls by Month
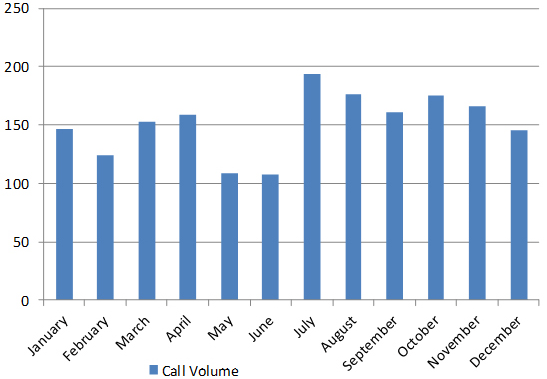
Figure 3: Poison Call Volume by Time of Day
Poison Center Intervention and Outcome
It is noted that for most calls from the public (69.2%), the poison center advice was to reassure and observe the patient with no recommendation for physician visits (Table 5). There was a similar disposition even when the calls were from community physicians (77.1%) and emergency department physicians (71.2%). This potentially demonstrates the triaging function of a poison center reducing unnecessary healthcare visits and saving time and healthcare cost by empowering the public and community physicians while improving the quality of care of poisoning cases with appropriate management and referral advice. This advisory service would serve as an even more critical resource in a chemical disaster involving exposure of a large population.
| Table 5. Poison Center Intervention – Advice to Caller |
|
Poison Center Intervention
|
Number of Calls (%) |
Total Number of Calls (% of All Calls to DPIC) |
|
Public Calls
|
302 (16.6%)
|
| Advice to go to hospital |
70 (23.2%)
|
| Advice to see a GP |
23 (7.6%)
|
| Advice to be observed at home |
209 (69.2%)
|
| Community Healthcare Calls |
166 (9.1%)
|
| Advice to go to hospital |
38 (22.9%)
|
| Advice to be observed at home |
128 (77.1%)
|
| Emergency Department (ED) Calls |
1115 (61.4%)
|
| Advice to admit |
321 (28.8%)
|
| Advice to observe and discharge |
794 (71.2%)
|
| Calls from the Ward |
|
234 (12.9%)
|
| All Calls to Drug and Poison Information Center (DPIC) |
|
1817 (100%)
|
The DPIC has been able to provide immediate definitive advice within 15 minutes of the call for most situations (96.5%) and 99.5% of all calls were resolved within one hour (Table 6). The remaining smaller proportion of cases took up to 8 hours to be resolved due to complexities of the cases involved since the detailed search for information took up most of the time.
| Table 6. Response Time for Poison Information |
| Time Taken |
Number of Calls (total) |
| Immediate |
1353 (74.5%) |
| <15mins |
400 (22%) |
| 15–60 mins |
54 (3%) |
| 1-8 hrs |
6 (0.3%) |
| 8-24 hrs |
3 (0.2%) |
| >24 hrs |
1 (0.1%) |
| Total |
1817 |
DISCUSSION
The number of toxic exposures presented in this study was small, most likely due to the limited publicity of this service. Based on the official statistics, there was a total of 4990 cases of individuals being admitted to Singapore hospitals following an episode of poisoning between 2004 and 2006.1 Although the overall incidence of poisoning fell slightly during this period, it remained (coupled with accidents and violence) the most common cause of hospital admissions.
Being in the frontline of emergency services, emergency department (ED) doctors routinely manage toxic exposures and have significant clinical experience in managing poisonings. Contrary to expectation, these doctors working in the ED setting were noted to use the service more frequently (86%). The reason for this may be multifactorial, including varying experience and comfort level amongst ED physicians on managing toxic exposures to a myriad of agents with limited information resources and staffing issues comprising a significant proportion of junior doctors rotating through the ED. The latter is suggested as junior level doctors were noted to use the service more frequently accounting for 70% of all physician users.
There are several notable differences comparing toxic exposures from the ED2 and DPIC perspectives. The toxic exposures from the ED perspective showed that the mean age of poisoning was 31.8-years with predominance of males 63.3% compared to 21.1-years and 50.3% respectively from the DPIC perspective. The proportion of non-accidental poisonings was also larger in the ED cohort (60%) compared to the DPIC (32.6%). There is insufficient data in the study to determine the reason for the difference and would be an area for future research.
In both studies the commonest site of exposure was the home and the common agents were analgesics, sedatives, bites and industrial chemicals but alcohol related exposures were more common in the ED setting. A study by Wai et al determined the incidence of attempted suicide amongst young people treated in a local teaching hospital between 1991 and 1995.3 Females were the predominant gender committing self-harm by poisoning and the most common medication used was analgesics with paracetamol-based products being the most common. Similar results were obtained in another study performed in Northern Malaysia, a neighbouring country which share close cultural and economic ties with Singapore.4 In Hong Kong, a regional Asian country with a poison information centre established in 2005, 8.4% of poisonings involved the use of paracetamol, representing one of the most common agents used in poisoning similar to our study.5 Based on the 2017 American Association of Poison Control Centres (AAPCT) 2017 National Poison Data System (NPDS) annual report,6 analgesics (11.08%) which include paracetamol is amongst the top five toxin classes involved in human toxic exposures. The ready availability of paracetamol as an over the counter drug may not completely address the reason for this coincidence.
The DPIC appears to have played a significant role in toxic exposures management; advising and reassuring minor poisoning cases while facilitating the appropriate referral of the more severe cases to the hospital ED for further management. This potentially demonstrates the triaging function of a poison center reducing unnecessary healthcare visits and saving time and healthcare cost.
In addition, it is noted that the proportion of patients admitted as advised by the DPIC (28.8%) was smaller compared to the previous study on toxic exposures presenting to the ED from 2001 to 2003, when poisoning admissions were notably higher (36.1%) when patients were managed in the ED without access to a DPIC service. There appears to be more effective utilization of limited hospital bed resources with the use of the DPIC service.
CONCLUSION
This study provides a historical baseline for toxic exposure statistics of the past which will be useful for analyzing current and future trends in poisoning.
It is notable that young people tend to be vulnerable to toxic exposures and the majority are accidental and hence potentially preventable. The role of poison prevention education for parents with young children and poison proofing homes may be potentially beneficial in reducing the number of accidental poisonings in the home.
The cost effectiveness7 and user friendliness8 of the DPIC were noted in prior studies and with the current evidence of good clinical outcomes through DPIC services demonstrates the value of the DPIC as a community resource in managing poisonings.
LIMITATIONS
There was limited publicity on the services of the DPIC and this may have contributed to the low numbers of calls that were handled. Data capture was incomplete in many variables and this limited the validity of conclusions drawn.
ACKNOWLEDGEMENTS
The article was presented as a poster at Eurotox 2014, Edinburgh 7-10th September 2014. The abstract was published in Toxicology Letters: https://doi.org/10.1016/j.toxlet.2014.06.363
CONFLICTS OF INTEREST
There is no conflict of interest.


