INTRODUCTION
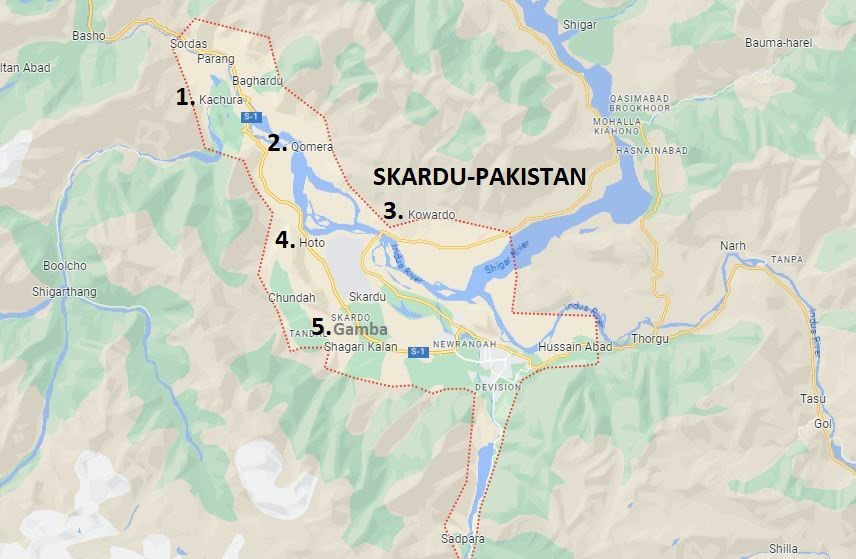
Water is a gift from nature that satisfies many human needs, including those for drinking, body upkeep, growth, and cleanliness.1 All humans need water as a major component of their bodies; therefore, having access to clean drinking water is a universal human right. Water is also a significant resource for agriculture and biodiversity. Therefore, the availability of portable, clean drinking water is essential for maintaining all kinds of life.2 Glaciers, springs, rivers, oceans, and seas are sources of water.3 About 1.6% of the water supply comes from glaciers, 1.8% from groundwater, and 97% from the ocean. Glaciers and groundwater supply 99% of the remaining 2.5% of fresh water, which is found in only 2.5% of the earth’s water. These two sources provided fresh water to 25% of the world’s population.4 According to a 2006 United Nations Development Programme (UNDP) estimate, 17% of the world’s population lacked access to a reliable supply of drinking water.5 Out of the 67.1 million deaths worldwide each year, 1.2 million are attributed to the use of contaminated or dangerous water. In Pakistan, diseases associated with water are believed to have caused 80% of deaths.6,7 To reduce sickness, water must be distributed safely to the population and be free from contamination, high salt content, and microbial burden. The World Health Organization (WHO) (in 1993) established guidelines for drinking water, and potable water is defined as meeting those standards.8 In terms of the availability of portable drinking water, Pakistan is rated 80th place in the world. More than 44% of the population lacks access to safe drinking water generally, and this number rises to 90% in rural regions.9 With 1.8 million residents, Gilgit-Baltistan in northern Pakistan is a mountainous territory with a 72,971 km2 area and an elevation of 3000 meters.10,11 The principal source of drinking water in Pakistan’s Gilgit-Baltistan region is the Skardu Glacier. Coordinates: 35°17’25”N, 75°38’40”E, with elevation of 2,228 meters above sea level in Northeastern Pakistan. These glaciers create surface and subsurface water resources as they melt from high peaks. Surface water resources include streams and the small waterways known as Kohls in the area, while springs located throughout the subsurface supply subsurface water.12 District Skardu is the second-most densely populated area in Gilgit-Baltistan, with nearly 215 thousand inhabitants. Along the banks of the Indus River, the majority of local human communities are found. The main source of water in Kachura is Sukh Nallah, which can be accessed via waterways called Kohls and flows freely as a stream. A mountaintop glacier that melts into a little water channel and flows down to supply water to Qomra. The water channel is devoid of habitation until it reaches the village of Qomra. Kohls assists in distributing drinking water to families in Qomra. Kwardu and Hoto’s water comes from subterranean springs that are close to the communities. Similarly, a stream created by glacier ice melting supplies water to Village Gamba. Due to the piped stream’s proximity to the Combined Military Hospital Skardu and the presence of habitations along its banks, it is vulnerable to anthropogenic pollution.13 None of the water resources in this region are treated before being used for human consumption, and locals believe that they are safe to drink without being aware of the potential health risks. Local awareness campaigns are required to inform the populace about issues with waterborne illness. Regional groups such as the Agha Khan Rural Support Program (AKRSP) and the Pakistan Council of Scientific and Industrial Research (PCSIR) are bringing these issues to the public’s attention. The purpose of this study is to evaluate the acceptability of spring and stream water for human consumption by performing a physiochemical analysis on drinking water collected from five villages in District Skardu, Gilgit-Baltistan, Pakistan (Figure 1). Such a water analysis takes into account the WHO guidelines for human consumption.14
Figure 1. Villages of Skardu Selected for Water
MATERIALS AND METHODS
Water Samples
Sterilized glass bottles were used to collect water samples in triplicate from each of the 5 locations in the district. Samples were brought to the PCSIR laboratory in Skardu, Gilgit-Baltistan, for analysis. Determined parameters were pH, total dissolved solids (TDS), total suspended solids (TSS), total solids (TS), total hardness as CaCO3 , calcium as Ca2 +, magnesium as Mg2 +, total alkalinity as CaCO3 , chloride as Cl, nitrate as NO2 -1, conductivity, sodium as Na+, and most importantly, potassium K+.
Physico-Chemical Analysis
pH: Utilizing a pH meter and the recommended procedure set forth by the Association of Official Analytical Chemists (AOAC),15 the pH of the drinking water samples was assessed. The electrodes were cleaned with distilled water before being dried with tissue paper using standardized pH buffer solutions of pH 4.0 and 9.0.
Total Dissolved Solids (TDS), Total Suspended Solids (TSS), and Total Solids (TS): The AOAC standard filtrate mass measuring procedures (AOAC 2000 method No. 920.193) were used to compute the total dissolved solids, total suspended solids, and total solids.
Raw water typically contains suspended solids. The amount of total suspended solids was calculated using a dry membrane filter with a pore size of 1.1 µm. The mass of the filter paper was measured using an electronic physical balance.
The water samples were passed through the filter paper, which was mounted on a conical flask. A suction pump was used to expedite the process. The suspended solids were deposited on the membrane filter, dried at 104 °C in an oven, and then cooled in a desiccator. Saturated solids are often present in raw water. Using a dry membrane filter with a 1.1 m pore size, the total amount of suspended particles was calculated. With the use of an electronic physical balance, the mass of the filter paper was calculated. The filter paper, which was fixed to a conical flask, was used to filter the water samples. The use of a suction pump accelerated the procedure. The membrane filter was coated with suspended particles, which were then dried at 104 °C in an oven before being cooled in a desiccator. The measurement of suspended particles was made possible by the difference in filter paper mass before and after filtering.
By eliminating the suspended solids from the sample, the total dissolved solids were calculated. A pipette was used to collect a 100 mL sample of water, which was then put in a borosilicate Petri dish. Over the boiling point of water, at 105 °C, the sample was dried in the oven. The Petri dish’s bottom developed dried residue. Using a precise electronic digital balance, the mass of the Petri dish before and after residue formation was estimated. TSS and total dissolved solids made up the total solids.
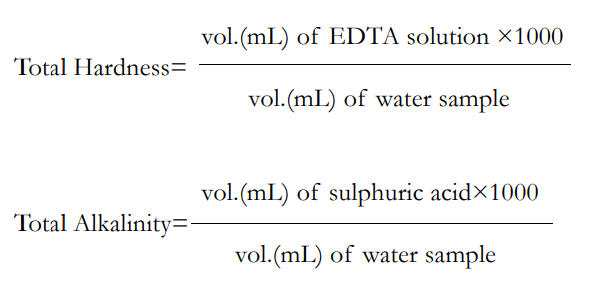
Hardness, total alkalinity, calcium, magnesium and chlorides: The hardness, alkalinity, calcium, magnesium, and chlorides of drinking water were determined using the ethylene diamine tetra acetic acid (EDTA) titrimetric method. AOAC employed the following methods: (973.52), (943.43), (920.199), and (920.200).
The conventional EDTA titrimetric method was used to determine the overall hardness. The EDTA standard solution was made by dissolving 4 g of sodium salt of EDTA and 0.1 g of magnesium chloride in 800 ml of water prior to beginning the titration. The Eriochrome Black-T indicator was made by mixing 100 ml of 95% ethanol with 4.5 g of hydroxylamine hydrochloride and 0.4 g of Eriochrome Black-T powder. One and twenty-five hundredths (1.25) g of magnesium salt of EDTA and 16.9 g of ammonium chloride were added to 143 ml of concentrated ammonium hydroxide to create the ammonia buffer. With distilled water, the solution was diluted to a volume of 250 ml. By using a burette to collect the standard EDTA solution, titration was carried out. Five drops of the Eriochrome Black-T indicator and one milliliter of ammonia buffer were applied to a conical flask containing a 100 mL water sample. After the solution took on a faint purple hue, titration was carried out until a blue hue emerged. Five times of the experiment were done in order to get a concordant value. For calculations, the following formulas might be used:
A technique called EDTA complexometric titration was used to quantify calcium and magnesium. The samples were titrated using an EDTA solution that contained 0.05 mol/L. The ammonia buffer was made by mixing 57 mL of concentrated ammonia with 7 g of ammonium chloride, then diluting the mixture to 100 mL with water while keeping the pH at 10.5. The magnesium chloride solution was created by mixing 500 mL of purified water with magnesium chloride hexahydrate. The Eriochrome Black-T indicator was made by combining 15 mL of concentrated ammonia and ethanol with 0.5 g of Eriochrome Black-T.
The water sample was divided into 100 mL and placed in a conical flask. The aliquot was then supplemented with 20 cc of EDTA solution, 10 mL of ammonia buffer, and 1 cc of Eriochrome Black-T indicator. Pink coloration was achieved by titrating the solution with 0.0023 mol/L magnesium chloride from the burette. It recorded how many moles and how much magnesium chloride were used in the titration. Because Mg2 + complexes with EDTA in a 1:1 ratio, the extra EDTA moles were equivalent to the moles of Mg2 + complexed with the solution. The moles of extra EDTA were deducted from the EDTA utilized in the samples for the final computation.
By adding sodium hydroxide to the sample, the distinct amount of Ca2 + was ascertained. Only Ca2 + is left in the sample after the Mg2 + precipitates out of the sample as magnesium hydroxide. EDTA was used to help with the titration. Given that Ca2 + and EDTA combine in a 1:1 ratio, the amount of Ca2 + is equal to the number of moles of EDTA consumed from the burette. By deducting the Ca2 + concentration from the total Mg2 + and Ca2 + concentrations, the calcium concentration may be computed.
By titrating with silver nitrate, chlorides in water samples of weight ‘W’ were identified. In a glass burette, a standard 0.0141 Normality ‘N’ silver nitrate solution was drawn. With the aid of a pipette, a 50 mL solution of the water sample ‘v’ was obtained. The sample was mixed with the potassium chromate indicator, which causes the solution to turn yellow. Up until a concordant value was attained, the sample was repeatedly titrated against silver nitrate. It was noted how much silver nitrate was used, or “Vs ”. The procedure was repeated using distilled water, and the amount of silver nitrate utilized, designated as “Vb ”, was taken into account.
Nitrates and conductivity: Following Method No. 4500-NO3 by John H. Margeson and colleagues in 1980, the cadmium reduction method was used to measure the presence of nitrates in water. Using a conductivity meter and Method No. 3.1 of the WHO (1982), the conductivity of samples of drinking water was determined.
Sodium (Na+) and Potassium (K+): The quantities of sodium and potassium in the samples were determined using a Flame Photometer (Jenway PFP7). Using pure water, the photometer was calibrated to zero. The gadget was then fed with water samples, and the sodium and potassium levels were noted. This technique used AOAC methods Nos. (973.54) and (973.53). Most of the samples contained alarmingly high-levels of potassium, raising worries about the possible negative health impacts on those who drink water from these sources without being aware of the hazards.
RESULTS
pH Level
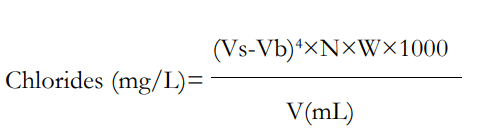
As shown in Figure 2, pH values exhibited a range of 7.28 to 7.9 among the water samples. The lowest pH was observed in Hoto, while the highest was recorded in Gamba. pH levels for Kwardu, Kachura, and Qumrah were measured at 7.45, 7.6, and 7.8, respectively. These pH values, presented as averages of three samples collected from each of the five locations, fall within the WHO permissible range of 6.50-8.50 for safe drinking water.
Figure 2. pH Values
Total Dissolved Solids
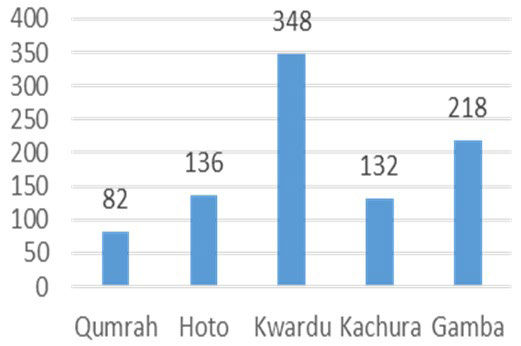
Figure 3 illustrates the variation in TDS across the samples, ranging from 82 mg/L to 348 mg/L. Kwardu exhibited the lowest TDS, while Qumrah had the highest. Specifically, TDS levels were measured at 136 mg/L, 218 mg/L, and 132 mg/L for Hoto, Gamba, and Kachura, respectively. None of the samples exceeded the WHO’s upper limit of 1000 mg/L for TDS concentration.
Figure 3. Total Dissolved Solids (mg/L)
Total Suspended Solids
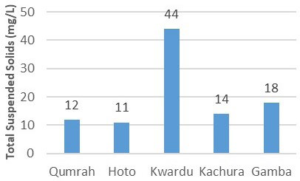
Referring to Figure 4, the range of TSS was found to be between 11 mg/L and 44 mg/L. Kwardu’s sample showed the highest TSS value, while Hoto’s spring water exhibited the lowest. Similarly, TSS readings for Kachura, Qumrah, and Gamba were recorded at 14 mg/L, 12 mg/L, and 18 mg/L, respectively. All samples, presented as averages of three measurements, adhered to the WHO’s maximum allowable threshold of 500 mg/L for TSS.
Figure 4. Total suspended Solids (mg/L)
Total Solids
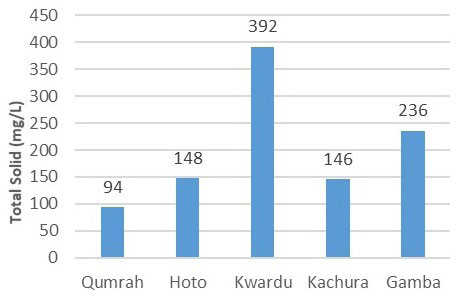
In Figure 5, the total solids content for Qumrah, Hoto, Kwardu, Kachura, and Gamba were determined as 94, 148, 392, 146, and 236 mg/L, respectively. These readings, averaged from three samples each, are well-below the WHO’s limit of 1500 mg/L for total solids in drinking water.
Figure 5. Total Solids (mg/L)
Total Hardness as Calcium Carbonate
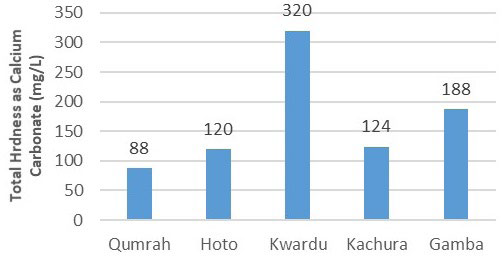
Figure 6 displays the range of total hardness as calcium carbonate, spanning from 72 mg/L to 232 mg/L. Among the samples, Kwardu exhibited the highest value, while Qumrah displayed the lowest. Notably, total hardness readings were 120 mg/L, 120 mg/L, and 188 mg/L for Hoto, Kachura, and Gamba, respectively. These values, calculated as averages of three samples each, align with the WHO’s recommended guidelines.16
Figure 6. Total Hardness (mg/L)
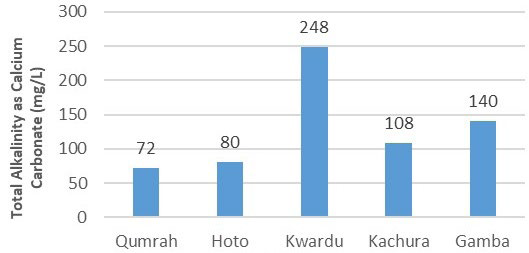
Alkalinity as Calcium Carbonate
Figure 7 outlines the trend in total alkalinity, which ranged from 72 mg/L to 248 mg/L. The sample from Qumrah showed the lowest alkalinity, indicating relatively lower water hardness. Other samples, with total alkalinity values of 80 mg/L in Hoto, 108 mg/L in Kachura, and 140 mg/L in Gamba, also complied with the WHO standards. The suggested upper limit for alkalinity is 500 mg/L.
Figure 7. Total Alkalinity (mg/L)
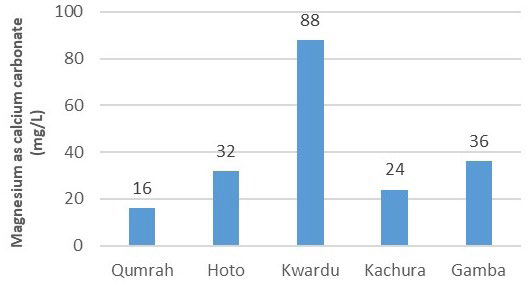
Calcium and Magnesium as Calcium Carbonate
In Figure 8, calcium concentrations were measured as 72 mg/L, 88 mg/L, 232 mg/L, 100 mg/L, and 152 mg/L for Qumrah, Hoto, Kwardu, Kachura, and Gamba, respectively. All samples, averaged from three measurements each, met the WHO criterion of 250 mg/L for calcium concentration. As for magnesium (Mg2 +), it ranged from 16 mg/L to 88 mg/L, with the highest concentration observed in Kwardu and the lowest in Qumrah. Figure 9 further illustrates magnesium concentrations of 32 mg/L, 24 mg/L, and 36 mg/L in Hoto, Kachura, and Gamba, respectively.
Figure 8. Calcium (mg/L)
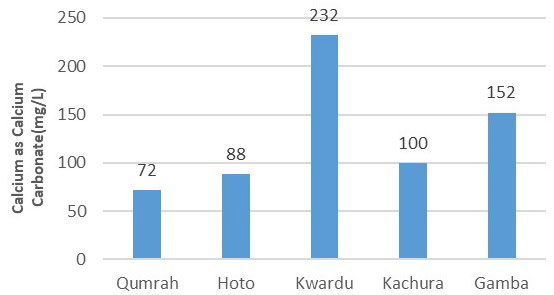
Figure 9. Magnesium (mg/L)
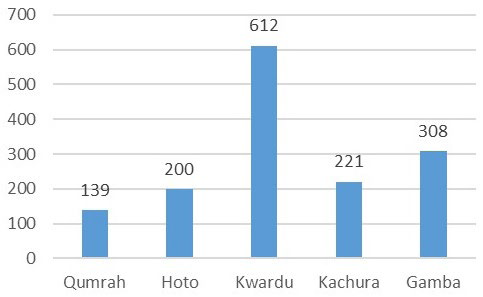
Conductivity and Nitrates
Conductivity, indicating the presence of ionized substances and dissolved minerals, was reflected in the samples’ values of 139 S/ cm, 200 S/cm, 612 S/cm, 221 S/cm, and 308 S/cm for Qumrah, Hoto, Kwardu, Kachura, and Gamba, respectively.17 As depicted in Figure 10, Kwardu exhibited the highest conductivity, while Qumrah demonstrated the lowest. None of the samples contained nitrates.
Figure 10. Conductivity (μS/cm)
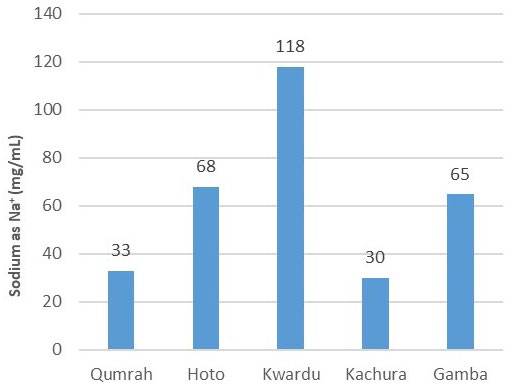
Sodium as Na+
Figure 11 displays the variation in sodium content, ranging from 33 mg/L to 118 mg/L as Na+. Kwardu’s sample had the highest sodium content at 118 mg/L, whereas Kachura’s sample had the lowest at 30 mg/L. The readings for Hoto, Qumrah, and Gamba were 68 mg/L, 33 mg/L, and 65 mg/L, respectively, all within the WHO’s 200 mg/L limit.
Figure 11. Sodium (mg/100 mL)
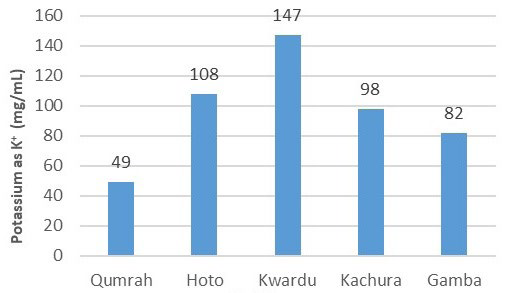
Potassium as K+
The concerning trend of elevated potassium (K+) levels was evident in all samples except for Qumrah. Qumrah’s sample had a potassium value of 49 mg/100 mL, compliant with WHO standards. However, as shown in Figure 12, Hoto, Kwardu, Kachura, and Gamba exhibited values of 108 mg/100 mL, 147 mg/100 ml, 98 mg/100 ml, and 82 mg/100 mL, respectively. These values exceeded the WHO’s acceptable limit of 75 mg/100 mL for potassium. Prolonged consumption of potassium at such levels can lead to muscular weakness, vomiting, and even cardiac issues (Tables 1 and 2).
Figure 12. Potassiums (mg/100 mL)
| Table 1. Average Results of Five Village Water Samples (pH, TDS, TSS, TS, TH, Mg) |
|
Area
|
pH |
TDS (mg/L) |
TSS (mg/L) |
TS (mg/L) |
Total Hardness as CaCO3 (mg/L) |
Calcium as CaCO3 (mg/L) |
Magnesium as CaCO3 (mg/L)
|
|
Qumrah
|
7.80 |
82 |
12 |
94 |
88 |
72 |
16 |
| Hoto |
7.28 1 |
136 |
11 |
148 |
120 |
88 |
32
|
|
Kwardu
|
7.45 |
348 |
44 |
392 |
320 |
232 |
88
|
|
Kachura
|
7.60 |
132 |
14 |
146 |
124 |
100 |
24 |
| Gamba |
7.90 |
218 |
18 |
236 |
188 |
152 |
36
|
| Table 2. Average Results of Five Village Water Samples (Alkalinity, Chloride, Nitrate, Conductivity, Sodium, Potassium) |
|
Village
|
Total Alkalinity as CaCO3 (mg/L) |
Chloride Cl-1 (mg/L) |
Nitrate as No2 -1 |
Conductivity (μS/cm) |
Total Hardness as CaCO3 (mg/L) |
Sodium as Na+ mg/100 mL |
Potassium as K+ mg/100 mL
|
|
Qumrah
|
72 |
8 |
Nil |
136 |
33 |
49 |
16 |
| Hoto |
80 |
10 |
Nil |
200 |
68
|
108
|
32
|
|
Kwardu
|
248 |
10 |
Nil |
612 |
118 |
147 |
88 |
|
Kachura
|
108 |
12 |
Nil |
221
|
30 |
98 |
24 |
| Gamba |
140 |
10 |
Nil |
308 |
65
|
82
|
36
|
DISCUSSION
The samples’ pH levels were slightly alkaline but can be considered acceptable for human consumption. The total dissolved solids were below the allowable range, as greater amounts of TDS may cause humans to have laxative or constipation effects.19 Total suspended solids may be caused by windy conditions and animal activity near water sources. Water’s natural hardness varied from gentle to moderately hard. According to certain research, hard water has a beneficial effect on the carotid atherosclerotic load.20 The samples’ moderate levels of calcium and magnesium can be beneficial for extending human life. Higher concentrations of calcium and magnesium in water may lengthen life expectancy, according to a study on the Slovak population.21 Dissolved solids can be directly linked to the conductivity of water samples. The samples with higher total dissolved solids exhibit higher conductivity. The analysis indicates that the samples’ sodium levels were within acceptable limits. The potassium K+ levels of four villages, Hoto, Kwardu, Kachura, and Ghamba, were alarmingly high, i.e., 108, 147, 98, and 82 mg/100 mL, respectively, but the water samples from Qumrah (49 mg/100 mL) are within the WHO range. The maximum accepted WHO level for potassium (K+) in drinking water is 75 mg/100 mL. Increased potassium levels cause muscular weakness and vomiting, and if K+ is consumed continuously for a long time, it can also stop the heart. It can make diabetic, cardiac, neurological, or renal problems worse.22,23 The kidneys and the gastrointestinal systems play a major role in maintaining the equilibrium of K+ in the body. Hyperkalemia results from the kidney’s inability to keep K+ homeostasis in check in cases of renal disorders. The disruption of the cellular gradient across cell membranes caused by the elevated K+ concentration can worsen diabetic, neurologic, and cardiac conditions.24 Potassium (K+) also has a key role in the body, i.e., it maintains normal fluid and electrolyte balance, facilitates many reactions, supports cell integrity, and assists in nerve impulse transmission and muscle contraction. Potassium above the maximum limit is dangerous. The presence of high concentrations of K+ renders the water drawn from these sources unfit for human consumption. Excess potassium is removed from water by the reverse osmosis (RO) method. RO plants were installed by the Water and Sanitation Agency (WASA) in the city area of Skardu, but this opportunity is not available in these five villages. It is suggested that the village community install RO plants. Microbial contamination can be removed by boiling drinking water for up to five minutes before consumption.
CONCLUSION
In the Gilgit-Baltistan Region of Pakistan, glaciers provide surface and subterranean water that is typically unfit for human consumption. Due to their increased potassium concentrations, water samples from Hoto, Kwardu, Kachura, and Gamba were determined to be unsafe to drink and pose a risk to those who are predisposed to renal, cardiac, or diabetic diseases. Before people drink this water, it needs to be treated. A RO process can remove excess potassium; thus, it is suggested that the Water and Sanitation Agency (WASA) should take immediate action to install RO plants on an emergency basis to save the lives of people in that region. The government should provide subsidies for the purchase and installation of such plants in these village communities. Boiling drinking water for about five minutes at home can simply remove microbial contamination. Villagers need to be informed about the potential diseases caused by drinking unsafe water.
INSTITUTIONAL REVIEW BOARD STATEMENT
This study was approved by the institutional review board (IRB) of PCSIR and the protocols used in this study were approved by the committee.
CONFLICTS OF INTEREST
The authors declare that they have no conflicts of interest.


