INTRODUCTION
Since Alma Ata Declaration on 1978, that expressing the need for urgent action by all governments, all health and development workers, and the world community to protect and promote the health of all the people of the world, major efforts have been made in nearly all developing countries to expand primary health care (PHC) services. This has been achieved through expanded health worker training, and major health system reorganization.1
The main purpose of assessment of the quality of primary health care is to promote the improvement of services or programs or to identify points of weakness within programs that call for strengthening.2
Therefore, healthcare facilities have seen recent movements towards continuous quality improvement, and according to Donabedian declaration for incorporating patient perception into quality assessment, healthcare managers thus incorporate patient-centered care as a major component in the healthcare mission.3
In Germany, measuring patients’ satisfaction has been required since 2005 as an element of quality management reports.4 Therefore, measurement of patient satisfaction is a legitimate indicator for improving the services and strategic goals for all healthcare organizations.5
World Health Organization (WHO) working group proposed four components for the quality of health care, which are: 1- resource uses, referred to economic efficiency, 2- performance for technical quality, 3- risk management associated with the provided care, 4- satisfaction of the consumer.6
In Donabedian’s quality measurement model, patient satisfaction was defined as patient-reported outcome measure, while the structures and processes of care can be measured by patient-reported experiences,7 in addition, Mohan et al. referred to patients satisfaction as patients’ emotions, feelings and their perception of delivered healthcare services.8
The reviewed literature agreed on the fact that there is an impact of measuring patient satisfaction on quality improvement of care. Patients’ evaluation of care is a realistic tool to provide opportunity for improvement, enhance strategic decision making, reduce cost, meet patients’ expectations, frame strategies for effective management, monitor healthcare performance of health plans and provide benchmarking across the healthcare institutions.7,8,9,10,11
In Sudan, hypertension has the highest prevalence among the major non-communicable diseases (NCDs), according to WHO estimation for Sudan, the prevalence was 26%, and in Khartoum State, where this study was conducted, the prevalence was 23%. In addition, it was encountered as one of the 10 leading diseases treated in health facilities (outpatients) and one of the 10 leading causes of deaths in Sudan.12
As stated by Sudan Health Map 2012, there were 2040 PHC facilities, supposed to deliver, promotive, preventive, curative, and rehabilitative services.13
Therefore, delivery of care has been based on the PHC approach, as it is the first contact of the community with the health system, and high percentage of population use PHC, because it is more accessible and affordable and hence it has the drive to reach vulnerable populations.
Therefore, patient satisfaction had been a part of my research study for assessment of quality of hypertension management at public primary health care Facilities in Sharg-Alneel locality, Khartoum State, Sudan.
Justification
Patient satisfaction surveys have gained increasing attention as meaningful and essential sources of information for identifying gaps and developing an effective action plan for quality improvement in healthcare organizations. Thus, it is justifiable to conduct this study in order to highlight the currently provided services and its quality at the PHC facilities, aiming to generate information that help in improving hypertension services at PHC level.
Objective
To study the degrees of patients’ satisfaction with the provided services at Public Primary Health Care Facilities in Sharg-Alneel locality, Khartoum State, Sudan, aiming to generate information for establishing quality control program.
METHODOLOGY
Facility-based cross-sectional descriptive study, conducted at public primary health care facilities. The study population composed of 147 hypertensive patients who were available during the data collection period in 29 public primary health facilities, with the following including and excluding criteria.
Inclusion criteria
- Sudanese patients
- Hypertensive patients
- Males and females
- Adult and elderly (above 18 years of age),
- Cold cases
- Resided in Shargelneel Locality
Exclusion criteria
- Non-Sudanese patients
- Non- hypertensive patients
- Children (below 18 years)
- Urgent and emergency patients
- Non-resident in Shargelneel Locality
Sampling method
Data collection tools:
It has been found that, the most common assessment tool for conducting patient satisfaction studies were the standardized questionnaires (interviewer-administrated).14,15
Therefore, a well-structured standardized administered, questionnaire was developed, validated, pretested and used for the data collection, and British English Language was used as the main language for the questionnaire.
The questionnaire was composed of four chapters, included 20 close-ended questions. The questions in every chapter covered the categories of the services needed by the patients, which included; services available all the time, easily accessible, feeling of comfort, positive attitude of health providers toward them and disappearance of symptoms.16
Sample size:
Sample size has been estimated using the formula:
n= Z2 P (1-P)
e2
Where;
n = Sample size
z = Standard normal deviate = 1.96 (at 95% confidence interval)
p = Proportion of the characteristic under study estimated in the target population = 0.23 (according to Khartoum STEP wise NCDs risk factors Survey 2006)
q = 1-p
e = Error allowed = 0.05
So the sample size was found to be: n= 1.9620.23(1-0.23) = 272
0.052
The total number of the patients that found during the data collection period, which was three months, was 147, in Sudan, most of hypertensive patients were managed either in hospitals or in private clinics, so we found it difficult to cover all the 272, therefore, and as they were less than 200, all of them were recruited in this study.17
The collected data were edited then entered and analyzed by the Statistical Package of Social Services (SPSS), version 16. (SPSS Inc. Released 2007, SPSS for Windows, version 16.0. Chicago, SPSS Inc)
For the data entry, two persons were working together for data entry, one of them for reading, and the other entering the data and the files were tested first before data entry to identify any difficulties. They worked successfully and no errors were detected.
Data analysis:
General description of the participants and general findings of the study were presented as cross tabulation and frequencies, and p-value of less than (0.05) was taken as significant.
Ethical considerations:
Approvals were obtained from; The Sudan Medical Specialization Board (SMSB), Federal Ministry of Health, and Khartoum State Ministry of Health.
Hypertensive patients were initially informed and their consent was taken, including full explanation of the study objectives, expected outcomes and rights of respondents or refusals with extreme confidential processing of collected data.
RESULTS
Figure 1. Degree of Patients’ Satisfaction with the Provided Services

DISCUSSION
In order to assess the quality of the services performed by the health system, patient satisfaction measurement can be considered as important elements to continue working in centers, patient satisfaction was defined by some authors as a degree of congruence between patient expectations of ideal care and their perceptions of real care received.9
A total number of 147 hypertensive patients were enrolled in this study after their consents were obtained. The most affected age group was 40-60 years, represented 66% as shown in Table 1. Females were found to be more than males represented 68% and 38 % respectively as represented in Table 1.
| Table 1. Represented the Correlation Between the Demographic Factors (Gender. Age Group, Income, Education and Geographical Accessibility) vs. Satisfaction |
|
Demographic factors vs satisfaction
|
| Gender |
Yes
|
|
No
|
|
Total
|
|
Number
|
Percentage |
Number |
Percentage |
Number |
Percentage
|
| Males |
39
|
36.4 |
17 |
42.5 |
56 |
38.1
|
| Females |
68
|
63.6 |
23 |
57.5 |
90 |
61.9
|
| Total |
107
|
100.0 |
40 |
100.0 |
147 |
100.0
|
| Age group |
| ≤ 40 |
7
|
6.5 |
3 |
7.5 |
10 |
6.8
|
| 41-60 |
72
|
67.3 |
25 |
62.5 |
97 |
66.0
|
| 61-80 |
25
|
23.4 |
12 |
30.0 |
37 |
25.2
|
| > 80 |
3
|
2.8 |
0 |
0 |
3 |
2.0
|
| Total |
107
|
100.0 |
40 |
100.0 |
147 |
100.0
|
| Income |
| Low |
66
|
61.7 |
28 |
70.0 |
94 |
63.9
|
| Moderate |
32
|
29.9 |
7 |
70.0 |
39 |
26.5
|
| High |
9
|
8.4 |
5 |
12.5 |
14 |
9.5
|
| Total |
107
|
100.0 |
40 |
100.0 |
147 |
100.0
|
| Education |
| Illiterate |
9
|
8.4 |
5 |
12.5 |
14 |
9.5
|
| Basic |
29
|
27.1 |
6 |
15.0 |
35 |
23.8
|
| Secondary |
61
|
57.0 |
19 |
47.5 |
80 |
54.4
|
| University |
7
|
6.5 |
8 |
20.0 |
15 |
10.2
|
| Post graduate |
1
|
0.9 |
2 |
5.0 |
3 |
2.0
|
| Total |
107
|
100.0 |
40 |
100.0 |
147 |
100.0
|
| Residents from the nearest health facility – (Geographical accessibility) – vs. satisfaction |
| 0-10 kilometers |
81
|
75.7 |
32 |
80.0 |
113 |
76.9
|
| 11-20 kilometer |
22
|
20.6 |
5 |
12.5 |
27 |
18.4
|
| 21-30 kilometers |
4
|
3.7 |
1 |
2.5 |
5 |
3.4
|
| More than 30 kilometers |
0
|
0 |
2 |
5.0 |
2 |
1.4
|
| Total |
107
|
100.0 |
40 |
100.0 |
147 |
100.0
|
For general satisfaction as illustrated in Figure 1, 72.8% of hypertensive patients’ were satisfied with the provided services.
The correlation between the satisfaction and demographic factors such as gender, age, income and level of education were examined also, and the results represented that; female patients and the patients with age group (41-60 years) were found to be more satisfied represented 63.6% and 67.3 % respectively. Regarding the income level, the result revealed that, the low-income level patients were more satisfied represented 61.7%, and those with basic and secondary levels of education had higher scores of satisfaction as compared with others as shown in Table 1.
Geographic access may be measured by modes of transportation, distance, travel time, and any other physical barriers that could keep the client from receiving care.18 In this study, nearly 77% of the patients lived at a distance of 0-10 kilometers from the nearest health facility, which means that the service is accessible for most of the patients. Therefore, 75.7% of those lived 0-10 kilometers from the health facility, were satisfied with the provided services, as demonstrated by Table 1.
The results for the extent or the degree of satisfaction as represented by Table 2, female patients, the age group 41-60 years, and those with low income and secondary level of education were found to get high score of satisfaction. In general, only 11.2% were very satisfied, 40.2% were somewhat satisfied and 48.6 were just satisfied.
| Table 2. Represented the Correlation Between the (Gender, Age Group, Income, Education Level and Geographical Accessibility) and the Extent of Satisfaction |
| Gender |
Extent of Satisfaction
|
Total |
| Very satisfied |
Somewhat satisfied |
Satisfied
|
|
Number
|
Percentage |
Number |
Percentage |
Number |
Percentage |
Number |
Percentage
|
| Male |
6
|
50.0 |
12 |
27.9 |
21 |
40.4 |
39 |
36.4
|
| Female |
6
|
50.0 |
31 |
72.1 |
31 |
59.6 |
68 |
63.6
|
| Total |
12
|
100.0 |
43 |
100.0 |
52 |
100.0 |
107 |
100.0
|
| Age group |
|
|
| ≤ 40 |
1 |
8.3 |
2 |
4.7 |
4 |
7.7 |
7 |
6.5
|
| 41-60 |
7
|
58.3 |
31 |
62.5 |
34 |
65.4 |
72 |
67.3
|
| 61-80 |
4
|
33.3 |
8 |
72.1 |
13 |
25.0 |
25 |
23.4
|
| > 80 |
0
|
0 |
2 |
18.6 |
1 |
1.9 |
3 |
2.8
|
| Total |
12
|
100.0 |
43 |
100.0 |
52 |
100.0 |
107 |
100.0
|
| Income |
|
|
| Low |
9
|
75.0 |
22 |
51.2 |
35 |
67.3 |
66 |
61.7
|
| Moderate |
2
|
16.7 |
14 |
32.6 |
16 |
30.8 |
32 |
29.9
|
| High |
1
|
8.3 |
7 |
16.3 |
1 |
1.9 |
9 |
8.4
|
| Total |
12 |
100.0 |
43 |
100.0
|
52 |
100.0 |
107 |
100.0
|
| Education |
|
|
| Illiterate |
1 |
8.3 |
7 |
16.3
|
1 |
1.9 |
9 |
8.4
|
| Basic |
2 |
16.7 |
14 |
32.6
|
13 |
25.0 |
29 |
27.1
|
| Secondary |
9 |
75.0 |
20 |
46.5
|
32 |
61.5 |
61 |
57.0
|
| University |
0 |
0 |
2 |
4.7
|
5 |
9.6 |
7 |
6.5
|
| Post graduate |
0 |
0 |
0 |
0
|
1 |
1.9 |
1 |
0.9
|
| Total |
12 |
100.0 |
43 |
100.0
|
52 |
100.0 |
107 |
100.0
|
| Residents from the nearest health facility – (Geographical accessibility) – vs. satisfaction |
|
|
| 0-10 kilometers |
11 |
91.7 |
29 |
67.4%
|
41 |
78.8% |
81 |
75.7%
|
| 11-20 kilometer |
1 |
8.3 |
10 |
23.3
|
11 |
21.2 |
22 |
20.6
|
| 21-30 kilometers |
0 |
0 |
4 |
9.3
|
0 |
0 |
4 |
3.7
|
| > 30 kilometers |
0 |
0 |
0 |
0
|
0 |
0 |
0 |
0
|
| Total |
12 |
100.0 |
43 |
100.0
|
52 |
100.0 |
107 |
100.0
|
Same results were found in two studies, one conducted in Scotland during February and March 2002, and the other was conducted in tertiary hospitals in the USA.15,19 In addition, Nguyen et al20 and Jenkinson et al21 declared from their studies that the two strongest and most consistent determinants of higher satisfaction were the old age and the better health status.
In contrast, a study which was carried out in Taiwan found that patient characteristics such as age, gender and education level only slightly influenced patient satisfaction.11
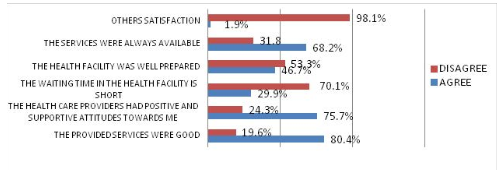
Other important areas for patient satisfaction, were the relationship between the patients and the care providers, in this study as demonstrated in Figure 2.0, 75.7% of the patients were satisfied with the positive attitudes of the care providers.
Figure 2. Other Reasons of Patients’ Satisfaction Out of those Satisfied
Three studies found that interpersonal communication skills of physicians in terms of their attitude, explanation of conditions, level of care, emotional support, respect for patient preferences and involving patients in decision-making were more influential factors than clinical competence and hospital tangibles on patient satisfaction.11,22,23
In addition, the main outcome of a study using the data of 202 participants in USA, concluded that most determinants of patient satisfaction was related to communication, empathy and caring from hospital personnel.24
A survey conducted in Ireland revealed that effective communication and clear explanation had the strongest impact in improving the overall patient satisfaction among other attributes of care.25
Other areas for satisfaction that were measured, are the constant availability and the goodness of the provided services, the results showed that, 68.2% of the patients were satisfied with the constant availability of the services and 80.4% of them were agreed that the provided services were as good illustrated in Figure 2.
Figure 2 also revealed that, 46.7% were satisfied with the physical environment of the health facility, and only 29.9% were satisfied with the waiting time in the clinic.
A study carried out in five different hospitals in Scotland found that physical comfort had the highest satisfaction rate compared to other core dimensions: information, coordination of care and emotional support.20
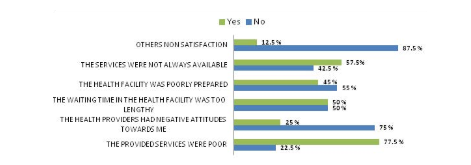
On the other hand, 27.2% of the patients were generally not satisfied as illustrated in Figure 1. Out of them ; 77.5%, 25%, 57.5%, 50% and 45% were dissatisfied with the; Provided services, negative attitudes of health providers towards them, unavailability of the services in a constant manner, lengthy waiting time, and poor waiting areas and the poor physical environment of health facilities respectively, as shown in Figure 3.
Figure 3. Reasons of Patients’ Dissatisfaction Out of those Dissatisfied
Furthermore, in 2012 Arshad et al reported that the major dissatisfaction in an outpatients department was the long waiting time and overcrowded registration.23
In contrast, a study carried out in outpatients departments in South Korea revealed that environment and amenities were scored lowest for a patient satisfaction index.26
However, satisfaction is a relative measure, may be influenced by many factors that should be considered e.g. patient expectation, age, literacy levels, social elements within the society e.g. (financial status, demographics (urban/rural), illness, choice of services, technology and patient professional relationship.27
CONCLUSION
Most of the patients were satisfied with positive and supportive attitudes of the care providers towards them. Moreover, the main reasons for dissatisfaction were the long waiting time, and poor waiting areas and the physical environment of the facilities.


