INTRODUCTION
Morocco experienced in 2008 an epizootic of “Peste des Petits Ruminants” (PPR) caused by an invasive lineage IV virus, particularly in North Africa. It is a cross-border disease of sheep and goats that is widespread in Africa, the Middle East and Asia and can manifest as enzootic (diminished gravity but continuously present) when settles in a country as a result of insufficient control measures or manifest as epizootic (spectacular severity but transient in case of appropriate control measures) when the disease has just appeared. The assessment of the Moroccan epizootic for this disease reported 257 outbreaks scattered throughout the northern half of the country in just over three months1 (Figure 1), despite the low morbidity (11, 93%) and mortality (5.53%) rates observed in small ruminants,1 which triggered the role of sheep mobility in the spread of the disease.
Figure 1: Geographical Distribution of PPR outbreaks during the 2008 Epizootic in Morocco
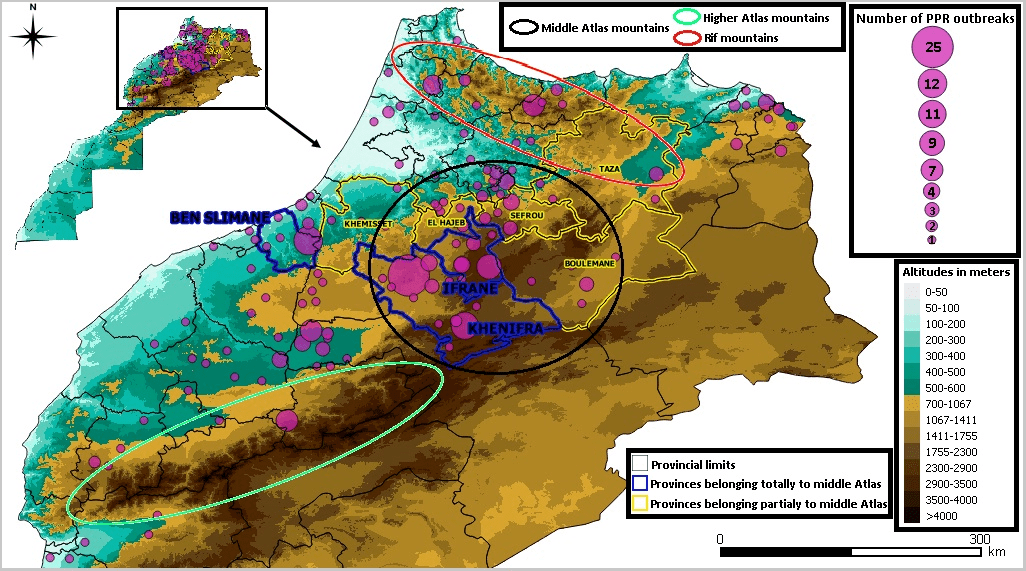
Surveys conducted during the epizootic of 20082 showed that the disease was concentrated in three provinces of northern Morocco including the one hosting the fattening centers (Benslimane) and the two large sheep provinces of the Massif of Middle Atlas (Khenifra and Ifrane) which supplies in sheep the first province (Table 1).
| Table 1. Total Number of PPR Outbreaks During the Epizootic of 2008 in the Provinces of the Middle Atlas1 |
| Province |
Number of Outbreaks |
| Khenifra |
53 |
| Ifrane |
22 |
| Benslimane |
15 |
| Sefrou |
10 |
| Boulemane |
7 |
| Taza |
6 |
| El Hajeb |
4 |
| Khemisset |
4 |
The Middle Atlas is a mountain range extending over 350 km (Figure 1). It is home to a sheep-rearing system of the lambs producing type, mainly exploiting the Timahdite breed, which is coveted for the quality of its meat and which is consequently marketed in other parts of the country, mainly through fattening centers. The farming system is lamb producing type, extensive and based mainly on forests, grazing path and marginally on agricultural by-products. This mode of conduct promotes contacts between herds of different origins and is conducive to the transmission of diseases.
In Morocco, apart from areas with almost exclusively goats, which are confined to the high altitudes of the Rif and High Atlas Mountains (Figure 1), small ruminants live in mixed herds of sheep and goats (when these last exist) throughout the rest of the country. At the national level, the sheep population of 19,956,384 is more three times higher than the goat population of 6,235,861.3 Based on the above and considering that sheep are much more mobile and more present in the field than goats, it has been decided to carry out mobility surveys in sheep.
For countries that do not have a sheep identification and traceability system, animal mobility surveys is an important epidemiological tool for studying commercial movements in this species and for identify key exchange hubs to guide monitoring efforts.
Thus, following the PPR epizootic that affected Morocco in 2008, it was decided to carry out sheep mobility surveys at the provinces with the largest number of outbreaks in order to map the existing flows and treat them by the Social Network Analysis (SNA) method.
The mapping of movements is based on the use of geographic information system (GIS) software to represent commercial flows, while the method of social networks analysis has been borrowed from sociology. It is based on the theory of graphs in mathematics and assumes that the contact network has a greater influence than the personal behavior on the spread of the disease.4
A social network consists of a set of individuals or groups that form nodes, connected by links that represent a certain type of relationship (friendship for example) or interaction (sexual for example), or also indicating the presence or the absence of a relationship, such as the fact that a male and a female have come closer, coupled or not.5 The analysis of social networks allows an assessment of the influence that connections between individuals can have in the transmission of a given disease.4
Historically, the first example of the use of SNA in epidemiology dates back to sexually transmitted diseases. In 1985, Klovdahl used this method to describe a focus (outbreak), and thus provided arguments in favor of the theory that an infectious agent causing acquired immune deficiency syndrome (AIDS).6 The method has shown in particular the importance in epidemiology of the diseases that make the link between the central individuals (who maintain the disease) and the individuals of the periphery (with a lower prevalence).4 In recent years the method has also been used in animal epidemiology, particularly in the movements of the livestock.7 Indeed, in Great Britain Webb used it in 2006 to determine the role of agricultural competitions in the transmission of ovine diseases.8 Kao et al9 studied cattle movements in the United Kingdom to estimate the risk of outbreak of fibromuscular dysplasia (FMD), and provided guidance for targeted surveillance and control, which would be effective in reducing this risk.9
The SNA method allows calculating a large quantity of indices and parameters, which will make it possible to qualify the network and to classify the nodes according to their importance.10 There are different types of parameters that can be calculated from the network:
The first category brings together the cohesion parameters at the network level. They apply to all nodes and links, and allow for example to have an idea of how the structure of the network influences the spread of the disease. Examples of such parameters are size, density, coefficient of clustering (all gives information on global connectivity within the network).
The second category includes connection and connectivity settings. These are parameters that reflect the ability of one node to reach others by following network links. It tells us that the nodes are connected or not, regardless of the length of the path to take. A network is said to be connected if from each node it is possible to reach all the others. A “component” is a largest set of connected nodes.
The third category groups the centrality parameters.11,12 These settings indicate whether a node is central and important in the network. It measures its structural importance. These parameters are widely used in epidemiology to detect individuals/nodes, or key actors. Example of parameters: The “degree” which informs about the infectivity of the node and which includes the “indegree” indicating the incoming movements and expressing the power of the node to self-infect as well as the “Outdegree” indicating the outward movements and expressing the infectivity to other nodes in contact with this node, the “betweenness” which represents the ability of the node to force flows to pass through it before reaching the other nodes and informs about the essential role of the node as a crossroads hub of mobility. The list of the types of parameters used is exhaustive, but those mentioned above are the most frequently encountered.
This study is the first conducted in Morocco using GIS mapping and the SNA tool in animal mobility, and was conducted to identify the main possible outbreak centers for sheep diseases to guide surveillance.
Choice of the Study Area
The middle Atlas occupies an area of 23,000 km², it is linked to seven provinces whose administrative boundaries of three of them (Khénifra, Ifrane and Sefrou) are an integral part of this mountain, while four other provinces contribute only by a part of their territory in the geography of this massif (Taza, Khémisset, Boulemane and El Hajeb) (Figure 1).13
Among Middle Atlas breeders, the provinces of Khenifra and Ifrane were selected for this study due to:
(i) Their significant sheep potential (Figure 2), (ii) the high incidence of PPR outbreaks during the 2008 epizootic (Table 1 and Figure 1), (iii) their significant geographic coverage (Figures 1 and 2). and (iv) the presence at their level of the largest sheep trading markets in the massif in terms of trade volume (Figure 2).
Figure 2. Study Area Indicating Importance of Strategic Markets3 and the Importance of Sheep by Province14
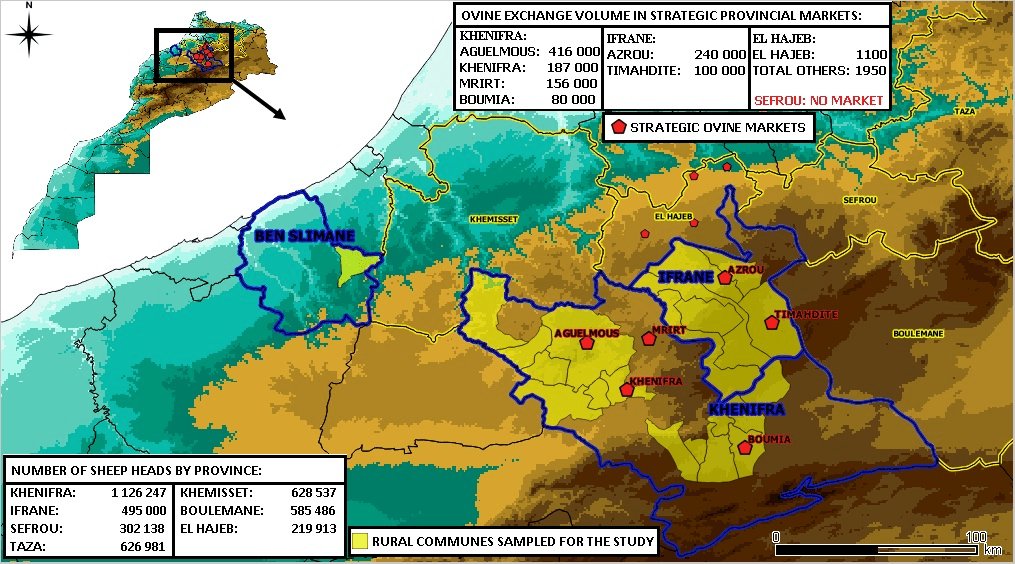
Among fatteners, the study area was represented by the commune of Sidi Bettache which groups together all fattening centers in the province of Benslimane (Figure 2) with a reported production of 65,000 head and a potential production capacity of 157,550 heads.
Choice of Method
In addition to using the Qgis software for flow mapping, the SNA method, which is the most appropriate for studying the relationships between different key players in a network, was adopted with a view to examine the different components of the sheep mobility network in the targeted area.
Type of Study and Period
This is an epidemiological study of the descriptive transversal type which aims to map the direction and the range of sheep flows and to study the mobility network by the social networks analysis method to describe its structure, its fragility to epidemics, to evaluate the influence that can have the connections between the various actors of the network in the transmission of a given disease but also to determine the main hubs of exchange to guide the surveillance.
The data collection work in the field lasted a total of 4-weeks from March 17 to April 11, 2014.
Population
Target population: In lamb’s producers, the target population consists of the lamb’s producer’s breeders of the middle atlas.
For fatteners, the target population consists of fattening farmers in the province of Benslimane.
In traders, the target population concerns the traders of livestock markets of the middle atlas.
Source population: For lamb’s producers, the source population is made up of lamb’s producers belonging to the provinces that form an integral part of the middle Atlas Massif, which showed a high incidence of PPR outbreaks during the 2008 epizootic and which include a high sheep population and strategic cattle markets with a large volume of exchange, namely the provinces of Khenifra and Ifrane.
In fatteners, the source population consists of fattening farms in the commune of Sidi Bettache, which groups together all fatteners in the province of Benslimane.
Among traders, the source population concerns traders in strategic livestock markets in the middle atlas with the largest trade exchange volume in sheep.
Sample Size
A total of 807 breeders producing lambs, sheep fatteners and traders were surveyed, including 54 fatteners in fattening workshops (sampling fraction of 48.6%), 150 owners (breeders and traders) in livestock markets of Middle Atlas and 603 producing lamb breeders of the Massif (sampling fraction at the Massif level of 6.64%).
In fatteners: Sampling was carried out in fattening centers on the 111 fatteners identified by Office National de Sécurité Sanitaire des produits Alimentaires (ONSSA). A sample of 54 farms was randomly selected using the “OpenEpi, Version 2” software that represent a survey fraction of 48.6% in the municipality of Sidi Bettache.
In livestock markets: The investigation in fattening zone allowed going up towards the markets of the middle atlas. In Ifrane province, the two existing strategic livestock markets of the province, Azrou and Timahdite were investigated (Figure 2). Due to the heavy rainfall that occurred on the day of the Azrou market, only 30 owners could be interviewed, while 60 owners were interviewed at the Timahdite market.
In the province of Khénifra, two strategic livestock markets out of four present were investigated, Mrirt and Boumia Markets (Figure 2). In order to optimize the time allocated to the survey, 30 owners were interviewed in each of these two markets since they have the same day of occurrence which is Thursday but they are distant geographically. The two other strategic markets in the province, Aguelmous and Khénifra, could not be investigated since their days of occurrence were during the last two days of the week. It should be noted that livestock markets in Morocco are weekly markets that take place only once a week.
In lamb’s producer’s farms: In lamb’s producers zone a sampling was carried out on the lamb’s producer’s databases of the provinces of Khénifra and Ifrane. Four hundred and twenty-six farmers were sampled on a total of 8594 farmers (survey fraction of 4.95%) spread over 15 communes out of a total of 38 communes in the province of Khenifra (Figure 2) and 207 farmers were sampled on 3184 farmers presents (fraction of survey of 6.50%) spread over six municipalities out of a total of eight in the province of Ifrane (Figure 2). Sampling was done by SPSS software.
Data Collection
The questionnaire used: For this study a specific anonymous questionnaire of light character not exceeding one line per owner was used. It includes questions on the communes of origin and destination of the movements that are being made, on the type of origin and destination (producing lamb farms, livestock market, fattening workshop or slaughterhouse) and on the number of sheep in the transaction, including the percentage of females and the percentage of lambs under 6-months of age, then the questionnaire looks at the presence of the extensive component in the flocks surveyed (to get an idea of the possibility of collective contamination of herds in collective pastures), as well as information on the majority race (to identify the breeds that are most involved in this commercialization circuit).
Test of questionnaire: The questionnaire was tested in the field before starting in a market of Skhirate-Temara province on a dozen farmers.
Conduct of investigations: The epidemiological unit defined is the flock unit and the survey was conducted in the form of a face-to-face interview with the owner (trader, farmer). All questionnaires were administered by the same investigator in each farm and market.
Data Entry
The data has been entered on access tables and their processing was performed on the Quantum GIS (Qgis) 2.8.3 software for cartography and the (R) software for the SNA analysis.
Data Analysis Method
With the Qgis software, all the sheep flows surveyed were mapped to highlight the direction and range of the movements, while the R software made it possible to estimate the various indicators that allows to characterize the contact network, with general measures such as density, average distance and diameter. Other parameters were evaluated, including the centrality parameters with degrees (degree, indegree, outdegree) and betweenness to identify the most important key actors/nodes of the network. To complete these analyzes, measures such as “components” (“strong components” and “weak components”) and “clustering coefficients” were calculated to determine the cohesion between the different municipalities, in addition to the “cutpoints” who have been identified.
RESULTS
Flow Analysis
Flow mapping: The communes of the middle atlas hosting the major strategic markets are key points in the articulation of flows, as is the municipality gathering the fatteners (Figures 3, 4 and 5). It can be seen that there are long-range trade of sheep flows converging mainly on urban consumption centers (Figures 4 and 5).
Figure 3. Graphic Representation of the Ovine Network
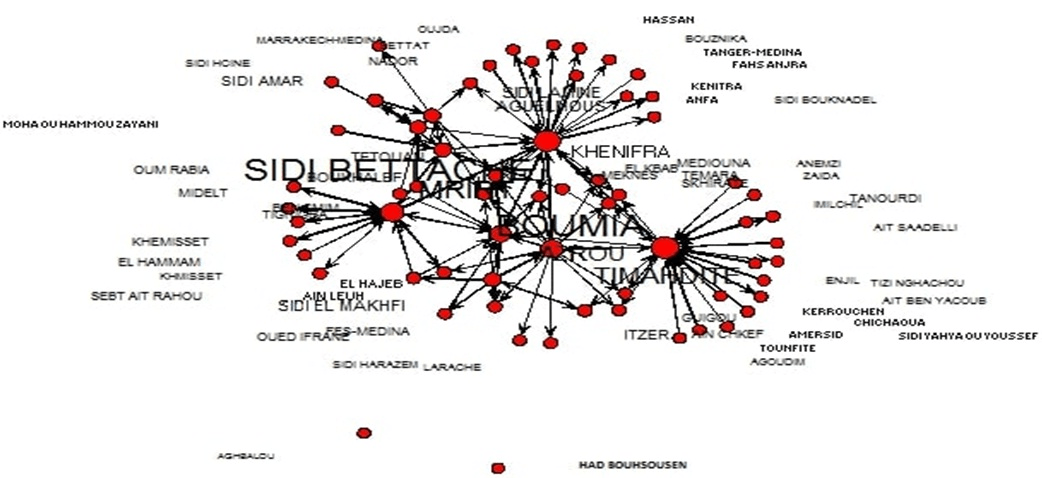
Figure 4. Mapping of Sheep Flows, Degree and Strong Component
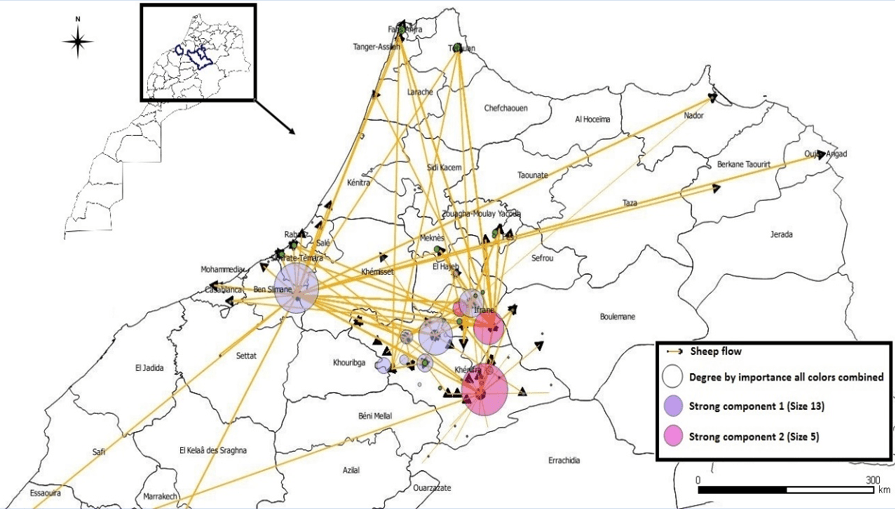
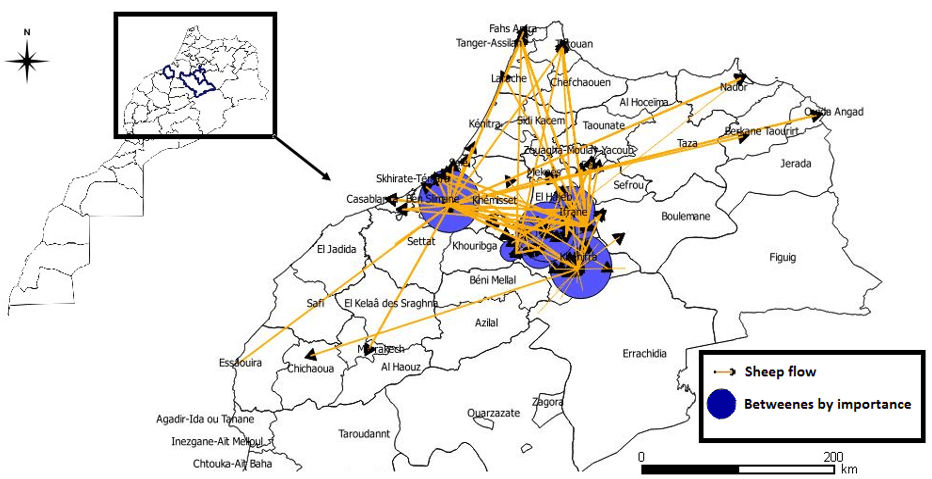
Figure 5. Mapping of Sheep Flow and Betweenness
Type of movements: From the sheep mobility database, we retrieved information on the origins and destinations of the flows to create matrices of adjacencies. These represent movements with online origins and column destinations. A total of 133,539 sheep in circulation distributed among the different establishments was recorded corresponding to a total of 808 movements.
Within the network, flocks of producing lamb’s breeders to markets are the most important. In fact, 58.58% of sheep movements take place from producing lamb farms to markets; movement between lamb’s breeders does not exceed 11.9%, whereas movements from markets to fattening centers represent 10.63%. Percentage of the network’s movements, the latter are supplied exceptionally at the level of markets, while market-to-market movements account for 8.6% of these trips (Table 2).
| Table 2. Movement of Sheep between Different Establishments |
|
To
From
|
Slaughter Houses |
Fattening Centers |
Lamb’s Breeders |
Markets |
Total |
| Fattening Centers |
5490 (4,11%) |
0 |
900 (0,67%) |
1100 (0,82%) |
7490 (5,6%)
|
| Lamb’s Breeders |
1590 (1,19%)
|
0 |
15785 (11,82%) |
78237 (58,58%) |
95612 (71,59%)
|
| Markets |
610 (0,45%)
|
14200 (10,63%) |
4190 (3,13%) |
11437 (8,56%) |
30437 (22,79%)
|
| Total |
7690 (5,75%)
|
14200 (10,63%) |
20875 (15,63%) |
90774 (67,97%) |
133539 (100%)
|
Analysis of Network
Of the total of 808 movements found, 128 distinct flows were identified. Several movements between the same origin and destination as well as several animals in the same movement are considered as a single flow. In the presented network, the nodes represent the markets, the slaughterhouses, the lamb’s producers or the fatteners.
Description of Network: The network has 65 nodes. On average one commune is connected to more than 3 times (3,477) (average degree) with other municipalities. The network has a low density of the order of 0.027. Two communes are on average separated (average distance) by almost 5 (4.83) animal movements (Table 3).
| Table 3. Network Description Settings |
| SNA Parameters |
Value |
| Number of nodes |
65 |
| Length |
4.831953 |
| Mean of Degree |
3.477 |
| Mean of Out degree |
1.738 |
| Mean of In degree |
1.738 |
| Mean of Betweenness |
38.69 |
| Diameter |
6 |
| Density |
0.027 |
| Number of (weak components) |
3 |
| Size of the largest component |
13 |
| Cutpoints |
5 |
Graphic representation of the network: The graphical representation makes it possible to visually identify that the network is connected, if we are interested in a node we can then see its connection links and also appreciate the central position or not of this node represented graphically by a variable size. The networks were represented with different thicknesses of the links according to the importance of the route taken between two communes, and the direction of the arrow corresponds to the direction of the flow (here we have a directed network because we have the information of incoming and outgoing). The size of the wording indicates the importance of the locality. We can easily notice the central position of the communes of Sidi Bettache, Boumia, Mrirt, Azrou and Timahdite (Figure 3).
Indicators
Degree: The classification of communes according to the number of total movement (degree), of entries (in degree) and of outputs (out degree) was calculated. The average number of links is 3,477 (Table 3) with a maximum of 26 (Table 4). The average of the entries and exits was 1,738 (Table 3) with a maximum of 15 for the entries and 17 for the exits (Table 4). Given the large number of nodes studied, only the 10 with the highest centrality indicators were presented (Table 4).
| Table 4. Ranking of the Top Ten Localities According to their Number of Degree, In-Degree et Out-Degree |
| Total Degree |
In Degree |
Out Degree |
| Boumia (26) |
Boumia (15) |
Sidi Bettache (17) |
| Sidi Bettache (25) |
Mrirt (10) |
Timahdite (15) |
| Mrirt (19) |
Azrou (9) |
Boumia (11) |
| Timahdite (17) |
Sidi Bettache (8) |
Mrirt (9) |
| Azrou (14) |
Khenifra (5) |
Sidi El makhfi (7) |
| Khenifra (9) |
Aguelmous (5) |
Sidi lamine (6) |
| Sidi lamine (8) |
Timahdite (2) |
Azrou (5) |
| Sidi El makhfi (8) |
Sidi lamine (2) |
Khenifra (4) |
| Aguelmous (7) |
Sidi Amar (2) |
Sidi Amar (3) |
| Sidi Amar (5) |
Sidi El makhfi (1) |
Aguelmous (2) |
The number of degrees of a node indicates the number of incoming and outgoing motions on that node and therefore on its activity level. Here we see that for the nodes with the highest total degree are Boumia and Sidi Bettache, So these are the two localities with the strongest commercial activity (=‘hub’). Mrirt, Timahdite and Azrou are also important nodes of the network. Aguelmous and Khenifra, which have the largest markets in terms of trading volume, also appear among the top 10 despite the fact that their markets were not surveyed during the study (Table 3 and Figure 4). Some communes (5/65) are very connected (degree> 12) (Table 4) while the average of the communes is 3.47 (Table 3), which clearly allows to identify a network of “Scale free” type, suggesting a sensitive network for the spread of epidemics.
The “out degree” is the number of different localities to which the animals return. The ranking is more heterogeneous but we find Sidi Bettache, Timahdite, Boumia, Mrirt and Sidi el makhfi in the 5 most popular origins in ruminants. Note that a locality with a large number of slaughterhouses has a low outdegree. The “in degree” is the number of different localities from which a node receives the animals. We find Boumia, Mrirt, Azrou, Sidi Bettache, in addition to Khenifra and Aguelmous present in the most attractive destinations. Knots in the lamb producers zone such as the communes of Timahdite and Sidi El Makhfi have a high outgoing degree (respectively 15 and 7) and low values of degrees entering (Respectively 2 and 1), to a lesser degree the fatteners communes represented by Sidi Bettache has a little more than double of the outgoing degrees (17) compared to the incoming degrees (8). Conversely, more than a third of the network communes that are geographically distant from the lamb producers zone have positive values of the incoming degrees and zero values of the outgoing degrees.
Intermediarity or (Betweeness): This measure corresponds to the number of shortest paths between two vertices on which the studied nodes are located. She reports that 13 communes show a positive betweenness (Table 5 and Figure 5). The highest betweenness is Boumia, Sidi Bettache and Mrirt, followed by Azrou, Khenifra and Timahdite. It should be noted that Khenifra and Aguelmous, whose markets are the two most important in sheep exchange volume in the middle Atlas and whose markets could not be investigated, still show an important betweeness, ranking them among the first 7 communes surveyed. These are the most central localities because the actors must pass through this locality to reach other localities “intermediarity”. They provide a coordinating role and control (Table 5).
| Table 5. Classification of Localities by Intermediary or (betweenness) |
| Commune |
Betweeness |
| Boumia |
575, 38 |
| Sidi Bettache |
546,8 |
| Mrirt |
495,33 |
| Azrou |
329,25 |
| Khenifra |
205,81 |
| Timahdite |
92,16 |
| Aguelmous |
67,83 |
| Sidi Lamine |
61,28 |
| Itzer |
47 |
| Sidi El Makhfi |
44,96 |
| Sidi Amar |
34,5 |
| Ain Leuh |
9,16 |
| El Hajeb |
5,5 |
Subject to the sampling bias for Khenifra and Aguelmous whose markets could not be investigated, we can say that Boumia, Sidi Bettache and Mrirt are the three communes that have a very central place in the studied network, so they are crossroads that will promote the spread of diseases but which will also have the ability to control the movement of animals.
The (Components): Three “Weak Components” are identified within the network, providing information on the fragmentation of the network by the detection of isolated settlements; two are represented by the communes of Aghbalou and Had Bouhssousen, while the third is composed by the remaining communes of the network which are 63 (Table 3). Communes that are strongly connected can be grouped into subgroups. Within the network, there is a first sub-group of “strong components” made up of 13 communes which is the most important component of the network and a second subgroup composed of 5 communes (Table 3 and Figure 4).
The points of articulation or (cutpoints): These are the critical points whose if removed of the network can upset its entire structure. These points were five in the studied network. These are the communes of Boumia, Khenifra, Azrou, Mrirt and Itzer (Table 3).
Limitations of the Mobility Study
The limits of this mobility study are:
– The duration of the investigation that was “Instantaneous”. Indeed, it would be necessary to repeat these surveys at different time steps to be able to show the existing fluctuations.
– All markets could not be visited for lack of time and remoteness, namely the two largest strategic markets with the largest volume of trade in the Middle Atlas which are Aguelmous and Khenifra, nevertheless, the particularity of the mobility survey to capture the links in contact with other nodes made it possible to capture data on these 2 markets.
DISCUSSION
The role of the lamb’s producer’s zone in the supply of sheep in the different provinces of the country has been highlighted. Indeed, most of the nodes with the outgoing links but with zero inbound link are in the zone of the lamb’s producers. Conversely, most nodes with inbound but no outbound links are in other remote regions of the country that are sourcing from the Middle Atlas.
The majority of movements in the network are represented by movements from lamb’s producer’s farms to strategic markets in the Middle Atlas, which account for 58.58% of trips, while movements from the strategic markets of the middle atlas to the area of the fatteners represent 10, 63% of trips.
These two big movements are explained for the first by firstly the existence of large strategic markets in middle atlas whose exchange volume is very important (Between 80,000 head/month for the Boumia market and 416,000 for the Aguelmous market)14 allowing the concentration of sheep products of the massifs at their level before being sold to the other provinces of the country, and secondly by the fact that most of the commercial exchanges in Morocco are done at the level of the markets15 wich is in agreement with our find (58,58%), while a very small proportion is realized between farms for which Boulanouar et al15 cited 5% of all sales which would relate to the average of 5,91% found in this study, who is the average of 11.82% exchange between lamb producers and 0% exchange between lamb producers and fatteners.
While for the second movements, this is perfectly in line with the results of the ONSSA 200816 survey conducted among fatteners, which reports that the majority supply area for these breeders was the Middle Atlas markets. These two major movements are behind other more extensive distribution movements from the Middle Atlas markets and the fatteners zone that could well explain the rapid spread of PPR in Morocco in 2008 given the extent of their reach found in the mapping of sheep flows from the present study, which seems to be in agreement with the major destinations identified by ONSSA in 2012.14
Within the network only a few municipalities are very linked, maximum for Boumia, Sidi Bettache, Mrirt, Timahdit and Azrou with respectively 26, 25, 19, 17 and 14 links. In fact, these communes correspond to the town of fatteners for the case of Sidi Bettache and the communes housing the major strategic markets of the Middle Atlas for the four others, while others have about 3 links (average degree=3.4). It should be noted that although the markets of the communes of Khenifra and Aguelmous which comprise the two largest markets of the massif in terms of volume of exchange could not be investigated, they still stand out with respectively 9 and 7 links, showing the importance of these communes in the exchange circuit. Such a distribution of links with a great heterogeneity of the number of links shows the properties of the network which is of the “scale free” type. Scale free networks are extremely vulnerable to epidemics; they have been described as networks capable of spreading and persisting infections irrespective of the pathogen,17 thus showing that the virus has been able to spread quickly. An average diameter indicates that the number of generations for a disease to spread throughout the network is reduced.
The two “strong components” found confirm the very strong commercial relationship existing between the middle Atlas breeding farms and the markets of this massif on the one hand (size of 5 communes) and between the latter and the fattening farms on the other hand (size of 13 communes) which explains the concentration of the disease in these areas as noted by Diallo and Campo in 2008.2 In this connection, it can be said that the predominantly extensive breeding method of the middle atlas has favored the contact between healthy animals and sick animals and made it possible for the disease to spread in this region whereas the strong commercial relationship with the fatteners has allowed to propagate it at the level of these establishments which contribute to disseminate it in their turn.
The points of articulation or “cutpoints” are of particular interest when we seeks to identify critical positions in the networks, if we removes them, we modifies the properties of connectivity of the graph.18 In this context, these nodes can be considered as indicators of a high-risk of transmission of the pathogen. The main centers are the 5 communes of Boumia, Khenifra, Azrou, Mrirt and Itzer, corresponding to the communes hosting strategic sheep markets of the Middle Atlas for the first four in terms of centrality of the movements (degree and betweenness) but also of cohesion (clustering, cutpoints). These 5 nodes play an important role for the diffusion, because they are at the same time susceptible to infect and to transmit the infection, which shows their importance for the control of the disease.
CONCLUSION
The results of this study highlighted the role of the lamb’s producer’s zone as well as the role of the fatteners’ zone in the sheep supply of the other regions of the country. The communes concerned in the area of the breeders producing lambs host the major markets of the Middle Atlas which serve to very great distances the various other communes of the country to which they are very related, it is the same for the commune of the fatteners whose supplies in these markets before serving even more remote areas. These key crossroads represent a great risk of spreading diseases over very long distances across the country in the event of epizootics, since the structure of the network is sensitive to the spread of diseases, but they will however have also the ability to control the spread through the control of the movement of animals and their health situation at their level.
ACKNOWLEDGEMENTS
I would firstly pay tribute to our friend and mentor in the mapping and analysis of social networks, our regretted great scientist Caroline Coste who left us to the eternal rest a few days ago. I’m grateful for what she taught me.
My heartfelt thanks to Mr Bentouhami Ahmed who left us, Dr Youssef Lhor for all their precious assistance.
I am particularly grateful to Dr. Aziz Marhaben for his great assistance and his precious and continuous moral encouragement.
My thanks also to everyone supported this work I have not mentioned by name including my familly.
FUNDING
This work was funded by:
1. The World Organization for Animal Health (OIE) as part of the twinning between CIRAD and Biopharma on diagnosis, quality assurance and the epidemiology of PPR.
2. France Vétèrinaire International, in support of the Euro-Mediterranean Network for Animal Health
3. National Office of Food Safety (ONSSA)
CONFLICTS OF INTEREST
The authors declare that they have no conflicts of interest.


