INTRODUCTION
Over the years, plant materials have been sources of medicine. Ayurveda and other Indian literature mention the use of plants in treatment of various human ailments. Traditional system of medicine has been found to have many utilities in treatment of various diseases.1 The need for the use of plants to treat human disease could be attributed to the increase in human population (more people are seeking for alternative cheaper source of medication), inadequate supply of drug and high cost of treatment. Side effect coupled with drug resistance encountered with synthetic drugs also necessitated the need for alternative therapy. The affordability of herbals has also drawn the attraction towards their use. Moringa oleifera (Moringa) and Camellia sinensis (Green Tea) are two of such medicinal plants gaining popularity for their reported health benefits in recent years.1,2
MO is one of the most widely distributed species of the Moringaceae family throughout the World, especially in Asian countries, having a remarkable range of pharmacological properties in addition to significant nutritional value. MO is a highly valued plant in tropic and subtropical countries where it is mostly cultivated.3 The medicinal properties of the plant’s edible parts have been recognized by both the Ayurvedic and Unani systems of medicine in India.4
GT has been associated with lowering the risk of cancer, lowering the risk of coronary heart disease and improvement of oral health.5 It has been found to have antimicrobial health benefits and antioxidant properties.6 There are also suggestions that GT extracts offer protection against bone loss,5 body weight control, anti-hypertensive properties, solar ultraviolet protection, neuroprotective properties and anti-fibrotic properties.6 GT therefore provides a very interesting beverage with potential for a variety of medicinal uses and health promoting benefits.
During the past decade, there has been a growing interest in the medical implications of free radicals. As a result of aerobic life, organisms must deal with the continuous generation of reactive oxygen species (O2 -, H2O2, •OH) as by-products of metabolism and defend itself against the harm that these can do to cellular macromolecules.7 Free radicals produced as a result of normal biochemical reactions in the body are implicated in contributing to a number of medical conditions such as cancer, aging, diabetes, atherosclerosis, immune suppression and neurodegenerative disorders such as Alzheimer’s disease and Parkinson’s disease.8,9 Oxidative stress has been defined as a disturbance in the balance between the production of reactive oxygen species (ROS) or free radicals and antioxidant defences.10
Monosodium glutamate (MSG) popularly known as AJINOMOTO is the sodium salt of glutamic acid.11 MSG contains 78% of glutamic acid, 22% of sodium and water.12 As food additive, MSG is described and listed on food labels as a “flavouring” or “hydrolysed vegetable protein”.
Chronic administration of MSG (4 mg/kg body weight and above) as well as sub-chronic administration (0.6-1.6 mg/kg body weight) has been reported to induce oxidative stress in experimental rats.13,14
MATERIALS AND METHODS
Sample Collection and Preparation
Ripened MO leaves were obtained from Ogbete Main Market in Enugu while popular branded GT from Qualitea, Ceylon Ltd, Sri Lanka was purchased from a supermarket in Enugu. Moringa leaf was identified and authenticated by Mr. Alfred Ozioko of bioresources Conservation and Development Program (BDCP), Nsukka. The dried plant materials were powdered using an electrical blender. The extraction was done at room temperature.
A hundred grams (100 g) of dried, ground sample materials were soaked in 80% methanol (1 l) for 5 days separately. The soaked material was stirred every 18 h using a sterilized glass rod. The final extracts were passed through Whatman filter paper No. 1. The filtrates obtained were concentrated under vacuum to dryness using a rotary evaporator at 40 °C. The resulting fine powders obtained were weighed (MO=6.437 mg and GT=8.146 mg), dissolved in 300 mL of distilled water separately and stored at 4 °C until use.15
Animal Experiment
Twenty male Wistar strain rats with mean weight of 114±15 g were used for the experiment. Rats were divided into five groups containing four rats each. They were fed with standard laboratory diet and water for a period of one week for acclimatization. At the end of the acclimatization period, rats were divided into five groups as shown below
Group I (Control): maintained on only standard laboratory diet. Groups II, III, IV and V: were given water solution of monosodium glutamate (MSG) at the dose of 0.6 mg/kg body weight for 14 days. The MSG administration was discontinued after 14 days. Group II: MSG only. Group III: MSG+leaf extract of MO administered orally at the dose of 250 mg/kg body weight for 28 days. Group IV: MSG+leaf extract of GT was administered orally at the dose of 250 mg/kg body weight for 28 days. Group V: MSG+leaf extract of MO and GT was administered orally at the dose of 250 mg/kg body weight for 28 days. The dose was formulated by weight of MO and GT in a ratio 1:1.
At the end of 28 days treatment, animals were sacrificed by euthanizing them (rendering unconscious, with chloroform) and dissected. The liver, kidney and brain tissues were harvested for histology studies. These organs were fixed in 40% formaldehyde solution. The standard paraffin process method was used for tissue processing, while the haematoxylin and eosin staining method was employed.
The stained sections were evaluated and interpreted by an independent histopathologist.
Blood Sample Collection
Blood sample collection was done using the periorbital or posterior-orbital method. This requires orbital venous plexus bleeding. The animal was scruffed with thumb and the forefinger of the non-dominant hand and the skin around the eye was pulled taut. A capillary was inserted into the medial canthus of the eye (30 degree angle to the nose). Slight thumb pressure was enough to puncture the tissue and enter the plexus/sinus. Once broken, blood collection takes place. As soon as the required volume of blood was collected from plexus, the capillary tube is gently removed and wiped with sterile cotton. Bleeding was stopped by applying gentle finger pressure.
Preparation of Homogenate
A portion of liver was weighed, perfused with saline and homogenized in chilled potassium chloride (1.17%) using a homogenizer. The homogenates were centrifuged at 800 g for 5 min to separate the nuclear debris. The resulting supernatant was centrifuged at 10,500 g for 20 min to get the post mitochondrial supernatant which was used to assay catalase (CAT) activity and malonyldialdehyde (MDA) level.16
Assays
Nitric Oxide Level (in vivo): the indirect determination of NO involving the spectrophotometric measurement of its stable decomposition product nitrite (NO2 −) was used. The Griess reaction is a two-step diazotization reaction in which the NO-derived nitrosating agent, dinitrogen trioxide (N2 O3 ) generated from the acid catalyzed formation of nitrous acid from nitrite (or autoxidation of NO) reacts with sulfanilamide to produce a diazonium ion which is then coupled to N-(1-napthyl)ethylenediamine to form a chromophoric product that absorbs strongly at 540 nm. A known volume of premixed Griess reagent is added to equal volume of serum, incubated for 10 min and the absorbance of each sample determined at 540 nm. The nitrite concentration was determined by extrapolation from sodium nitrite standard graph.17
Lipid Peroxidation: The extent of lipid peroxidation in the tissue was determined by measuring the amounts of malondialdehyde (MDA) produced following the method of Ohkawa et al18 0.2 ml of liver homogenate, 0.2 ml of 8.1% sodium dodecyl sulfate (SDS), 1.5 ml of 20% acetic acid and 1.5 ml of 8% TBA were added. The volume of the mixture is made up to 4 ml with distilled water and then heated at 95 °C on a water bath for 60 min using glass balls as condenser. After incubation the tubes were cooled to room temperature and final volume was made to 5 ml in each tube. Five ml of butanol/pyridine (15:1) mixture was added and the contents were vortexed thoroughly for 2 min. After centrifugation at 3000 rpm for 10 min, the upper organic layer was taken and its optical density was measured at 532 nm against an appropriate blank without the sample. The level of lipid peroxides can be expressed as n moles of thiobarbituric acid reactive substances (TBARS)/mg protein using an extinction coefficient of 1.56X10⁵ M-1 cm−1 i.e.,
Catalase activity (CA) was assayed colorimetrically at 620 nm and expressed as unit/g tissue as described by Sinha.19 The reaction mixture (1.5 ml) contained: 0.01 M pH 7.0 phosphate buffer (1.0 ml), liver homogenate (0.1 ml) and 2 M H2 O2 (0.4 ml). The reaction was stopped by the addition of dichromate-acetic acid reagent (2.0 ml of 5% potassium dichromate and glacial acid mixed in 1:3 ratios) and the unit value was interpolated from the standard graph.
Lipid Profile Assay: Serum was drawn for lipid assessment after 12 hours overnight fast. The lipid profile was determined as follows: total cholesterol (TC) was determined by enzymatic colorimetric method.20 Triglycerides (TG), was determined by enzymatic hydrolysis with subsequent determination of the liberated glycerol by Boeringer Mannheim GPO-PAP Kit21 and highdensity lipoprotein (HDL) was determined by Friedewald et al., method.22 Low-density-lipoprotein (LDL) was obtained by calculation: LDL=TC- (VLDL+HDL); where VLDL=TG/5.22
Weight Change: The weights of the experimental rats were measured and recorded at day 0, day 14 and day 42 of the experiment with the aid of weighing balance.
RESULTS
Results from the table below (Table 1) show the in vivo nitric oxide assay between the groups and the descriptive statistics for the groups. Higher values of nitrite concentration in experimental Groups (II-V) as compared to the control (Group I) suggest that the experimental animals were oxidatively stressed after the administration of monosodium glutamate (MSG).
| Table 1. Result of Nitric Oxide Level between the Groups |
|
Group
|
Nitrite Conc. ± SD |
| I (Control) |
7.681 ± 1.372a
|
|
II
|
13.172 ± 4.146ab |
| III |
13.008 ± 1.038ab
|
|
IV
|
10.733 ± 1.202ab |
| V |
17.172 ± 8.6107b
|
Mean with the same letters are not significant at p<0.05,
Group I=Control, Group II=MSG, Group III=MSG+MO, Group IV=MSG+GT, Group V=MSG+MO+GT |
Table 2 presents the result of the lipid peroxidation assay for each group with Group II (0.362±0.115 µM) particularly demonstrating the high oxidative stressed state caused by the administration of monosodium glutamate. Significant lower value in Group V (0.065±0.022 µM) suggests that there might be synergistic antioxidant effect mixing the two plants together.
| Table 2. Effect of Moringa Leaf and Green Tea Extracts on Lipid Peroxidation |
|
Group
|
MDA ± SD (µM/) |
| I (Control) |
0.164± 0.042a
|
|
II
|
0.362 ± 0.115b |
| III |
0.199 ± 0.032a
|
|
IV
|
0.156 ± 0.027a |
| V |
0.065 ± 0.022c
|
Mean with the same letters are not significant at p<0.05,
Group I=Control, Group II=MSG, Group III=MSG+MO, Group IV=MSG+GT, Group V=MSG+MO+GT |
Table 3 shows the result of catalase activities between the groups to estimate the effect of the extracts on the antioxidant enzyme activity. Group IV treated with GT has a significant level of catalase activity (12.85±0.92×10³ unit/g tissue), followed by Group V (7.86±4.82×10³ unit/g tissue) treated with mixture of MO and GT. The least activity was shown in the untreated Group II (3.75±1.28×10³ unit/g tissue).
| Table 3. Effect of Moringa leaf and Green Tea Extracts on Catalase Activity |
|
Group
|
Catalase (unit/g tissue) × 103 |
| I (Control) |
4.15 ± 1.04a
|
|
II
|
3.75 ± 1.28a |
| III |
5.43 ± 2.03a
|
|
IV
|
12.85± 0.92b |
| V |
7.86 ± 4.82ab
|
Mean with the same letters are not significant at p<0.05,
Group I=Control, Group II=MSG, Group III=MSG+MO, Group IV=MSG+GT, Group V=MSG+MO+GT |
Table 4 present various results of lipid profile parameters of all the groups after treatment with both MSG and extracts. A significant decrease was observed in both HDL level in untreated Group II and TG level in Group V. TG was markedly increased in Group I and II. Though there was an increase in LDL level of untreated Group II, it was not significant from other groups.
| Table 4. Effect of Moringa leaf and Green Tea Extracts on Catalase Activity |
|
Group
|
TC |
HDL (mg/dL) |
TG |
VLDL |
LDL
|
|
I (Control)
|
144.9 ± 8.3a |
63.0 ± 5.7a |
89.5 ± 0.7a |
17.9 ± 2.7a |
64.0 ± 11.3a |
| II |
121.4 ± 2.8a |
32.0 ± 5.7b |
89.5 ± 10.6a |
17.9 ± 2.1a |
71.5 ± 10.6a
|
|
III
|
142.9 ± 1.27a |
69.5 ± 3.5a |
67.0 ± 9.9ab |
13.4 ± 2.0a |
60.0 ± 2.8a |
| IV |
144.8 ± 5.9a |
73 ± 1.4a
|
61.5 ± 2.1ab |
12.3 ± 0.4a |
59.5 ± 4.9a
|
|
V
|
137.4 ± 14.1a |
a 66.5 ± 2.1a |
57.0 ± 7.1b |
11.4 ± 1.4a |
59.5 ± 10.6a |
| Normal Range |
140-200 |
35-75 |
36-165 |
15-52 |
60-140
|
| Mean with the same letters in the same column are not significantly different from each other at p<0.05
Group I=Control, Group II=MSG, Group III=MSG+MO, Group IV=MSG+GT, Group V=MSG+MO+GT TC=Total Cholesterol, HDL= High Density Lipoprotein, TG= Triglyceride, VLDL= Very Low-Density Lipoprotein and LDL= Low Density Lipoprotein. |
Table 5 presents the data recorded for the various weight measured before and after treatment. The weight gain and the percentage (%) gain was also recorded. Significant weight gain was observed in Group II (50.38±4.79 g) given only MSG as compared to Control, Group I (22.85±8.15 g) and extracts treated Group III-V (36.53±11.44; 28.98±10.97; 20.12±3.01).
| Table 5. Effect of MSG, Moringa and Green Tea Extracts on Body Weight (g) |
|
Group
|
Initial Weight |
Final Weight |
Weight Gain |
% Gain |
| I (Control) |
124.78 ± 16.25a |
147.63 ± 13.98ab |
22.85 ± 8.15a |
18.31
|
|
II
|
117.78 ± 14.51a |
168.15± 14.32b |
50.38± 4.79b |
42.77 |
| III |
121.85 ± 0.98a |
158.36 ± 12.28b |
36.53 ± 11.44ab |
28.98
|
|
IV
|
102.30 ± 12.70a |
131.28 ± 10.59a |
28.98 ±10.97a |
28.33 |
| V |
104.65 ± 12.50a |
124.77± 10.13a |
20.12 ± 3.01a |
28.79
|
| Mean with the same letters in the same column are not significantly different from each other at p<0.05
Group I=Control, Group II=MSG, Group III=MSG+MO, Group IV=MSG+GT, Group V=MSG+MO+GT |
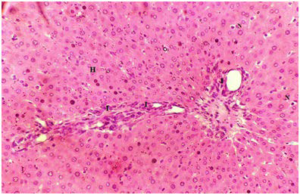
Histology Study: Liver
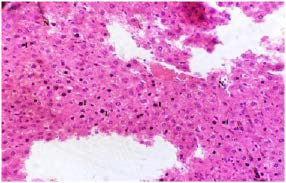
Plate 1. A Section of Liver Tissue of (Group I) Normal Rats.
Note: Normal Hepatocytes (H), Normal Central Canal (CC) and Frank RBC (F)
 Stain: H/E.. Mag: ×200
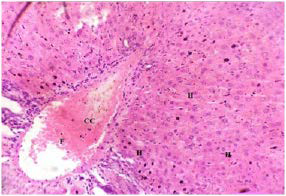
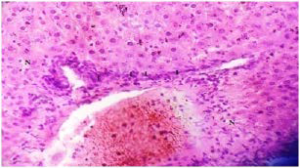
Plate 2. A Section of Untreated Liver Tissue of (Group II) Rat Following Liver Damage by MSG.
Note: The Necrotic (N) and Inflammatory (I) Cells
 Stain: H/E.. Mag: ×200
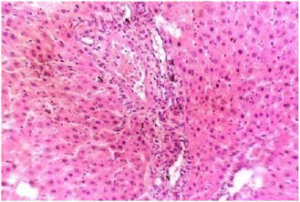
Plate 3. A Section of Liver Tissue of (Group III) Rat Treated with 250 mg/kg b.w MO Following Liver Damage by MSG.
Note: Inflammatory Cells (I), Mild Necrotic Cells (N) Showing Recovery from Damage
 Stain: H/E.. Mag: ×200
Plate 4. A Section of Liver Tissue of (Group IV) Rat Treated with 250 mg/kg b.w GT Following Liver Damage by MSG.
Note: Infiltration of Inflammatory Cells (I) at the Perivascular Area. The Hepatocytes Appeared to be Normal (H) with Mild Necrosis (N)
 Stain: H/E.. Mag: ×200
Plate 5. A Section of Liver Tissue of (Group V) Rat Treated with 250mg/kg b.w MO & GT (1:1) Following Liver Damage by MSG.
Note: Inflammatory Cells (I) at the Perivascular Area. Minimal necrotic Cells (N) Showing Recovery from Damage Due to MSG Treatment
 Stain: H/E.. Mag: ×200
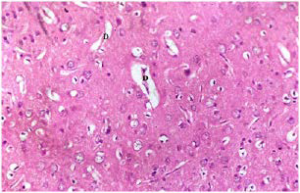
Histology Study: Brain
Plate 6. A Cross Section of Brain tissue of (Group I) Normal Rat.
Note: Normal Glial Cells(G), Normal Neurons (N)
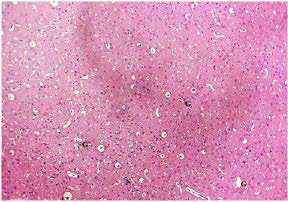 Stain: H/E.. Mag: ×200
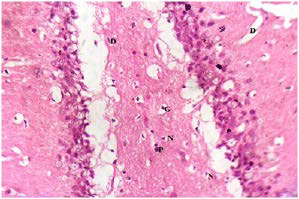
Plate 7. Brain Section of (Group II) Rat Treated with MSG. Predominant Mononuclear Cells Demonstrated (M). Necrotic Focci were Also Shown (N) with Decreased Glial Cells (G)
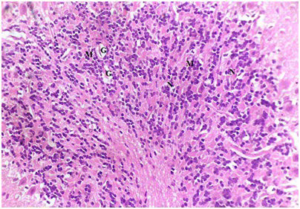 Stain: H/E.. Mag: ×200
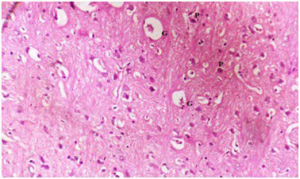
Plate 8. Section of Brain Tissue of (Group III) Rat Treated with Dose of 250 mg/kg b.w MO After Damage by MSG.
Note: Damaged Fibres of Glial Cells (G)
 Stain: H/E.. Mag: ×200
Plate 9. Section of Brain Tissue of (Group IV) Rat Treated with Dose of 250 mg/kg b.w of GT Following Brain Damage by MSG.
Note: Damaged Fibres of Glial Cells (G)
 Stain: H/E.. Mag: ×200
Plate 10. Section of Brain of (Group V) Rat Treated with Dose of 250 mg/kg b.w of Mixture of MO> (1:1) Following Brain Damage by MSG.
Note: Plaques (P) and Shrunken Glial Cells (G)
 Stain: H/E.. Mag: ×200
Histology Study: Kidney
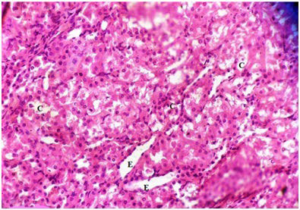
Plate 11. Section of Kidney of (Group I) Normal Rats. Note: Inflammatory Cells (I) and Normal Renal Cells (N)
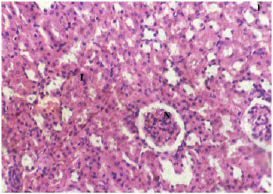 Stain: H/E.. Mag: ×200
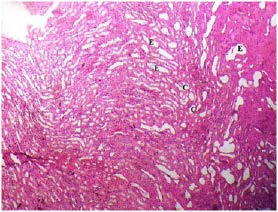
Plate 12. Medullary Section of (Group II) Rat Kidney Following Treatment with MSG.
Note: Distribution of Eroded Tubules (E) and Tubular Casts {C}
 Stain: H/E.. Mag: ×200
Plate 13. Section of (Group III) Rat Kidney Treated with 250 mg/kg b.w MO Following Damage by MSG. Numerous Tubular Casts (C), Tubular Erosion (E) are shown
 Stain: H/E.. Mag: ×200
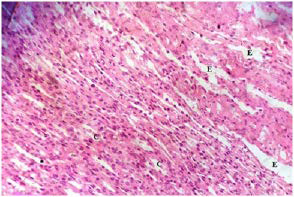
Plate 14. Section of Medulla of (Group IV) Rat Kidney Treated with 250 mg/kg b.w GT Following MSG Treatment.
Note: Tubular Casts (C) and Tubular Erosion (E)
 Stain: H/E.. Mag: ×200
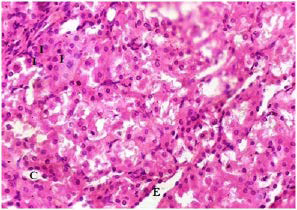
Plate 15. Section of Medulla of (Group V) Rat Kidney Treated with 250 mg/kg b.w MO> (1:1).
Note: Inflammatory Cells (I), Tubular Casts (C) and Tubular Erosion (E)
 Stain: H/E.. Mag: ×200
DISCUSSION
In the in vivo NO assay, there was a marked increase in NO level in terms of nitrite concentration (µM) in Group II-IV (13.172±4.146; 13.008±1.038 and 10.733±1.202) and a significant increase in Group V (17.172±8.6107) compared to the Control, Group I (7.681±1.372) (Figure 1). The result suggests that MSG induced oxidative stress in Group II-V.
Figure 1. Levels of NO in Treated Rats
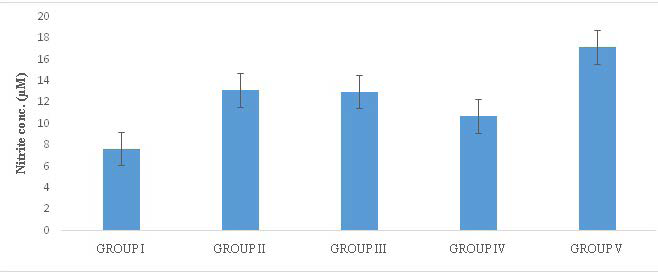
Group I=Control, Group II-V=MSG
Lipid Peroxidation Extent
Monosodium glutamate is one of the world’s most widely used food additives, it has been known to be a flavour enhancer in West African and Asian diets, and has been used to induce oxidative damage in animal model as a marked change in oxidative stress markers like lipid peroxidation and enzyme activity were observed.23,24
Lipid peroxidation is a well-established mechanism of cellular injury and therefore used as an indicator of oxidative stress which is characterised by an increase in malondialdehyde concentration (MDA). In this study, the concentration of MDA was markedly increased in the MSG-treated group which is significantly different (p<0.05) from the control group and the other groups. This is similar to the findings of Farombi and Onyema,24 and Egbuonu et al25 in which an increase in MDA concentration after MSG administration reported. The result of the Lipid Peroxidation assay therefore shows the oxidative stress effect caused by MSG administration. Moringa extracts administered to experimental rats has been reported to significantly reduce MDA levels in acetaminophen induced oxidative stress26 while green tea was also reported to reduce MDA level in stress induced oxidative damage.27 These previous reports are similar to the results in this study. The extracts of MO and GT significantly (p<0.05) lowered the MDA level (µM/) in Group III (0.199±0.032), Group IV (0.156±0.027) and Group V (0.065±0.022) compared to untreated group II (0.065±0.022). A possible synergistic effect of both extracts was observed in Group V with the lowest MDA level (Figure 2).
Figure 2. Lipid Peroxidation Levels of Treated Rats
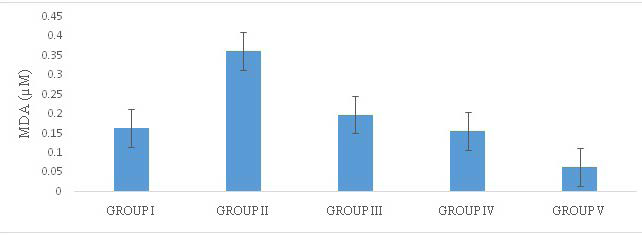
Group I=Control, Group II=MSG, Group III=MSG+MO, Group IV=MSG+GT, Group V=MSG+MO+GT
Catalase is an important cellular antioxidant enzyme that defends against oxidative stress found in the peroxisomes of most aerobic cells. It serves to protect the cell from toxic effects of high concentrations of hydrogen peroxide by catalysing its decomposition into molecular oxygen and water.28 Thus, estimation of catalase activity is a good indicator of oxidative stress in experimental animals. In this study, a reduction in catalase activity was observed in the MSG-treated group as against the control which is not significant however. This may be due to the inhibition of the activity of this enzyme as a result of the presence of high-level of reactive oxygen species and other toxic metabolites. Green tea was observed to significantly improve the catalase activity. Similar effect was observed in streptozotoc in induced oxidative stress.29 Moringa improved the activity of the enzyme though not significant. This is contrary to the report by Sharida et al26 in which the increase in catalase activity caused by moringa extract was significant (p<0.05). These suggest that the extracts have good antioxidant properties with green tea probably stimulating more production of catalase enzyme (Figure 3).
Figure 3. Catalase Activity of Experimental Rats
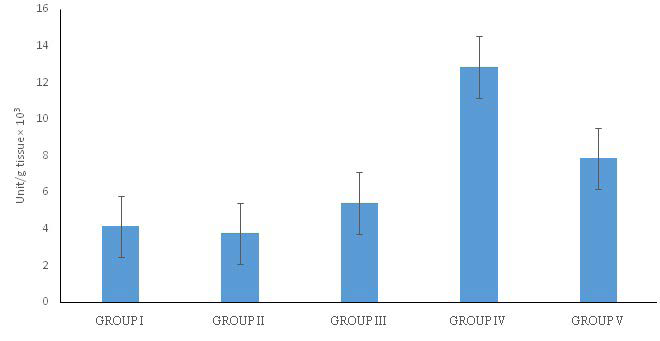
Group I=Control, Group II=MSG, Group III=MSG+MO, Group IV=MSG+GT, Group V=MSG+MO+GT
Lipid Profile Parameters
As shown in Table 4, there is no significant difference (p<0.05) in the total cholesterol (TC) of all the groups after the treatment. There was a significant (p<0.05) decrease in high density lipoprotein (HDL) of MSG-treated group (32 mg/dL) as compared to control (63 mg/dL). Triglyceride (TG) and very low-density lipoprotein (VLDL) were found to be comparable in both Control (89.5 and 17.9 mg/dL) and MSG-treated Group II (89.5 and 17.9). The low-density lipoprotein (LDL) in Control (64 mg/dL) is lower compare to 71.5 mg/dL in MSG-treated. This suggests that MSG could be a risk factor in cardiovascular disease (CVD) as it raised the level of LDL (bad cholesterol) and decreased HDL (good cholesterol).
The treatment with leaf extract of MO, GT and their mixture showed an increase in TC in treated group III-V (137.4- 142.9 mg/dL) as compared to untreated group (121.4 mg/dL). There was also increment in HDL of extract treated groups: IIIV, (66.5-73 mg/dL) compared to untreated Group II (32 mg/dL). LDL (59.5-60 mg/dL), TG (57-67 mg/dL) and VLDL (11.4-13.4 mg/dL) all showed a similar decrease pattern in extract treated Group III-V compared to untreated Group which have 71.5, 89.5 and 17.9 mg/dL for LDL, TG and VLDL respectively.
This suggest that leaf extracts have potentials to lower the risk developing of CVD as it lowered the LDL and TG/ VLDL and increased HDL.
This study confirmed GT anti-lipidermic property.30 It appears to be compare to MO and their combination because it was able to raise the HDL level highest (73 mg/dL). MO shows the least tendency in treatment of CVD though its extract has been reported to have significant cholesterol lowering action (Figure 4).31,32
Figure 4. Comparative Lipid Profile in the Groups
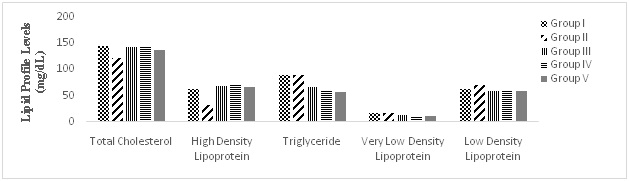
Group I=Control, Group II=MSG, Group III=MSG+MO, Group IV=MSG+GT, Group V=MSG+MO+GT
Weight Change
Several reports on potential link between monosodium glutamate and body weight have been conflicting. Several studies33,34,35 reported a significantly reduced body weights at 40 days after MSG administration in rats, while Tawfik MS et al36 and Bhattacharya S37 reported weight gain.
In this study, there was significant (p<0.05) weight gain in the untreated Group II (50.38±4.79 g) compared to the control, Group I (22.85±8.15) this marked gain in weight observed may be attributed to the monosodium glutamate administered which could induce an increase in energy intake.38 MSG has been reported to induce obesity which is characterised by a marked gain in weight.39,40
Weight gain in Group II is comparable to the moringa treated group (III=36.53±11.44 g) with the green tea extract (Group IV=28.98±10.97 g) and its combination with moringa (Group V=20.12±3.01) appears to modulate the effect of the increased weight caused by MSG. All the treatments showed promise in modulating the gain in weight though to a lesser extent by moringa extract. Green tea particularly has been reported to cause a significant decrease in body weight (Figure 5).40,41
Figure 5. Effects of the MSG Administration and Extracts on Weight Change
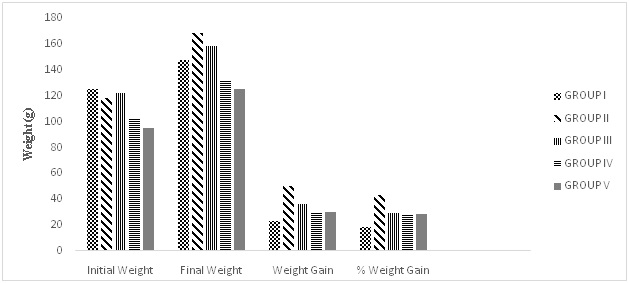
Group I=Control, Group II=MSG, Group III=MSG+MO, Group IV=MSG+GT, Group V=MSG+MO+GT
Results of the histology revealed that MSG induced damage to the liver, brain and kidney (Plates: 2-5, 7-10 and 11- 15). This MSG-induced organ damage is consistent with earlier studies reported by.24,36 In an earlier study, it was observed that infant mice, on account of poorly developed blood brain barrier, showed neurological lesion even when MSG was given in lower dose.42
From the results, tissue sections of the normal control rats (Plates 1, 6 and11) showed normal histological structures of the liver, brain and kidney. The effects observed in both the liver (Plate 2-5) and kidneys (12-15) of treated rats could have occurred because these organs are involved in the metabolism of glutamate. The result from this study showed that MSG induced marked histopathological alterations in the liver, brain and kidney tissues of MSG-treated rats. Presences of necrotic cells, eroded tubules, and inflammatory cells are all evidences of histological damage as a result of MSG administration.
The liver of the untreated oxidatively stressed group II (Plate 2) shows high presence of necrotic cells (N) and inflammatory cells (I) within the architecture of the tissue. This MSG induced liver injury corroborates earlier studies43,44 which reported MSG induced liver injury.
Histological results of the effects of MSG on the brain tissue (Plates 6-10) showed presence of brain necrosis due to consumption of MSG. The brain section of the untreated group II (Plate 4.7) shows presence of necrotic foci (N) and constricted glial cells (G). A report on histological and biochemical effects of monosodium glutamate on the frontal lobe of adult Wister rats45 corroborated this brain necrotic property of MSG, another report46 also posted similar results.
The kidney damage (Plates 12-15) was characterized with increased tubular casts (C) and eroded tubules (E). Presence of inflammatory cells (I) were also seen. Similar studies showed that MSG could cause kidney damage.11,47,48,49,50,51,52 In the present study, many renal tubules of the rat kidneys showed marked degenerative lesions under the effect of MSG. This is expected since the renal tubules are particularly sensitive to toxic assault. Renal tubules have high oxygen consumption and vulnerable enzyme systems, and have complicated transport mechanisms that may easily be damaged by such toxins. Also, the tubules come in contact with toxic chemicals during their excretion and elimination by the kidney.53
In a study on the effects of methanolic extract of MO roots on the histology of kidney and liver of guinea pigs concluded that methanolic extracts of MO roots was found to distort the histoarchitecture of both liver and kidney of guinea pigs.54 These effects seem to be time and dose dependent.
As the rats were treated with plant extracts, results showed that the damaged brain tissues were reversed and tend to normalize. The brain histology of the treated Groups III-V (plates 8-10) showed fewer damaged glial cells (G and D). The Group V treated with mixture of both extracts had the best recovery rate and indicate a better synergistic effect of both plants. This is the first reported study on the effect of MO, GT or the synergistic effect of both plants on the brain histology of MSG induced oxidative stressed rats.
It was observed that as the MSG-induced oxidative stressed groups (III-V) were treated with plant extracts; the damaged tissues architecture of both kidney and liver were restored and tends to normalise. Histology of the treated rat groups showed reduced levels of tubular casts, eroded tubules and fewer inflammatory cells. The level of necrotic cells was also reduced. When compared among the groups, it was seen that both plants cannot be easily differentiated in terms of how well the tissues were repaired. The two plants could be said to have exerted the same level of healing property. The synergistic effect of both plant extracts seems to have a better restorative result showing very fewer necrotic cells and inflammatory cells on the liver of rats treated with mixture of plants extracts. Also, the kidney of rats treated with combination of MO and GT extracts seemed to have better recovery when compared with rats treated with separate plant extract.
A study showed that MO extract accelerated recovery of hepatic cells after intoxicated with 3 g acetaminophen/ kg body weight.26 It was revealed that animals pre-treated with MO were able to prevent further damage by acetaminophen intoxication.55 A study on the therapeutic potential of MO extracts against acetaminophen-induced hepatotoxicity in rats corroborated the ability of MO to reverse histological damage caused by acetaminophen-induced hepatotoxicity.56
Studies by Gad SB et al,57 Othman M58 and El-Fattah LI59 all gave credence to the tissue repairing property of green tea as well.
CONCLUSION
This study provided a pharmacological insight for the potential use of GT, MO extracts and their combination in alleviating common medical conditions through the antioxidant properties and raises the possibility of its potential clinical usefulness. However, further studies into its pharmacotoxicity would be necessary before clinical recommendations could be made.


