INTRODUCTION
Chickpea (Cicer arietinum L.) is the world’s third largest pulse crop based on cultivated area.1 It is widely cultivated in many countries such as India, Australia, Pakistan and Turkey which are considered as the major world producers.2 A large number of grown chickpea cultivars have various physical, hydrating, cooking and parching characteristics.3 According to the color of seed and geographic distribution, chickpea is grouped into two biotypes: Desi (Indian origin) and Kabuli (Mediterranean and Middle Eastern origin) while Kabuli cultivars have large seeds with white to cream colored seed coat, Desi cultivars have small and wrinkled seeds with brown, black or green color.4
Chickpea is considered as healthy vegetarian food due to its beneficial nutritional profile and medicinal properties.5 Indeed, the chemical composition of chickpea flour shows that the seed is a good and inexpensive source of proteins, dietary fibers, carbohydrates and vitamins.6 Chickpea protein quality is superior to other legumes such as pigeon pea, black gram and green gram.7 From the medicinal standpoint, earlier studies have reported that chickpea seeds are used for the treatment of bronchitis, liver and skin diseases and inflammation of the ear.8,9 Chickpea is also considered as a hypocholesterolemic agent.10 Thus, chickpea flour has been proven to play an important role in health problems such as hypertension. Besides, as reported by Ghribi et al.11 polysaccharides from chickpea were found to have ACE inhibitory activity.
Functional properties, including solubility, water and oil holding capacity, foaming capacity and stability, emulsifying activity and gel formation are not only important in the preparation, processing and storage behaviour of food systems, but also they affect the sensory, nutritional and textural attributes of end products.12-15 Currently, the whole or partial flour from different legume sources have been added in many food formulations, resulting in increased water holding capacity and yield as well as decreased cooking losses.16
In Tunisia, chickpeas are grown primarily for their roles in human food and soil fertility improvement. Tunisia produced nearly 7,505 tons of chickpea in 2009.17 This production is subject to fluctuations depending on various factors such as essentially environmental conditions.18 Due to the local demand, Tunisia has become a net importer of chickpea. The largest part of the needed chickpea seeds is imported from Canada. The imported quantity rose from about 4,540 tons in 2002 to 60,402 tons in 2010.17
Despite the existence of published works.5,16,19 describing the chemical and nutritional composition of chickpea, information about Tunisian cultivar is lacking. Thus, the present study is investigated not only to characterize Tunisian chickpea cultivar but also to explore the technological properties for the effective application of flours in many food formulations as meat products to reduce fat content. Moreover, to the best of our knowledge, only a few studies have investigated the properties of whole legume flour. In fact, the tested legume flour was usually prepared after removing lipids and kernel skin.
MATERIALS AND METHODS
Materials
Five kilograms of seeds of each chickpea (Cicer arietinum L.) cultivar (Kabuli, Desi) were bought from the local market of Sfax, Tunisia. The seeds were cleaned by distilled water to remove dirt and then dried in room temperature (104 ºF). Next, they were stored in an opaque container at room temperature until laboratory use.
Seed Characteristics: Physical and Cooking Properties
Seed weight, volume, density, hydration capacity, hydration index, swelling capacity and swelling index were evaluated according to the method of Singh et al.20
Three random samples of 100 seeds from each cultivar per replication were weighed and the values were converted to grams per 100 seeds. The seed volume was determined by transferring 100 seeds into a 100 ml measuring cylinder with the addition of 50 ml of distilled water were added. The gain in volume was taken as the volume occupied by the seed. Concerning the seed density, it was calculated as seed weight divided by seed volume. As for the hydration capacity, it was recorded as gain in weight after overnight (12h) soaking in distilled water. Hydration index was calculated as hydration capacity divided by the original seed weight. While the swelling capacity was determined as gain in volume after overnight soaking in water, the swelling index was calculated as swelling capacity divided by the original seed volume.
For the determination of cooking time, 25 g of seed was added to 250 ml of boiled distilled water. Each 2 min, the samples were tested for their softness according to Zia-Ul-Haq et al.21 In fact, each seed was pressed between the forefinger and thumb until the disappearance of the white core. The time taken to achieve the desirable softness (disappearance of white core) was recorded as cooking time.
Flour Characteristics
Preparation: Seeds from different chickpea cultivars were ground in blender and passed through sieve (1-2 mm) to obtain flour, which was then packed and stored at 5 ºC until use.
Analytical Methods
Dry matter: Dry matter was determined by oven-drying at 105 °C to constant weight.22
Ash and mineral content: Ash content was determined by incinerating samples in the muffle furnace at 550 °C for 4h. Ashes were dissolved in HNO323 and the mineral constituents (Ca, Na, Mg, Mn, Fe, Zn and Cu) were analyzed separately using an atomic absorption spectrophotometer (Hitachi Z6100, Japan).
Total fat content: Crude fat was estimated by Soxhlet extraction with hexane after 8 hours.22
Protein content: The total nitrogen was determined by the Kjeldahl method.24 Protein was calculated using a nitrogen conversion factor of 6.25.21
Dietary fibers content: Dietary Fibers (DF) were determined according to the AOAC enzymatic-gravimetric method of Prosky et al.25 The samples were gelatinized with a heat stable a-amylase (Sigma Chemical Co., St. Louis, MO, USA) for 30 min in a boiling water bath. Then, they were enzymatically digested with protease (Sigma Chemical Co, St. Louis, MO, USA) (60 ºC, pH 7.5, 30 min) to solubilize the protein, followed by incubation with amyloglucosidase (Sigma Chemical Co, Poole, Dorset, UK) (60 °C, pH 4.5, 30 min) to remove starch. After that, samples were filtered, washed (with water, 95% ethanol and acetone), dried and weighed to determine the insoluble fiber. Four volumes of absolute ethanol were added to the filtrate and to the water washings. Then, the precipitates were filtered and washed twice with 80% ethanol and acetone, and the residues were dried and weighed. The obtained values were corrected for ash and protein. The total dietary fiber was determined by summing the insoluble dietary fiber and the soluble dietary fibers.
Carbohydrates content: Soluble sugars content was determined by the phenol-sulphuric acid method26 with ethanol extraction. Insoluble sugars fraction was submitted to a hydrochloric acid digestion for 2h at 60 °C.
pH: The pH was measured at 20 ºC using an MP 220 pH meter (Mettler-Toledo GmbH, Schwerzenbach, Switzerland).
Water activity: Water activity was measured at 25 ºC using a Novasina aw sprint TH-500 apparatus (Novasina, pfäffikon, Switzerland).
Soluble solids (Brix): The concentration of soluble solids was determined. A solution of chickpea flour (1000 mg/ml) was previously prepared for Brix determination.27
Analysis of amino acid composition: Amino acids were determined by High Performance Liquid Chromatography (HPLC) according to the OJEC standard method.28 100 mg of samples were hydrolyzed with 6 N hydrochloric acid in an ampoule containing 0.1% phenol (for the protection of tyrosine) for 24 h at 110 ºC. After acid hydrolysis, 30 ml of citrate buffer (pH 2.2) were added, and the pH was adjusted between 0.5 and 1 with a 7.5 N NaOH and pH 2.2 with a 1 N NaOH. The sample obtained was diluted to 100 ml with citrate buffer after adding 1 ml of a norleucine solution 50 µM (as an internal standard). The sample was filtered through a 0.2 µm nylon filter before being analyze by HPLC. Sulphur-containing amino acids, cysteine and methionine were determined after a pre-hydrolysis oxidation with performic acids. The contents of the different recovered amino acids were expressed g/100 g of protein. The HPLC system (Biochrom) was equipped with an UV-v is detector with two wavelengths, 440 nm and 570 nm, respectively for the proline and the other amino acids, and a cation exchange Waters C18 column (4.6 mm × 200 mm) (XBridegTM, Dublin, Ireland).
Resolution of amino acid derivatives was achieved using a four buffer gradient system. The buffers used were: (A) 0.2 M Na citrate (pH 3.2), (B) 0.2 M Na citrate (pH 4.25), (C) 1.2 M Na citrate (pH 6.45) and (D) 0.4 M NaOH. The buffer was delivered to the column at a flow-rate of 25 ml/h as shown in Table 1.
Table1: Analysis conditions of amino acids in HPLC.
|
Time (min)
|
Temperature(C)
|
Buffer
|
Ninhydrine
|
Flow (ml/h)
|
|
1
|
45
|
Tampon A
|
+
|
25
|
|
2
|
45
|
Tampon A
|
+
|
25
|
|
8
|
45
|
Tampon A
|
+
|
25
|
|
28
|
56
|
Tampon B
|
+
|
25
|
|
5
|
65
|
Tampon C
|
+
|
25
|
|
25
|
90
|
Tampon C
|
+
|
25
|
|
6
|
90
|
Tampon D
|
+
|
25
|
|
5
|
90
|
Tampon A
|
–
|
25
|
|
2
|
45
|
|
–
|
25
|
|
2
|
45
|
Tampon A
|
–
|
25
|
|
5
|
45
|
Tampon A
|
+
|
25
|
Functional Properties
Protein solubility: The protein solubility of samples was studied in the pH range of 2.0-12.0. Each sample (100 mg) was suspended in 20 ml distilled water and the pH of the suspensions was adjusted to a specific value. These suspensions were agitated in shaker for 1h at 20 ºC then centrifuged at 8000 g for 15 min. The protein content of supernatant was determined according to Bradford method29 using Bovine Serum Albumin as standard. Solubility was expressed as the percentage of the total protein of the original sample that was present in the soluble fraction.30
Water and oil holding capacities: Water Holding Capacity (WHC) was measured by the method of Sosulski.31 The sample (3.0 g) was dispersed in 25 ml of distilled water and placed in centrifuge tubes. The dispersions were stirred after the interval of 5 min, held for 30 min, followed by centrifugation for 25 min at 3000 g. The supernatant was eliminated and excess of water was removed by draining for 25 min at 50 ºC and the sample was reweighed.
To determinate Oil Holding Capacity (OHC), the method of Sosulski was used.31 The samples (0.5 g) were mixed with 6 ml of oil. The contents were stirred for 1 min to disperse the sample in the oil. After a holding period of 30 min, the tubes were centrifuged for 25 min at 3000 g. The separated oil was then removed with a pipette and the tubes were inverted for 25 min to drain the oil prior to reweighing.
The water and oil holding capacities were expressed as grams of water or oil bound per 100 gram of the sample on a dry basis.
Foaming capacity (FC) and Foaming Stability (FS): The capacity and stability of foams were determined according to the method of Lin et al.32 50 ml of 3% (w/v) dispersions of sample in distilled water were homogenized at rapid speed for 3 min. The blend was immediately transferred into a graduated cylinder. The volume was recorded before and after whipping.
FC was expressed as the volume (%) increase due to whipping
Volume increase (%) = (V2 -V1 /V1) ×100
where V1 = initial volume of solution; V2 = volume of solution after whipping.
For the determination of FS, foam volume changes in the graduated cylinder were recorded at intervals of 10, 20, 40, and 60 min of storage.
Emulsifying properties: Emulsifying Activity (EA) was determined according to the methods of Neto et al.33 5 ml of flours dispersion in distilled water (10 mg/ml) was homogenized (1 min) with 5 ml oil. The emulsions were centrifuged (1100 g, 5 min) and the height of the emulsified layer and the total contents in the tube was determined.
The emulsifying activity was calculated:
Emulsifying activity (%) = (Height of the emulsified layer/ Height of the total content) ×100
The influence of concentration (2-8% w/v) on emulsifying properties of flours was investigated.
Least Gelation Concentration (LGC) and gel texture properties: The LGC was determined by the method of Sathe et al.34 Test tubes containing suspensions of 2%, 4%, 6%, 8%, 10%, 12%, 14%, 16%, 18%, and 20% (w/v) were heated for 1 h in boiling water and cooled at 4 ºC for 2 h. LGC is the concentration above which the sample does not fall down or slip when the test tube is inverted.
The texture properties of chickpea gels were determined by (Texture Profile Analysis) TPA test. A texture analyzer (LLOYD instruments, Fareham, UK) was used to measure the force-time curve for a two-cycle compression. All measurements were carried out in a controlled room at 25 ºC. A fixed quantity of flours was placed in a plastic food container to have a constant sample thickness (40 mm). A cylindrical probe (19 mm diameter) was used to compress the sample to a 20 mm in depth with a displacement speed of 30 mm/min. Then, the probe was returned to its original position followed by second ‘‘down and up” cycle on the same sample. All operations were automatically controlled and calculated ‘‘Nexygen Lot” software connected to the texture analyzer.
Statistical Analysis
All values given were the mean of three replications and were expressed as the mean ± standard deviation (x̅ ± SD). Significant differences between the mean values (P≤0.5) were determined by using Student test.
RESULTS AND DISCUSSION
Seed Properties
The morphological characteristics and physical properties of seeds were presented in Table 2. Significant differences (p≤0.05) were observed for various physical parameters. The seed weight and volume for Kabuli and Desi chickpea cultivars ranged from 26.73 to 63.10 g/100 seeds and 20.67 to 50.66 ml/100seeds, respectively. The highest seed weight (63.10 g/100seeds) and volume (50.66 ml/100seeds) were observed for Kabuli cultivar. Kaur et al.7 reported mean of seed weight and volume of 21.94 g/100 seeds and 17 ml/100seeds, respectively for Indian chickpea cultivar (Kabuli type). The differences can either due to intrinsic factors (mainly genetics) or to extrinsic factors such as climatic factors and environmental treatments. The two cultivars have no significant difference in terms of seed density (~1.2). This result is comparable to that of earlier researchers20 who reported that seed density varies from 1.18 g/ml to 1.65 g/ml for seed cultivar grown in Punjab, Pakistan.
Table 2: Physical and cooking characteristics of chickpea seeds.
|
Parameters
|
Kabuli cultivar
|
Desi cultivar
|
|
Seed weight (g/100 seeds)
|
63.10 ± 0.58a
|
26.73 ± 0.66b
|
|
Seed volume (ml/100 seeds)
|
50.66 ± 1.15a
|
20.67 ± 1.15b
|
|
Seed density (g/ml)
|
1.24 ± 0.01a
|
1.29 ± 0.05a
|
|
Hydration capacity/seed (g/seed)
|
0.25 ± 0.01a
|
0.64 ± 0.01b
|
|
Hydration index
|
0.94 ± 0.08b
|
1.01 ± 0.02b
|
|
Swelling capacity/seed (ml/seed
|
0.29 ± 0.01a
|
0.68 ± 0.02b
|
|
Swelling index
|
1.42 ± 0.13a
|
1.34 ± 0.01a
|
|
Cooking time (min)
|
114.16 ± 5.57a
|
64.50 ± 8.3b
|
Each value is expressed as mean ± SD (n=3). Means, in the same line, with different letters are significantly different (p≤0.05)
Hydration capacity is related to the presence of soluble molecules like amylose and albumins. Although hydration capacity/seed of Desi (0.64 g/seed) and Kabuli (0.25 g/seed) cultivars varied significantly (p≤0.05), the hydration index of the two cultivars had no significant difference (p≤0.05). Desi cultivar showed the highest values of swelling capacity/seed (0.68 ml/ seed) and hydration capacity (0.64 g/seed). The higher water absorption of Desi may be attributed to its small size and the greater permeability of its seed coat. Indeed, earlier studies reported that water absorption characteristics of legume seeds is related to the seed size and coat thickness.7 Swelling capacity/seed and swelling index for different chickpea cultivars ranged between 0.29-0.68 ml/seed and 1.34-1.42 respectively. Singh et al.20 reported similar values for swelling capacity/seed (0.18-0.20 ml/ seed) and swelling index (0.23-1.48) in different chickpea cultivars. Swelling index is related to the gelatinization of starch reflecting the breaking of intra-molecular hydrogen bonds in the crystalline regions and uptake of water by hydrogen bonding; water absorption by non-starch polysaccharides and proteins. The cell structure, composition of seed and compactness of the cells in the seed play an important role in the water-absorbing capacity of seeds.35
Cooking time is a heritable characteristic that differs widely among genotypes.7 Chickpea seeds are usually cooked to soften the grain to produce a texture that is acceptable to the consumer and to improve the nutritional quality of the seed.36 In the present study, cooking time varied significantly (p≤0.05) and ranged between 64 and 114 min. The longer cooking time for Kabuli cultivar could be attributed to its larger seed weight and size, so the water takes more important time to achieve the core. The difference in cooking times among legumes could be related to the rate at which cell separation occurs due to the loosening of intercellular matrix of the middle lamella upon cooking.37 Other values reported for cooking time in the literature fall between 62.4 and 95.0 min the lowest value for Desi chickpea type and the highest for Kabuli type.6
Flour Properties
Physico-chemical characteristics
*Chemical composition: The proximate composition of the seed flours from different chickpea were presented in Table 3.
Table 3: Chemical composition (g/100g dry weight basis) of chickpea flours.
| |
Kabuli cultivar
|
Desi cultivar
|
|
Dry matter (%)
|
92.96 ± 0.15a |
92.23 ± 0.92b
|
|
Ash
|
3.14 ± 0.07a |
3.22 ± 0.06a
|
|
Crude fat
|
5.20 ± 0.87a |
6.54 ± 0.44a
|
|
Proteins
|
24.51 ± 0.27a |
20.29 ± 0.13b |
|
Crude fibers
|
21.86 ± 0.55a |
18.73 ± 0.52b
|
|
Insoluble fibers
|
12.50 ± 0.96a |
10.69 ± 0.86a
|
|
Soluble fibers
|
9.75 ± 0.15a |
8.04 ± 0.34b
|
|
Carbohydrates
|
70.17 ± 2.86a |
72.88 ± 0.63a
|
| soluble sugars |
1.97 ± 0.07a |
2.44 ± 0.01b
|
|
Polysaccarids
|
69.18 ± 1.46a |
70.38 ± 0.55a
|
Each value is expressed as mean ± SD (n=3). Means, in the same line, with different letters are significantly different (p≤0.05).
The moisture content shows significant difference between Kabuli and Desi flours. The ash and crude fat contents of cutivars ranged from 3.14%-3.22% and 5.2%-6.54% respectively. The two cultivars did not present significant differences (p≤0.05) in terms of ash and crude fat contents. The mean values for ash and crude fat contents of 2.7% and 5.9% have been reported respectively, for Canadian chickpea flours.38
The protein content of chickpea cultivars differed significantly (p≤0.05) between the two cultivars, among which Desi cultivar presents the lowest amount (20.29%). This result is in accordance with that reported by Du et al.5 (22.37%). Differences in protein contents among chickpea cultivars can be related to the genotypic diversity, varietal characteristics and region of cultivation.
The crude fibers and carbohydrates contents of chick pea varied from to 18.73-21.86% and 70.17-72.88% respectively. Desi cultivar was found to have the lowest fiber content and highest carbohydrates content. The concentration of crude fiber is related to seed coat content. The crude fibers and carbohydrates in the present study are in accordance with those for Indian chickpea cultivars.7
*Mineral composition: Table 4 presents the mineral composition of the chickpea flours which vary from one cultivar to another. Calcium was the abundant element content, ranging from 177.94 mg/100 g in Desi cultivar and 187.25 mg/100 g in Kabuli cultivar, followed by manganese, iron, sodium, zinc, magnesium and copper. Copper was found in lower quantity, ranging from 0.58 to 0.7 mg/100 g. The mean values of calcium, sodium, manganese, magnesium, iron zinc and copper content of 200, 103, 1.7, 4.55, 3.4, 3.6 and 11.5 mg/100 g, respectively, for chickpea seeds were reported.20 Significant differences were found in sodium and manganese content among the studied cultivars. Thus, the observed variation could be explained by various factors such as variety, soil type and treatment type.
Table 4: Mineral composition (mg/100g dry weight basis) of chickpea flours.
| |
Kabuli cultivar
|
Desi cultivar
|
|
Calcium
|
187.25 ± 3.32a
|
177.94 ± 3.42a
|
|
Sodium
|
11.26 ± 1.44a
|
7.35 ± 0.65b
|
|
Manganese
|
115.53 ± 2.61a
|
133.63 ± 1.85b
|
|
Magnesium
|
3.88 ± 0.08a
|
3.71 ± 0.5a
|
|
Iron
|
51.11 ± 3.74a
|
48.26 ± 2.47a
|
|
Copper
|
0.7 ± 0.03a
|
0.58 ± 0.11a
|
|
Zinc
|
4.18 ± 0.23a
|
3.32 ± 0.27a
|
Each value is expressed as mean ± SD (n=3). Means, in the same line, with different letters are significantly different (p≤0.05).
*pH, water activity and soluble solids: The pH and water activity (aw) are two parameters that encourage or prevent the growth of microorganisms in foods.39 The pH value of chickpea flours is ranges from 6.36 to 6.48. pH was near7.
Water activity, which is an indicator of water availability, was in the range of 0.38 to 0.44. These values were lower than the minimum level at which microorganisms can grow (about 0.61). Chenoll et al.27 reported that water activity for Spanish chickpea was 0.45. (Table 5)
Table 5: pH, water activity and soluble solids (Brix) of chickpea flours.
| |
Kabuli cultivar
|
Desi cultivar
|
|
pH
|
6.48 ± 0.03a
|
6.36 ± 0,03b
|
|
Water activity
|
0.38a
|
0.44b
|
|
Brix
|
3.05 ± 0.07a
|
2.1±0.14b
|
Each value is expressed as mean ± SD (n=3). Means, in the same line, with different letters are significantly different (p≤0.05).
Brix varied significantly (p≤0.05). It ranged between 2.1 and 3.05. Brix value was found higher for Kabuli cultivar (~3.05). This could be attributed not only to the sugar content but also to the soluble proteins.
*Amino acid composition: In our study, the amino acid profile of chickpea flours was determined, and the results are shown in Table 6. Chickpea flours were found to be rich in Aspatic acid, Glutamic acid, and Arginine, and the total amount of these three amino acids was 34.53 g/100 g of protein for Desi cultivar and 36.85 g/100 g of protein for Kabuli cultivar. This result is substantiated by another study20 which found that the total amount of these three amino acids was 37.8 g/100 g for Desi chickpea seeds. Glutamic acid presented the largest amount varying from 14.90 to 16.71 g/100 g of protein. Significant differences (p<0.05) in leucine, lysine and serine content were observed between the cultivars. The essential amino acids were present in chickpea seeds except Tryptophan and cysteine. The sulphurcontaining amino acid content (methionine) was 1.41, 1.14 g/100 g for Desi and Kabuli cultivars, respectively. These amino acids were the first limiting amino acids, which are also in agreement with those found in earlier research works.20> < 0.05) in leucine, lysine and serine content were observed between the cultivars. The essential amino acids were present in chickpea seeds except Tryptophan and cysteine. The sulphurcontaining amino acid content (methionine) was 1.41, 1.14 g/100 g for Desi and Kabuli cultivars, respectively. These amino acids were the first limiting amino acids, which are also in agreement with those found in earlier research works.20
Table 6: Amino acid profile of Desi and Kabuli chickpea seeds.
|
Amino acids (g/100g of proteins)
|
Cultivar
|
| |
Desi
|
Kabuli
|
|
Histidine
|
3.27±0.05a |
2.70±0.03b
|
|
leucine
|
4.24±0.04a |
2.48±0.02b
|
|
Lysine
|
7.25±0.08a |
7.63±0.06b
|
|
Methionine
|
1.41±0.03a |
1.14±0.01b
|
|
Phenylalanine
|
5.84±0.02a |
4.53±0.07b
|
|
Threonine
|
4.02±0.01a |
4.02±0.06a
|
|
Valine
|
4.69±0.08a |
3.20±0.04b
|
|
Tyrosine
|
2.87±0.02a |
6.93±0.05b
|
|
Total Essential amino acids
|
33.59 |
32.63
|
|
Arginine
|
8.90±0.05a |
8.84±0.08a
|
|
Alanine
|
4.11±0.04a |
3.52±0.02b
|
|
Aspartic acid
|
10.73±0.07a |
11 .30±0.01b
|
|
Glutamic acid
|
14.90±0.06a |
16.71±0.09b
|
|
Glycine
|
3.90±0.01a |
3.90±0.02a
|
|
Proline
|
3.63±0.02a |
2.95±0.01b
|
|
Serine
|
5.40±0.03a |
7.33±0.03b
|
|
Total Non essential amino acids
|
51.57 |
54.55
|
Each value is expressed as mean ± SD (n=3). Means, in the same line, with different letters are significantly different (p≤0.05).
Functional properties: Functional properties play an important role in physical qualities and ingredients of food during preparation, processing and storage.40
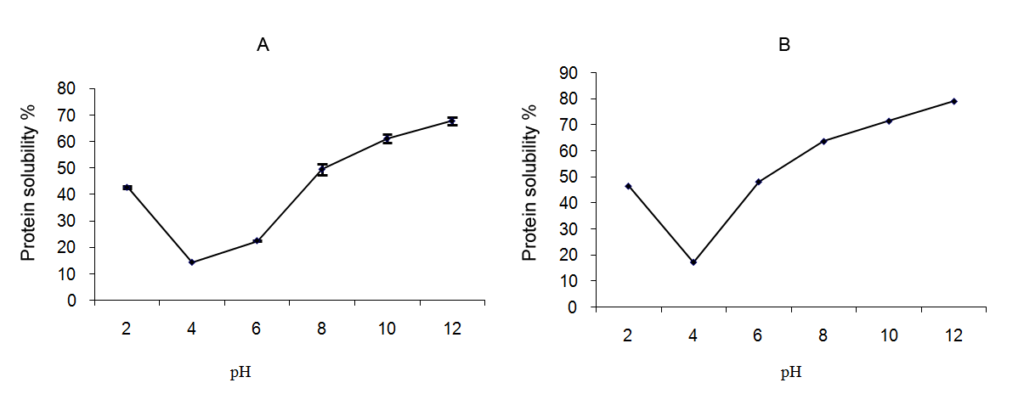
*Protein solubility: Protein solubility of the flour was investigated at pH ranging from 2 to 12 (Figures 1A and 1B) to provide information about their use in various food applications.
In general, for the two types of flour, the profile was the same. Protein solubility showed a decreasing solubility with increasing pH until it achieves minimum solubility in the isoelectric point. After this point, solubility increased progressively with the increase in pH values. Studies conducted by other researchers have also shown the same result for other common legumes such as kidney bean41 and Mucuna beans.42
The solubility was very low in the range of pH 4-5. The sample had a solubility of 14% for Kabuli cultivar and 17% for Desi cultivar. Vani and Zays43 reported that isoelectric pH of the most of the plant proteins was about 4-5. At the isoelectric point, there is no charge and no repulsive interactions protein-protein, which result in the unfolding of proteins.
In the neutral pH, proteins solubility is generally higher than 30%. The proteins of the Desi cultivar had the highest solubility in pH=7. Above this pH, protein solubility increased to achieve maximum at pH=12. At this pH, significant differences (p≤0.05) were observed. In fact, solubility was 67.88% for Kabuli proteins and 79.11% for Desi proteins. These differences could be related to the physico-chemical characteristics exhibited by these species, the nature of protein and their behavior in different values of pH.
Figure 1: Effect of pH on protein solubility. (A): Desi cultivar, (B): Kabuli cultivar. Values are means of three replications ± SD.
*Water and oil holding capacities: Water Holding Capacity (WHC) is of great importance from an industrial point of view.
WHC ranged between 73.89 and 107.96 g/ 100 g of flours (Figure 2), with the lowest value is for Kabuli cultivar. The two cultivars have significant differences (p≤0.05) in terms of water holding capacity. The varied WHC may be due to the presence of different type of hydrophilic carbohydrates and varied protein structure. These values are lower to than those reported for other flours from Indian chickpea.30 In addition, WHC of chickpea powders was poor as compared with the values observed in yellow pea seeds flours that generally swell up to 3-4 times their weight.44 The low WHC could be attributed to the presence of carbohydrates and other components that may not allow the proteins to swell, dissociate and unfold.45
Figure 2: Water Holding Capacity (WHC) and Oil Holding Capacity (OHC) of flours from different chickpea cultivars. Values are means of three replications ± SD. Identical letters above the bars indicate no significant differences by student test (p≤0.05).
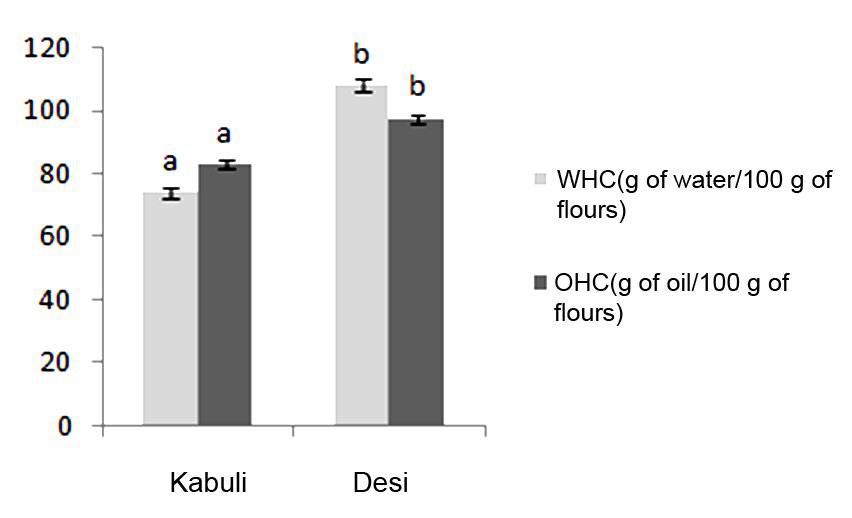
Oil Holding Capacity (OHC) is desired in meat formulations, flavor retention and improvement of palatability. OHC was in the range of 82.88 and 97.40 g/ 100 g of flours (Figure 2). A higher OHC value of 105-124 g/ 100 g has been reported for Indian chickpea in the literature.30 The difference in oil binding capacity could be related to the presence of non- polar chains, which can form hydrophobic interactions with hydrocarbon chains of lipid.41 Thanks to its higher fat absorption, Desi chickpea flours may be more appropriate to be used in foods for which fat retention is desirable.
*Foaming properties: Flours are capable of producing foams due to surface active proteins. The Foaming Capacity (FC) and Foaming Stability (FS) are used as indicator of the whipping properties of protein.46
The FC values (percentage of entrapped gaz) of flours from different chickpea were observed in the range of 36.9-41% and found to generally not significant different (Figure 3A). FC of 15-20% for Indian chickpea flours has been reported. Good foamability could be related to flexible protein molecules that can reduce surface tension.
Figure 3: Foaming properties of flours from different chickpea cultivars. (A): Foaming capacity, (B): Foaming stability:: Kabuli cultivar, : Desi cultivar. Values are means of three replications.
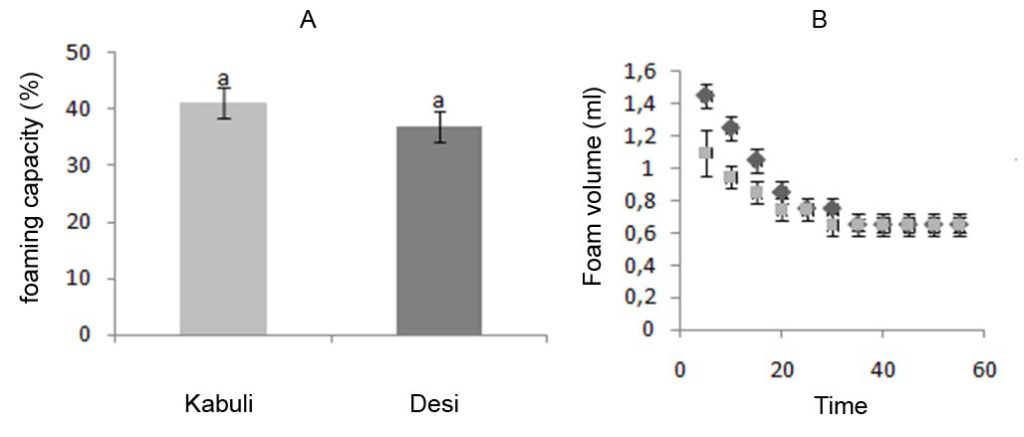
FS is important since the usefulness of whipping agents depends on their ability to maintain the whip as long as possible.38 The decrease in foam volume as a function of time was observed (Figure 3B) for the two types of flours. A similar trend has been reported for Indian chickpea.4
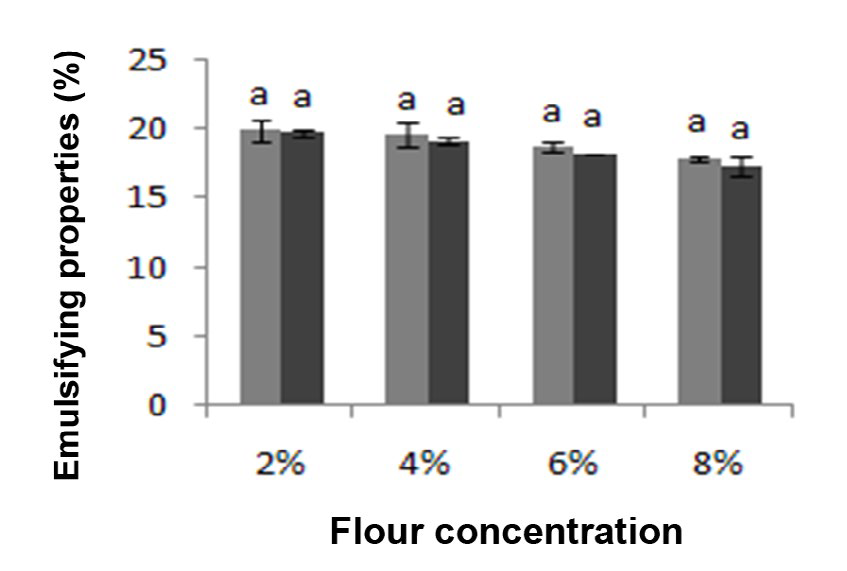
*Emulsifying properties: The decrease in Emulsifying Activity (EA) was noted with the increase in concentration of flours (Figure 4). No Significant difference (P≤0.05) was seen in EA between the two cultivars in all concentration. A similar aspect was reported for soybean and sunflower.34
At low protein concentration, the rate of adsorption is diffusion-controlled, but at a higher protein concentration, there is an activation barrier for adsorption and its rate is mainly determined by the ability of the protein molecule to create space, penetrate and rearrange on the existing film.
Figure 4: Emulsifying properties of flours from different chickpea cultivars : Kabuli cultivar, : Desi cultivar. Values are means of three replications ± SD. Identical letters above the bars indicate no significant differences by student test (p≤0.05).
*Gelation properties: The Least Gelling Concentration (LGC) is used as indicator of the gelation capacity concentration to form gels. The LGC is very important in the preparation of many foods products that require thickening and gelling. Table 7 summarizes the gelling properties. In our study, the gelation properties increased with the increase in flours concentration. Gelation was not observed until 12%. This feature may be attributed to the globular nature of protein, which is required in high concentration for gelation. A strong gel was formed at 14% for Kabuli cultivar and 16% for Desi cultivar. The study30 reported that firm and resistant gel are formed from Indian chickpea flours at 10- 14% concentrations. The variation is attributed to the differences in ratio of proteins, lipids and carbohydrates.40
Table 7: Least gelation concentration of chickpea flours after heating in boiling water for 1h followed by cooling for 2h at 4 ºC
|
Concentration
|
Kabuli cultivar |
Desi cultivar
|
|
(% w/v)
|
Gelation |
Appearance |
Gelation |
Appearance
|
|
2
|
– |
Liquid |
– |
Liquid
|
|
4
|
– |
Liquid |
– |
Liquid
|
|
6
|
– |
Liquid |
– |
Liquid |
| 8 |
– |
Liquid |
– |
Liquid
|
|
10
|
– |
Liquid |
– |
Liquid |
| 12 |
± |
Viscous |
– |
Liquid
|
|
14
|
+ |
Gel |
± |
Viscous |
|
16
|
++ |
Firm gel |
+ |
Gel |
| 18 |
+++ |
Firm gel |
++ |
Firm gel
|
| 20 |
+++ |
Very firm gel |
+++ |
Firm gel
|
The textural measurements of cooked chickpea seeds from different cultivars are presented in Table 8. In fact, hardness which is the maximum height of the force peak on the first compression cycle ranging between 0.69 and 1.68 N and was higher for Kabuli cultivar compared to Desi. This could be attributed to its highest amylose content. Chemical compounds like fiber lignin cellulose and hemicelluloses contribute to the hardness of the gel.3
Table 8: Texture parameter of chickpea flours.
|
Cultivars
|
Hardness (N) |
Cohesiveness |
Springiness (mm) |
Gumminess (N)
|
Chewiness (N mm)
|
Fracturability (N)
|
|
Kabuli
|
1.62±0.18a |
0.40±0.02a |
10.13±0.26a |
0.66±0.04a
|
6.67±0.23a
|
1.15±0.16a
|
|
Desi
|
0.69±0.1b |
0.63±0.04b |
13.74±0.08b |
0.43±0.03b
|
6.04±0.38a
|
0.51±0.06b
|
Each value is expressed as mean ± SD (n=3). Means, in the same line, with different letters are significantly different (p≤0.05).
Significant differences were observed among cultivars such as cohesiveness (ratio of the positive force areas under the first and second compressions), gumminess (product of hardness and cohesiveness) and springiness (height to which the sample recovers during the time elapse between the end of the first compression and the start of second compression). Desi cultivar had the highest cohesiveness (0.63 vs. 0.40) and springiness (13.74 mm vs. 10.13 mm) and lowest gumminess (0.43 N vs. 0.66 N). Fracturability, which is defined as the force of the significant break in the curve on the first bite, ranged between 0.51 and 1.15 N for Kabuli and Desi cultivar. These differences on textural parameters could be attributed to the chemical differences (protein and starch content).
CONCLUSION
The chemical composition of flours has shown that chickpea is an available source of proteins and fibers. Wide variations in physico-chemical, cooking and functional parameters of different chickpea cultivars were observed. In fact, Desi chickpea cultivars with low seed weight had lower cooking time and higher water absorption. Protein solubility is pH-dependent (minimum at pH) and higher at alkaline pH. Gelation and emulsifying properties are influenced by flours concentration. Considering flours contents and functional properties of chickpea seeds, we conclude that they could be useful in flavor retention, improvement of palatability and extension of many products.
This study will promote the culture of chickpea for the local consumption and fractionation of this agro-resource for the production of local food ingredients as proteins. Future work will focus on the optimization of the extraction of the protein concentrates of chickpea and the characterization of their functional properties according to the experimental conditions and to the drying methods.
CONFLICTS OF INTEREST: None.


