INTRODUCTION
India being a land rich of ethnic diversity with more than 2,000 ethnic groups draws attention of anthropologists and population geneticists while studying the pattern of human migration. India showcases extensive social, cultural, linguistic, and biological variation. About 60,000 years ago the South Asian peninsula served as an important corridor for the dispersal of human beings from Africa. During the course of migrations people of India must have undergone differential selective pressures. Such phenomena might reshape the existing population.
Over the period of evolution, high degree of polymorphism has been observed for human leukocyte antigens (HLA). The HLA play a key role in modulating immune responses. Classical HLA antigens have been studied in different Indian populations for clinical and diversity perspective. However, non-classical classI antigens have not been explored much in Indian subcontinent.
Human leukocyte antigens G (HLA-G) belongs to nonclassical HLA class I antigens. It shows low allelic variation, a restricted peptide repertoire,1 an unusually high diversity of molecular structures due to alternative splicing of the primary transcript,2 and a restricted expression under physiological conditions, which can be up-regulated in various situations. HLA-G was originally discovered on the extravillous cytotrophoblast at the maternal-fetal interface.3 It has 7 different isoforms that have been created due to alternative splicing. Four of them are membrane-bound (HLA-G1, -G2, -G3, and -G4) while other 3 are found in secreted form (HLA-G5, -G6, and -G7). The secreted isoforms lack transmembrane region. HLA-G binds to inhibitory receptors such as leukocyte immunoglobulin-like receptors B1 (LILRB1/ILT2) and LILRB2 (ILT4), which are expressed on immune cells, to suppress a broad range of immune responses. Expression of HLA-G in placenta provides immune tolerance to the fetus. There are many studies showing its association with renal transplant rejection,4 auto-immune diseases,5 diabetes6 and many other conditions including different malignancies.7
As of now, 52 HLA-G alleles/haplotypes are officially recognized by the International ImMunoGeneTics Project/human major histocompatibility complex (IMGT/HLA) database (release 3.23.0). Most of the single nucleotide polymorphisms (SNPs) in the HLA-G coding region are either coding synonymous mutations or intronic variants. Out of 52 alleles which have been officially recognized by IMGT/HLA, only 13 alleles encode 4 different HLA-G full-length molecules and are frequently observed all over the world.1,2,3,8,9
HLA-G shows less diversity but still plays an important role in immune tolerance. The relatively less polymorphism observed in the HLA-G coding region both in humans and apes may represent a strong purifying selective pressure. Studying the diversity among HLA-G may be used to evaluate the impact of expansions in human genome as it is one of the most conserved regions of the non-classical antigens. HLA-G revealed high degree of nucleotide variability in the coding region which causes conformational changes, modifies interaction with cell receptors, modulates immune response and isoform production. All these functions in turn may affect the evolutionary mechanisms. A recent study conducted on African population revealed that natural selection has shaped genetic diversity at 5´-URR.9 The present study aims to evaluate how different ethnic groups/ populations are genetically linked to each other from HLA-G allelic diversity view point. This in turn will address whether the diversity in the HLA-G alleles play any role in the human migration and selection. The study findings will serve as a reference for future studies.
MATERIAL AND METHODS
Study Subjects and Samples
Blood samples of 300 unrelated healthy individuals representing fairly homogeneous ethnic populations residing in North Indian province of Uttar Pradesh, India were randomly selected. The study population comprised of upper caste Hindus. The study was performed after the approval of the Institutional Ethical Committee (IEC) of Sanjay Gandhi Postgraduate Institute of Medical Sciences (SGPGIMS), Lucknow, UP, India. All individuals were of Indo-Aryan linguistic family and were at least third generation residents of Uttar Pradesh, India. Three generation pedigrees were drawn to ensure no population admixture. Informed consent was obtained from all the individual participants included in the study prior to collection of 5 mL blood in ethylenediaminetetraacetic acid (EDTA) by venipuncture.
The HLA-G frequency data was collected for 30 populations from the allelefrequencies.net database10 and also from published literature. However, only 12 studies were included where the alleles were determined by sequencing. The frequency data so collected represented 2, 3 and 4 allele nomenclatures of HLA-G. Alleles representing all the 3 nomenclatures were considered in-order to satisfy the Hardy Weinberg Equilibrium (HWE). The reason to include different nomenclature was that, when any 1 of the 3 HLA-G nomenclatures was considered the data was not found to be in accordance with the HWE.
DNA Extraction
Blood samples were collected and processed for deoxyribonucleic acid (DNA) isolation by QiaAmp DNA blood kit (Qiagen; West Sussex, UK).
HLA-G Sequencing
HLA-G regulatory region alleles were detected using sequencing. Sequencing reaction was performed using the ABI PRISM BigDye Terminator Cycle Sequencing Ready Reaction Kit. Purified products of sequencing reactions were run on electrophoresis on an ABI 3130 DNA Sequencer (Applied Biosystem, Foster City, CA, USA). Allele assignment was accomplished using the DNASTAR v. 11.0. The PCR followed by PAGE was used for genotyping of 14 bp insertion/deletion polymorphism of exon-8 in 3´-UTR).
Defining HLA-G Allele
Each HLA-G allele name has a unique number like classical HLA nomenclature corresponding up to 4 sets of digits separated by colons. The digits before the first colon describe the type, by serology. The next sets of digits are used to list the subtypes, numbers being assigned in the order in which DNA sequences have been determined. Alleles whose numbers differ in the 2 sets of digits must differ in one or more nucleotide substitutions that change the amino acid sequence of the encoded protein. Alleles that differ only by synonymous nucleotide substitutions within the coding sequence are distinguished by the use of the 3rd set of digits. Alleles that only differ by sequence polymorphisms in the introns, or in the 5’ or 3’ un-translated regions that flank the exons and introns, are distinguished by the use of the 4th set of digits. Alleles that have been shown not to be expressed – ‘Null’ alleles – have been given the suffix ‘N’.11 The alleles found in the present study were defined on the basis of 5’URR SNPs (-1306 G>A, -1179 G>A, -1155 G>A, -1140 A>T, -1138 A>G, -1121 C>T, -964 G>A, -762 C>T, -725 C>G/T, -716 T>G, -689 A>G, -666G>T, -633 G>A, -486 A>C, -477 G>C, -369 A>C, -201 G>A, and -56 C>T) and 14 bp I/D polymorphism (Table 1).
Table 1: HLA-G allele associated with un-translated region (UTR) haplotype of 5´-URR and 14 bp insertion-deletion polymorphism in exon-8 of 3´-UTR.
Data Analysis and Statistical Methods
Frequency of each HLA-G allele was determined by direct counting. Phylogenetic tree based on HLA-G allele frequencies was constructed by neighbor joining method12 using MEGA (version 5.2.2, www.megasoftware.net).13 The principal component analysis (PCA) of HLA-G allele frequencies were carried out using XLSTAT. Further, we have evaluated genetic diversity using SMOGD14 to observe the evolutionary relationship of the studied populations with North Indians.
RESULTS
HLA-G Allele Frequency
Eight HLA-G alleles with minor allele frequency greater than one were observed in the present study. Individual allele frequencies and sample size for each population is also mentioned in Table 2. All the 13 different populations selected, representing different ethnicities were in HWE. The populations considered for finding the global landscape of HLA-G alleles were from Brazil (Parana ethnicity),15 Sao Paulo,16 Germany,17 Ghana,18 Poland,19 South Korea,20 Spain,17 USA African American,21 Zambia,21 Iraq,22 USA Hutterite,23 and Denmark24 along with the present study. The alleles found in these populations were G*01:01:01, G*01:01:03, G*01:01:04, G*01:01:05, G*01:01:06, G*01:01:08, G*01:04:03, G*01:04:04, G*01:01, G*01:03, and G*01:04.
Table 2: Incidence of HLA-G alleles among northern Indians and global populations.
n=Number of individuals against each population.
GENETIC DISTANCE
North Indians showed the least genetic distance from all the West Eurasian (otherwise known as Caucasian) populations (Table 3). The West Eurasian populations included in this study were from Germany, Spain, Poland, and a set of heterogeneous West Eurasian population dataset from different parts of the USA. The Nei’s genetic distance revealed least genetic distance between North Indian and German (0.15) populations. Meanwhile, population belonging to Mongoloid lineage of (Korean (0.75)), and middle-east lineage (Iraq (0.65)) revealed maximum genetic distance with North Indian data.
Table 3: Genetic Distance among studied populations.
Phylogenetic Assessment of Studied Population
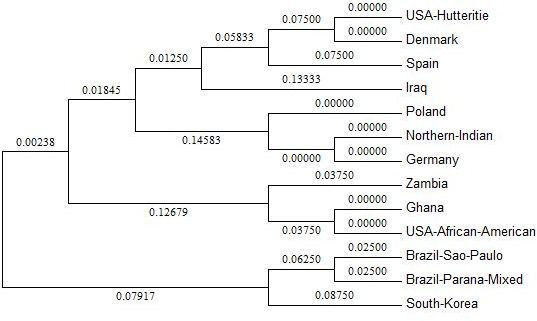
Phylogenetic analysis showed 3 major ethnicities namely West Eurasians, Africans, and South Americans under 3 clusters (Figure 1). It was evident from the figure that North Indians were in close proximity with West Eurasians (Poland, Germany, Spain, Denmark). USA Hutterite population was found to be placed on a common node with Denmark. African populations from Ghana and Zambia along with USA-African-Americans were placed in a separate cluster. Iraq representing the Middle East and South Koreans belonging to Mongoloid ethnicity was placed on single nodes in the phylogenetic tree.
Figure 1: Evolutionary relationship among thirteen populations on the basis of HLA-G allele diversity
The evolutionary history was inferred using the Neighbor Joining method. The optimal tree with the sum of branch length = 2.06396995 is shown. The tree is drawn to scale, with branch lengths in the same units as those of the evolutionary distances used to infer the phylogenetic tree. Evolutionary analyses were conducted in MEGA5.
Principal Component Analysis
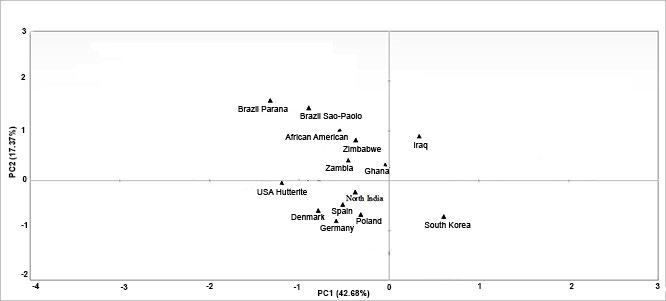
Principal component analysis (PCA) revealed that HLA-G alleles in different populations were in accordance with their geographical locations (Figure 2). Distinct geographical clusters were seen in the PC plot which includes West Eurasian (Caucasian), Asian, African and Mongoloid populations. This supported the findings of genetic distance and phylogenetic analysis. Middle Eastern population from Iraq was placed in the 1st quartile. The 2nd quartile represented populations of mainland Africa namely Ghana, Zambia, and African American along with South American populations from Brazil (Sao-Paolo, Parana). The North Indian population huddled with the West Eurasian (Spain, Poland, Germany, Denmark, USA Hutterite) placed in the 3rd quartile. Population belonging to the Mongoloid ethnicity (South Korean) fell separately in the fourth quartile.
Figure 2: Principal component analysis
Four quartiles show distribution of thirteen populations on the basis of HLA-G allele frequencies.
Genetic Diversity
Measurement of genetic diversity was calculated on the basis of HLA-G allele frequency data. Total heterozygosity (HT), absolute differentiation (DST), relative differentiation (GST), heterozygosity among subpopulation (HST), effective number of distinct subpopulations (ΔST), actual differentiation (D), and proportion of total diversity found in the average subpopulation (ΔS /ΔT), and nearly unbiased estimator of total subpopulation heterozygosity (HT_est) (Table 4) were calculated. Higher total heterozygosity (HT) values were observed for for HLA-G*01:01:02 (0.43), G*01:01:03 (0.50) and G*01:01:08 (0.47) alleles. These results suggest no change in relative differentiation (GST). The component of diversity (ΔST) between subpopulation was observed to be minimum (1.1) for G*01:01:01:03, G*01:01:01:02, G*01:01:01:04, G*01:03:01:02, and G*01:04:04. Further, the proportion of total diversity present in the total subpopulation (ΔS / ΔT) was maximum (0.9) for HLA-G alleles like G*01:01:01:02, G*01:01:01:04, G*01:03:01:02, and G*01:04:04. The actual differentiation (D) for different populations was maximum (0.53) for G*01:01:03, and G*01:04:01 alleles.
Table 4: Measurement of genetic diversity.
N=number of populations, HT=total heterozygosity, DST=absolute differentiation, GST=relative differentiation, HST=between-subpopulation heterozygosity, ΔST=between sub-population component of diversity, or the effective number of distinct subpopulations, D=actual differentiation, ΔS/ΔT=proportion of total diversity that is contained in the average subpopulation.
Multidimensional Scaling (MDS) Analysis
The primary objective of the multidimensional scaling (MDS) analysis was to obtain the best fit with the smallest number of possible dimensions. For this purpose we have used the scree plot (Figure not shown). Stress was observed at 6th dimension with the Iraq population. Subsequently major stress was observed with Brazil Parana (2nd dimension) and Brazil Sao Paolo (3rd dimension) which revealed higher genetic distances with North Indians. We observed declined stress with increased dimensionality showing genetic diversity among studied populations for the HLA-G alleles.
DISCUSSION
The HLA-G locus seen in 6 different HLA-G lineages revealed functional variations prominently in nucleotides of the regulatory regions. Differences were observed at the 5´ URR in positions that either coincide with or are close to transcription factor-binding sites23,25 which may influence the messenger RNA (mRNA) stability. It has been reported earlier that KIR2DL4 acts as a receptor for HLA-G revealing the importance of feto-maternal tolerance.26 KIR diversity has been well documented for Indian populations.27,28,29 In this context there exists a plausibility of high degree of differential selective pressure due to Killer-cell immunoglobulin-like receptor (KIR) and HLA-G interactions leading to population diversity among different populations. The present study has been conducted to correlate the genetic diversity of North Indians with twelve other populations from different continents to provide a global landscape.
Various recombination events in the HLA-G*01:01 allele have resulted into four variants namely HLA-G*01:03, *01:04, *01:05N, and *01:06.16 All these variants have also been observed among North Indians. The distribution of the HLA-G is not significantly different among populations with respect to HLA-G*01:01 group. HLA-G*01:01:01 is the predominant allele with a frequency of 60% in Europe, 50% North America, 40% in South America and Africa, 30% in Asia, and 16% among North Indians. Incidence of HLA-G*01:01:02 was high, constituting approximately 50% in European populations, 30% in North America, 20% in South America and Africa, 15% in Asia, and nearly 11% in the present study. HLA-G*01:01:08 is a rare allele in most of the populations with an exception of Brazilian populations (8% and 15%), Poland (5%).19 We have not observed this allele among North Indians. However, the HLA-G*01:04:01 allele is observed with a high frequency in Asian (Korea), North Indians, and African populations while it is low in Brazil and Caucasian population. The null allele HLA G*01:05N is detected with high frequency in Spanish (6%), African-Americans (7%), Iraqi (8%), and North Indians (8%).17,22,30 This shows concordance of our results with other genetically similar populations.
However, the frequency of the null allele among Caucasian from Europe and South America is low. In Brazil the prevalence of the null allele varies from 1% to 3%, while in Europe from 1% to 6%. In China and in some populations of USA, the null allele is rare. In Peru, Guatemala, and Japan the null allele is completely absent.21,31 These reports suggest that the null mutation might have arisen recently in the human population. Thus, it is striking that HLA-G⁄01:05N allele is maintained in a substantial frequency in certain human populations. Further studies in worldwide populations show that the highest HLAG⁄01:05 allele frequencies are found in Middle East. This may suggest that either this area was close to the ‘‘null’’ allele origin and some evolutionary pressures maintained the high frequency in the Middle East.
The population comparisons confirmed that most of the HLA-G variability has originated before human dispersion from Africa and that the allele and haplotype frequencies have probably been shaped by strong selective pressures. In addition to alignments between human and other primates coding MHC-G sequences, analysis of HLA-G non-coding regions have proved to be highly informative about the evolutionary history of this gene. Interestingly the primate family Cercopithecinae was assumed to be distantly related to human ancestors and also found to possess the MHC-G ‘‘null” allele. This suggests that the null allele may confer some advantage either at maternal/fetal tolerance or at other immune mechanisms involved in the HLA-G functions. Considering the role of HLA-G in the placenta and the selective pressures operating at this stage of development, a new allele could be easily fixed in a population.21 One previous report suggests that from Africa these might have been introduced into the Spanish population by Arab invaders and into African American population with the slave deportation.21
The genetic landscape of Indian populations is highly diverse as shown by previous studies based upon mitochondrial32 and Y chromosomal DNA.33 However, looking at the pathological relevance of HLA-G, it is evident that HLA-G plays an important role in the regulation of immune response and immune modulation in spite of low degree of genetic diversity. From evolution view point rare variants are much younger to common variants e.g., alleles found in 1 out of 1,000 individuals have an average age of 22 generations, or roughly 550 years.34 Interestingly common variants give an insight into gene flow patterns over several millennia, while rare variants aid in investigating patterns on the timescale for centuries. More studies on less polymorphic non classical HLA-G antigens will allow us to study population movements that will enhance the knowledge of human variation, genetic drift and more importantly the selective pressures due to its immense role in the immune surveillance.
AUTHOR CONTRIBUTIONS
Dr. Swayam Prakash performed the experiments, and wrote the manuscript. Dr. Maneesh Misra performed experiments. Prof. Suraksha Agrawal conceived the idea, supervised the experiments and gave critical input in preparation of the final manuscript.
ACKNOWLEDGEMENTS
The authors are grateful to the Department of Science and Technology, Government of India, New Delhi for the financial support to carry out this work.
CONFLICTS OF INTEREST
The authors declare that they have no conflicts of interest.


