INTRODUCTION
Overweight and obese individuals are at a greater risk for developing Coronary Heart Disease (CHD), Type 2 Diabetes (T2D), and certain type of cancer compared with their normalweight counterparts.1,2 Weight loss can reduce these risks, but weight maintenance after weight loss is difficult to achieve.3,4,5
Adipose tissue has been considered to be the energy storage tissue, but recent studies have shown that fat cells synthesize and secrete various bioactive substances called adipocytokines, such as leptin, adiponectin, Tumor Necrosis Factor-alpha (TNF-α), Free Fat Acids (FFAs), resistin and angiotensinogen.6
Most of the studies on adipocyte-derived cytokines have so far focused on the two adipocytokines, adiponectin and leptin, because of their role in the regulation of the metabolic homeostasis.7,8,9
Adiponectin is associated with insulin sensitivity and atherosclerosis. Despite the fact that adiponectin is secreted by the adipose tissue, plasma levels are lower in individuals with obesity, insulin resistance and T2D.10,11,12
Leptin inhibits food intake, stimulates energy expenditure, and regulating immune function.13 In humans, serum leptin levels are positively correlated with obesity, T2D, hypertension and Metabolic syndrome (MetS).14,15 Therefore, it is generally considered that obese people are associated with a state of resistance to the effects of leptin.16,17
Thus, adiponectin and leptin play an important role on obesity and metabolic disorders. Previous studies have reported an association between weight loss and adipocytokines.18 However, these studies are inconsistent and they have not clarified the relationship between weight regain and changes of adipocytokines.19,20,21 For example, Ambeba et al19 conducted a 24-month weight loss trial and reported that adiponectin increased with weight reduction and decreased with weight regain. On the other hand, Bluher et al20 reported continued increase in adiponectin levels with both weight loss and weight regain. They also reported that leptin levels decreased with weight reduction and increased with weight regain. In addition, Crujeiras et al21 reported that leptin continued to decrease throughout weight reduction and regain. Using the effective intervention program for obesity control developed by our group, a nested randomized intervention trial in human dock examinees was designed to evaluate the multiple metabolic changes and factors involved in weight reduction. Plasma levels of adiponectin, leptin and other biomarkers could be analyzed in relationship with the body weight reduction and changes in fat volume.
SUBJECTS AND METHODS
Study Subjects
This study was performed as part of the Saku Control Obesity Program (SCOP). The outline of SCOP has been described previously.22 The SCOP study protocol initially included 235 Japanese obese subjects (116 men and 119 women) recruited from the database of medical checkup record of Saku Central Hospital Human Dock Center, Nagano, Japan. The study participants had medical checkups since 2000 and were aged 40-64 years old, with a body mass index (Body Mass Index (BMI): kg/m2)) greater than 28.3 (the upper 5 percentile of all examinees). They were asked to participate in an intervention program for weight control, i.e. SCOP. Exclusion criteria were: psychiatric disease; physical conditions (i.e., morbid hepatic or renal dysfunction; cardiovascular disease such as heart failure, stroke, and transient ischemic attacks); patients who were under treatment for obesity or any treatment known to affect eating or weight. Participants were randomly assigned to either immediate (Group A) or delayed intervention (Group B, control group).
After guidance with written and oral information, including the purpose of the study, assurance of refusal, and confidentiality of personal information, written informed consent was obtained from all participants. The study protocol was approved by the Ethics Committee of the National Institute of Health and Nutrition.
Study Design
Participants were given a one-year lifestyle intervention program for weight loss, based on a cognitive-behavioral approach.23,24,25,26,27,28,29,30,31,32 The program was conducted at the Saku Central Hospital Human Dock Center from July, 2006. The participants received individual counseling (30 minutes) from a registered dietician, and group sessions about effective physical activity (20 minutes) by exercise instructors. Body composition parameters were measured at baseline and at 1, 3, 6 and 9 months. The integrative interventions have been reported in detail previously.23,24,25,26,27,28,29,30,31,32 Group A participants were followed for two years after one year intervention, without any period. Clinical and biological parameters were assessed at baseline (0 month), after the end of intervention (12 month) and during the follow-up (24 month) (Figure 1).
As controls, Group B participants received the same intervention as Group A after a delay of one year. Then they were followed up for one year. They received precise health check-up at 0 month, 12 month, 24 month and 36 month in the same way as Group A participants (Figure 1).
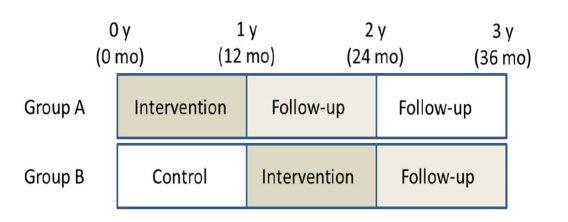
Figure 1: Study design.
The height and weight of the subjects were measured with an automatic scale (Tanita, BF-220, Tokyo, Japan). Their BMI was calculated as weight in kilograms divided by height in meters squared. Waist circumference was measured twice at the umbilicus level while the subject was in a standing position, using a fiberglass measuring tape. The average measurement was used for the analysis. Blood pressure was measured while the subject was in a sitting position using a validated automated blood pressure monitor (ES-H55; Terumo, Tokyo, Japan). Total fat areas were assessed by a computed tomography scan at the level of the umbilicus, with the subjects in the supine position. The Total Fat Area (TFA), Subcutaneous Fat Area (SFA) and Visceral Fat Area (VFA) were calculated using commercially available software (Fat Scan; N2 System Corp, Osaka, Japan). Following an overnight fast, blood samples were collected at the time of each health checkup at the Saku Human Dock Center. High-Density Lipoprotein Cholesterol (HDL-C), Low-Density Lipoprotein Cholesterol (LDL-C), Triglyceride (TG), HbA1c and other blood and biochemical values were analyzed at the clinical laboratory of the Saku Central Hospital.
Adipocytokines (adiponectin, leptin, TNF-α, FFA) were measured using laboratory testing services provided by Special Reference Laboratories (SRL) Inc. (Tokyo, Japan). The High Molecular Weight (HMW) form of adiponectin (μg/mL) was measured by Enzyme-linked immunosorbent assay (ELISA) with a detection limit of 0.18 µg/mL. Leptin (ng/mL) was measured by a radioimmunoassay (Human Leptin RIA Kit, LINCO Research, St. Charles, MO, USA) with a sensitivity of 0.5 ng/mL.
Prevalence of metabolic abnormality, hypertension, dyslipidemia and diabetes mellitus, was determined according to Japanese diagnostic criteria for metabolic syndrome. The cutoff values defining metabolic abnormalities were established at 130/85 mmHg for high blood pressure; ≥150 mg/dL triglyceride and/or <40 mg/dL HDL cholesterol for dyslipidemia; and 110 mg/dL for high blood glucose; or patients being treated for hypertension, dyslipidemia, and/or diabetes .
Data Analysis
Statistical analysis was focused on the effect of intervention by Randomised Controlled Trial (RCT) design so that we compared Group A as intervention group and Group B as control group. Furthermore, we analyzed degree of rebound after intervention by combined group A and B data (Group A+B). Data are presented as mean±SD. Adipocytokines and C-reactive protein (CRP) were log-transformed to fit normality or linearity assumption for statistical analysis. The serum level of adipocytokines and CRP are presented the median and range (25 percentile and 75 percentile). Independent sample t-test was used to compare intervention group and control group in baseline and 1 year later. Spearman correlations were used to test the associations between body composition and blood data. In Group A+B, paired t-test was used to compare end point of intervention and follow-up. Weight reduction was calculated as the difference between before and after the intervention. Weight regain was calculated as the difference during follow-up period. Weight reduction and regain values are separated quartile groups, respectively. The significance of differences among that quartile were analyzed with one-way Analysis of variance (ANOVA) followed by Bonferroni and Games-Howell post hoc test. Statistical analysis was performed by Statistical Package for the Social Sciences (SPSS) version 20.0 software (SPSS Inc., Chicago, IL, USA).
Results
Effect of the Intervention by RCT Baseline characteristics for men and women are displayed in Table 1. The mean age of the study population was 53.8 years for men and 54.7 years for women. BMI was 30.2±3.1 kg/m2 for men and 31.0±3.0 kg/m2 for women, the waist circumference was 100.0±6.5 cm and 103.2±8.1 cm, and the visceral fat area was 157±48 cm2 and 129±47 cm2 (mean±SD) (Table 1).
|
n
|
unit |
116 |
119
|
|
Age
|
years |
53.8±6.5 |
54.7±6.4
|
|
Height
|
cm |
168.4±6 |
155.1±5.7 |
| Weight |
Kg |
85.7±10.4 |
74.8±9.4
|
|
BMI
|
kg/m2 |
30.2±3.1 |
31.0±3.0 |
| Waist circumference |
cm |
100.0±6.5 |
103.2±8.1
|
|
Body fat
|
% |
28.8±4.1 |
40.7±5.4 |
| Total fat area |
cm2 |
404±111 |
468±111
|
|
Sq fat area
|
cm2 |
247±91 |
339±90 |
| Vis fat area |
cm2 |
157±48 |
129±47
|
|
Total cholesterol
|
mg/dl |
204±29 |
217±39 |
| HDL-cholesterole |
mg/dl |
50±10 |
56±12
|
|
LDL-cholesterole
|
mg/dl |
121±28 |
131±33 |
| Triglyceride |
mg/dl |
171±120 |
151±81
|
|
FFA
|
mEq/L |
0.5±0.2 |
0.6±0.2 |
| TNF-α |
pg/ml |
1.1(0.9-1.4) |
1.2(0.9-1.4)
|
|
Leptin
|
ng/mL |
6.7(4.9-9.2) |
18.0(13.6-25.3) |
| Adiponectin |
µg/mL |
2.2(1.6-3.6) |
4.8(3.5-7.4)
|
|
CRP
|
mg/dl |
0.12(0.07-0.18) |
0.11(0.07-0.24) |
| SBP |
mmHg |
133±15 |
136±18
|
|
DBP
|
mmHg |
82±13 |
83±12 |
| Fasting glucose |
mg/dl |
111±26 |
114±27
|
|
HBA1C
|
% |
5.8±1.1 |
5.9±1.2
|
Mean±SD. Adipocytokines and CRP showed median and range (25 percentile and 75 percentile).
Table 1: Baseline data of the participants
After one year of intervention we observed a 5% body weight reduction (6.1 kg in men and 4.0 kg in women in average) in 51% participants, 10% reduction in about one fourth participants. The changes of body weight, BMI, fat% in body composition, waist circumference, fat area by CT, and selected biochemical data by group are shown in Table 2. After the intervention, body weight, BMI, body fat and abdominal fat areas were significantly less than those of controls.
|
A: Intervention group
|
|
B: Control group
|
|
|
|
|
M(n=56)
|
F(n=52) |
M(n=49) |
|
F(n=52)
|
|
|
Age
|
53.7±6.7 |
55.0±6.6 |
53.9±6.3 |
|
54.5±6.2 |
|
| Height |
167.9±5.9 |
155.1±5.7 |
168.9±6.0 |
|
155.2±5.7
|
|
|
Body wt 0y
|
84.2±8.5 |
74.5±8.4 |
87.3±12.1 |
|
75.2±10.3 |
|
| Body wt 1y |
79.3±8.7 |
70.7±9.3 |
87.5±13 |
** |
75±11 |
*
|
|
Body wt difference 0_1y
|
5.0±5.1 |
3.8±3.7 |
-0.2±2.8 |
** |
0.2±2.5 |
** |
| BMI 0y |
29.8±2.3 |
31.0±2.9 |
30.6±3.8 |
|
31.1±3.0 |
|
|
BMI 1y
|
28.1±2.5 |
29.4±3.4 |
30.5±4.2 |
** |
31.0±3.2 |
* |
| BMI difference 0_1y |
1.7±1.8 |
1.6±1.5 |
0±1.0 |
** |
0.1±1.0 |
**
|
|
Body fat 0y
|
28.5±3.6 |
39.7±5.2 |
29.2±4.6 |
|
41.8±5.4 |
* |
| Body fat 1y |
26.8±4.4 |
37.8±5.9 |
29.6±5.1 |
** |
41.8±5.8 |
**
|
|
total fat 0y
|
393±82 |
467±98 |
417±137 |
|
468±123 |
|
| sq fat 0y |
243±66 |
343±80 |
253±114 |
|
335±100 |
|
|
abd fat 0y
|
150±48 |
125±47 |
164±48 |
|
133±47 |
|
| total fat 1y |
333±81 |
402±93 |
397±104 |
** |
455±108 |
**
|
|
sq fat 1y
|
207±62 |
302±76 |
238±96 |
* |
326±88 |
|
| abd fat 1y |
126±46 |
100±38 |
159±48 |
** |
130±45 |
**
|
|
total fat difference 0_1y
|
60±64 |
65±57 |
19.7±57.9 |
** |
13.2±44.0 |
** |
| sq fat difference 0_1y |
36±38 |
41±44 |
14.3±32.6 |
** |
9.7±30.7 |
**
|
|
abd fat difference 0_1y
|
24±33 |
24±26 |
5.4±33.3 |
** |
3.5±22.4 |
**
|
Significantly different between intervention and control groups.
:P<0.05,**:P<0.01
Sq: subcutaneous, abd: abdominal.
Table 2: Baseline and post intervention data of the participants by the arm.
Adipocytokines, lipid, glucose and HbA1c levels of intervention and control groups are shown in Table 3. Leptin was significantly lowered than control in both men and women after the intervention. Systolic Blood Pressure (SBP) and Diastolic Blood Pressure (DBP) improved after the intervention. Only in women, TNF-α was significantly increased by intervention (Table 3).
|
A: Intervention group
|
B: Control group
|
|
|
|
|
M(n=56)
|
F(n=52) |
M(n=49) |
F(n=52)
|
|
Triacylglycerol 0y
|
170±98 |
131±61 |
173±141 |
|
172±94 |
** |
| Triacylglycerol 1y |
143±74 |
118±58 |
159±72 |
|
164±87 |
**
|
|
LDL cholesterol 0y
|
123±29 |
128±32 |
119±28 |
|
134±35 |
|
| LDL cholesterol 1y |
124±31 |
129±26 |
123±29 |
|
130±30 |
|
|
HDL cholesterol 0y
|
48±11 |
56±12 |
52±9 |
|
56±12 |
|
| HDL cholesterol 1y |
50.3±12.7 |
57.2±13 |
48.7±8.8 |
|
53.5±12 |
|
|
FFA 0y
|
0.53±0.17 |
0.60±0.20 |
0.48±0.20 |
|
0.55±0.22 |
|
| FFA 1y |
0.43±0.17 |
0.50±0.18 |
0.40±0.17 |
|
0.50±0.17 |
|
|
TNFα0y
|
1.1(0.9-1.5) |
1.2(0.9-1.4) |
1.2(1.0-1.4) |
|
1.2(0.8-1.4) |
|
| TNFα1y |
1.3(1.1-1.5) |
1.4(1.1-1.7) |
1.3(1.1-1.5) |
|
1.1(1.0-1.4) |
**
|
|
Leptin 0y
|
6.7(4.2-9.1) |
17.7(13.2-23.5) |
6.9(5.2-9.4) |
|
18.9(13.9-25.7) |
|
| Leptin 1y |
5.7(3.8-8.8) |
15.7(10.7-20.7) |
8.3(5.7-11.4) |
** |
22.3(16.2-29.3) |
**
|
|
Adiponectin 0y
|
2.2(1.5-3.6) |
5.1(4.1-8.4) |
2.3(1.7-3.7) |
|
4.3(2.5-5.6) |
** |
| Adiponectin 1y |
3.2(2.1-5.9) |
6.8(5.1-10.2) |
2.7(2.0-4.5) |
|
5.5(3.8-8.6) |
*
|
|
CRP 0y
|
0.11(0.08-0.18) |
0.10(0.06-0.21) |
0.10(0.06-0.21) |
|
0.13(0.08-0.26) |
|
| CRP 1y |
0.07(0.05-0.14) |
0.08(0.04-0.13) |
0.08(0.04-0.13) |
|
0.14(0.07-0.24) |
|
|
SBP 0y
|
132±15 |
133±16 |
134±15 |
|
139±19 |
|
| SBP 1y |
126±14 |
127±17 |
134±18 |
* |
135±18 |
*
|
|
DBP 0y
|
81±14 |
81±11 |
83±12 |
|
84±12 |
|
| DBP 1y |
79±11 |
78±12 |
85±13 |
* |
85±12 |
*
|
|
Fasting blood glucose 0y
|
111±28 |
112±30 |
112±23 |
|
115±25 |
|
| Fasting blood glucose 1y |
109±24 |
110±36 |
116±20 |
|
112±19 |
|
|
HbA1c 0y
|
5.7±1.1 |
5.9±1.2 |
6.0±1.1 |
|
6.0±1.2 |
|
| HbA1c 1y |
5.5±0.8 |
5.6±1.0 |
5.8±0.8 |
* |
5.7±0.8
|
|
Significantly different between intervention and control groups.
:P<0.05,**:P<0.01
FFA: Free Fatty Acid, SBP: Systolic Blood Pressure, DBP: Diastolic Blood Pressure.
Table 3: Changes of adipocytokine, serum lipids and some biochemial data by arm.
At baseline health examination revealed the prevalence of dyslipidemia was 64.3% and 40.4% in men and women, high blood pressure was 69.6% and 67.3%, and high blood glucose was 35.7% and
38.5%. The prevalence were improved 19% in both sex in dyslipidemia, 21% and 11% in men and women in high blood pressure, 5% and 30% in high blood glucose, respectively.
Effect of Intervention with Group A+B
Effect of intervention in fat tissues and adipocytokines: BMI and fat area usually showed good correlations in both males and females (Table 4). TG correlated with visceral fat and Free Fatty Acid (FFA). After the intervention TG showed strong positively correlation with leptin and negatively correlation with adiponectin than before the intervention, except for adiponectin in women. Adiponectin and leptin inversely correlated only in men. Leptin was widely interrelated among BMI and various fat areas, but not with TG, FFA and HbA1c in women before the intervention and FFA and HbA1c after the intervention. In men leptin and TG was significantly correlated. TNF-α correlated with visceral fat, TG, FFA, leptin, and HbA1c in women before the intervention, but after the intervention only TG and HbA1c remained. In men TNF-α did not show any association with the above variables.
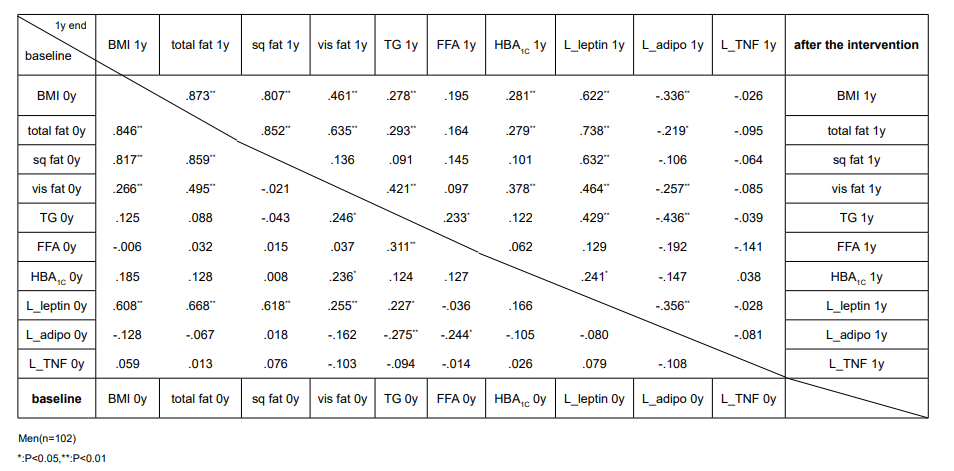
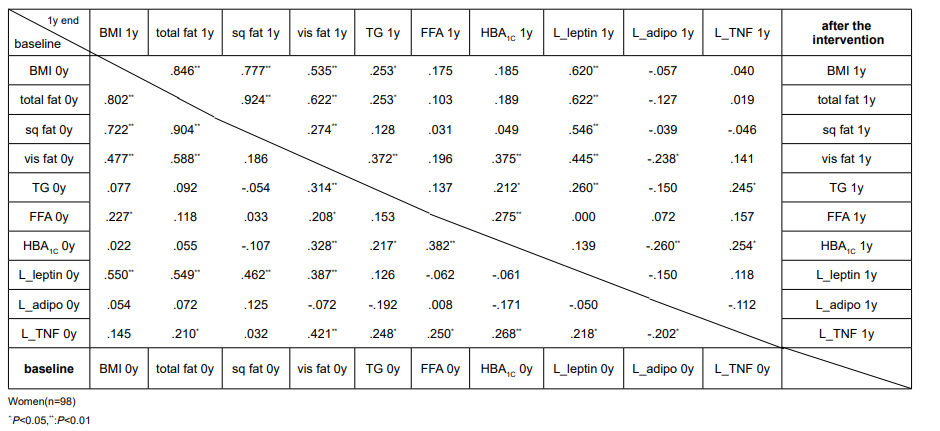
Table 4: Correlation analysis between fat and adipocytokines.
The change of weight, adiponectin and leptin between before and after the intervention is shown by the quartile of body weight reduction (Figure 2). Leptin decrease and increase of adiponectin was noticed in upper quartile of body weight reduction by intervention both men and women.
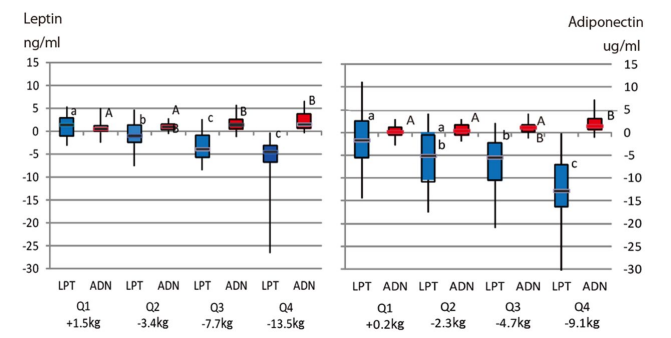
The distinct of character shows statistically significant difference (p<0.05; A-B and a-b;, p<0.01 a-c).
Figure 2: Leptin (blue) and adiponectin (red) concentration after intervention by quartile of body weight loss.
Weight regain during follow-up period: Weight, BMI, waist circumference, HBA1c, TFA and VFA were significantly increased at the end of follow-up in Group A+B analysis. Both men and women gained about 1.5 kg body weight gain on average. However, these the end of follow-up values remained significantly lower than those before the intervention (Table 5).
Leptin value at the end of follow-up showed significantly lower than the end of intervention for men and women. Adiponectin and TNF-α was significantly decreased at the end of follow-up than at the end of intervention both men and women (Table 5).
The change of weight and adipocytokine levels for weight regain groups between follow-up periods is shown by the quartile of body weight regain (Figure 3). Leptin was significantly higher in upper quartile of weight regain.
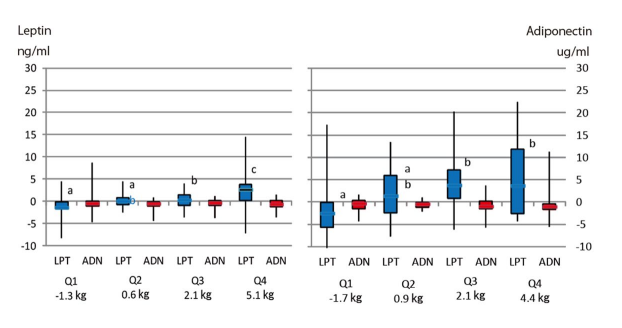
The distinct of character shows statistically significant difference (p<0.05; A-B and a-b;, p<0.01 a-c).
Figure 3: Difference of leptin (blue) and adiponectin (red) concentration during follow-up period by quartile of body weight gain.
DISCUSSION
In this study, we achieved a 5 percent body weight loss through a one-year lifestyle intervention program using a behavioral approach. In parallel with the weight reduction, many metabolic syndrome-related factors significantly improved. During the intervention, energy source, crops and diary decreased, while the intake of green yellow vegetables increased.27 Eating speed improved and physical activity also increased compared to the control group.32 Especially in Group A, women increased their daily physical activity and improved their irregular eating habits during the follow-up period. Eating motivation could be changed through the cognitive-behavior approach.
Following encouragements from trainers, physical activity seemed to be more frequent during the intervention period. This did not last during the follow-up period, while dietary habits seemed to be maintained even after intervention. Altered dietary habit could contribute to the later life. As body weight significantly increased at the end of follow-up examination compared to the weight at the end of the intervention program, fixation of good health habit would be very difficult without decision of individuals.
Decrease and increase of fatty tissue should be a basis of body weight change. Adipose tissue is a major source of energy for the human body. It is also a source of major adipocytokines, adiponectin and leptin.6 In this study, leptin changed markedly in the process of weight reduction and regain.
Adiponectin decreased according to the weight reduction, but not changed between weights regain quartile. Leptin seemed to be highly sensitive to weight changes than adiponectin.
A few studies have explored the relationship between weight change and changes of adipocytokines, but results are inconsistent.
Leptin inhibits food intake, stimulates energy expenditure, and regulating immune function.13 In humans, serum leptin levels are positively correlated with obesity, T2D, hypertension and Metabolic syndrome (MetS).14,15 Leptin levels increase in obesity and subcutaneous fat has been a major determinant of circulating leptin levels. The net action of leptin is to inhibit appetite, stimulate thermogenesis, enhance fatty acid oxidation, decrease glucose, and reduce body weight and fat. Our results suggest that leptin change associated with weight reduction and regain, and other effects on metabolic markers.
Weight loss significantly elevates plasma adiponectin levels. We measured HMW-adiponectin in this study. Adiponectin is present in serum as a trimer, hexamer, or high molecular weight form. HMW adiponectin is closely related to coronary artery disease and weight reduction, it affects insulin-sensitizing.33,34 Moreover, HMW-adiponectin contributes to the activation of AMP-activated protein kinase (AMPK), to the suppression of endothelial cell apoptosis, and to cytostatic activity.35,36 We propose that early reports describing variable effects of adiponectin should be interpreted with caution, as HMW adiponectin is a more reliable assay reflecting the active form of adiponectin. A reduction in adiponectin has previously been associated with insulin resistance, dyslipidemia, and atherosclerosis in humans.
TNF-α significantly increased by intervention in women even though body weight and fat area decreased. At the end of follow-up, TNF-α significantly decreased than at the end of intervention both in men and women even though body weight and fat area increased. TNF-α is secreted from not only fat cells but also macrophages. Thus, the changes of TNF-α may be influenced by other factors independently from body weight, obesity or fat cell. It may need further study in the future.
Ambeba et al19 conducted the 24 month weight loss trial. They reported that adiponectin increased with weight reduction and decreased with weight regain. These results are similar to our observations. On the other hand, Bluher et al20 reported an increase in adiponectin with weight loss. However, there was a continued increase in adiponectin levels with weight regain. There are several differences between Bluher’s and our study. First, we conducted separate statistical analysis between sexes, while they analyzed aggregate data. Furthermore, most of the participants were men (86%). Bluher et al20 conducted a 2-year intervention for weight loss, using calorie or carbohydrate diet restrictions.
Our study has several limitations. We could set control group in intervention phase by cross-over design, as Group B participants waited their intervention for one year as a control group of A. However, follow-up period of Group A could not be combined to control group of intervention, because they trailed the effect of intervention. It was impossible to set monthly or yearly wash out period, so this problem should be elaborated in the future epidemiological design of human study. So, there was no control group in follow-up phase. Secondly, the relationship between dietary and physical activity was not sufficiently connected to the adipocytokine changes. Individual health conditions, different absorption capacities, and different intestinal microbiota could affect the metabolism of individuals and their predisposition to obesity or leanness.37 Further studies are necessary to better integrate individual holistic variables.
In conclusion, our results suggest that leptin should have broad effects among fat tissues and lipid metabolism. Leptin inversely associated with adiponectin, which in turn was necessary to decrease body weight. In particular, leptin decreased remarkably in the process of weight reduction, and its increase seemed to be related in weight regain. Increase of adiponectin seemed to be induced by the reduction of fat volume.
ACKNOWLEDGMENTS
The authors appreciate the participants for their enthusiastic cooperation. We express special thanks to the staffs of Saku Control Obesity Program (SCOP) for their excellent support of the study. Dr. Masahiro Morioka, and other members of Saku Human Doc Center contributed to our study in various aspects. This study was supported by Grant-in-aid for Scientific Research from the Japan Ministry of Health, Labour and Welfare (MHLW).
CONFLICTS OF INTEREST
The authors declare that they has no conflicts of interest.


