INTRODUCTION
Lower extremity injury and the associated rehabilitation that follows represent an enormous source of annual health care costs as well as time lost from activity in the physically active population.1,2 Currently, assessment tools such as the Landing Error Scoring System (LESS) have been described in the literature and adopted by clinicians as valuable tools used to assess knee injury risk.3 Unfortunately, while these tools have been shown to be valid, they rely on subjective criteria to assess patient performance, which may be affected by clinician experience. Cost effective, quantifiable assessment of lower extremity movement in the clinical setting represents a tremendous improvement in the standard of injury risk evaluation as well as the ability to track patient outcomes.
In the laboratory setting, camera-based three dimensional motion analysis, which are considered the gold standard for dynamic movement assessment, are commonly utilized to assess lower extremity and trunk kinematics associated with lower extremity injury. Cost effective and clinician friendly motion analysis technology that allow for valid and sensitive real time assessment of lower extremity movement patterns are an essential next step toward optimized patient care. Providing clinicians access to a low cost, user friendly motion analysis system that can be easily integrated in to clinical practice may provide a valuable objective tool to assess knee joint injury risk as well track patient progress and outcomes throughout the rehabilitation process. The Microsoft Kinect® camera system (Microsoft Corp. Redmond, WA) is a widely available and cost effective video game system accessory that utilizes multiple cameras to measure 3 dimensional joint kinematics.4,5
METHODS
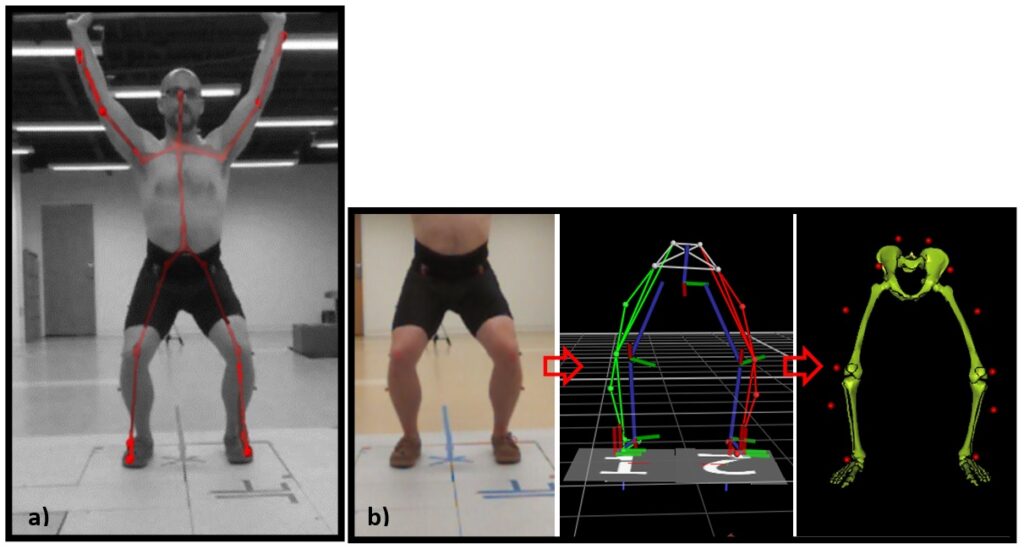
We conducted a descriptive laboratory study to use the Microsoft Kinect® camera system to assess lower extremity biomechanics indicative of injury risk in Men’s and Women’s Division I basketball athletes (Table 1). The Microsoft Kinect® camera setup is shown in Figure 1.
Table 1: Participant demographics
|
Mean±SD
|
p-value
|
|
Male
|
Female
|
| Age |
19.4±1.6
|
19.3±1.6
|
0.88
|
| Height (cm) |
195.5±10.2
|
177.1±7.6
|
<0.001
|
| Weight (Kg) |
93.4±13.4
|
71.5±7.6
|
<0.001
|
| BMI |
24.3±1.9
|
22.8±1.4
|
0.03
|
Figure 1. a) Kinect automatic body segments and joints recognition, b) lower extremity biomechanical model developed to calculate the joints’ kinematics using the BTS system.
Subjects were 18-24 years old, and they participates in NCAA Division I Basketball. Subjects were excluded if he/she has any lower extremity surgery in the past 6 months. Data collected was in the form of Means and SD calculated for each group, and the groups were compared using independent sample t-tests, Alpha level: P≤0.05.
Each participant performed three sessions of Single Leg Hop Performance, Dynamic Balance Assessment using Star Excursion Balance Test,6 and Lower Extremity Jump Landing Biomechanics (Participants completed a drop-jump landing task from a 30 cm-high box with a landing target placed on the floor at a distance equal to 50% of his height). All data was processed using an in-house custom LabVIEW program (National Instruments Corp, Austin, TX).
RESULTS AND DISCUSSION
Results obtained from the study is shown in Figures 2-4 below. On the other hand, Table 2 summarizes the hip and knee kinematics during jump landing.
Figure 2. Between sex comparison of non-normalized single leg hop distances.
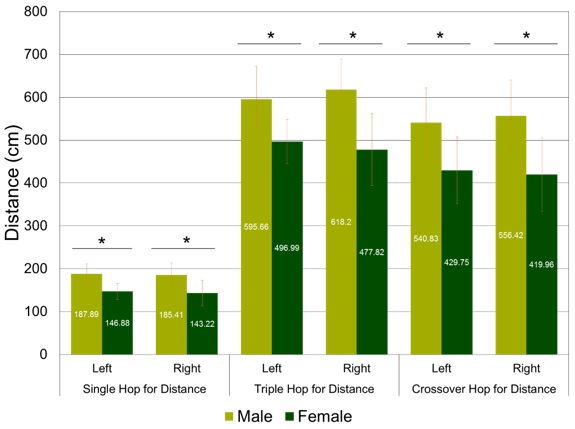
Significant difference indicates with *
Figure 3. Between sex comparison of normalized single leg hop distances.
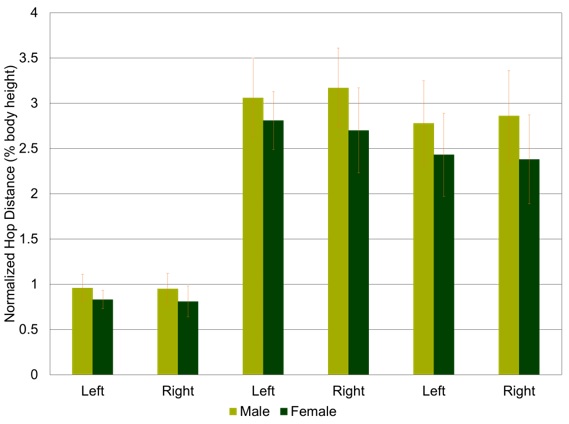
Significant difference indicates with *.
Figure 4. Star excursion balance test results
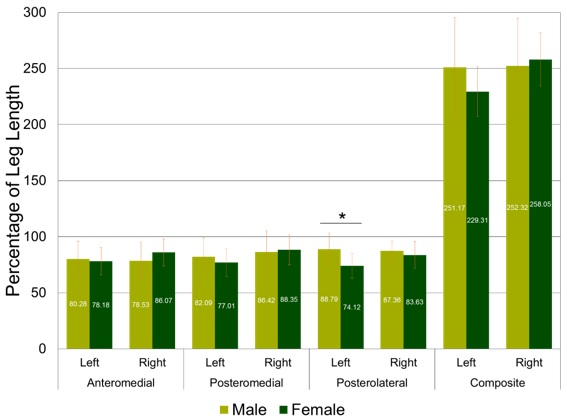
Significant difference indicates with *.
Table 2. Hip and Knee Kinematics during a jump landing task
|
|
Mean±SD
|
p-value
|
|
Male
|
Female
|
| AKnee Flexion (°) |
Left
|
71.7±12.4
|
76.4±16.0
|
0.60
|
|
Right
|
73.2±15.3
|
71.6±15.8
|
0.85
|
| AKnee Valgus (°) |
Left
|
6.2±4.2
|
2.1±0.5
|
0.02
|
|
Right
|
5.5±5.4
|
2.0±1.1
|
0.11
|
| Hip Flexion (°) |
Left
|
85.1±14.1
|
71.5±16.0
|
0.16
|
|
Right
|
84.2±17.2
|
71.9±17.5
|
0.23
|
| Hip Adduction (°) |
Left
|
23.6±6.2
|
14.6±4.4
|
0.01
|
|
Right
|
21.9±3.5
|
13.3±5.5
|
0.01
|
As shown above, for the Single Leg Hop Performance; the non-normalized hop values showed that male participants jumped significantly further which is expected due to longer legs/greater body size. For the normalized hop values, which improves comparability between sexes, yet, males continue to outperform woman overall. As far as sex differences; males generated greater lower extremity power which may explain better performance on hop tests.
On the other hand, Dynamic Balance Assessment results similar findings between the sexes. Males were better in the posterolateral direction which is similar to previous studies with recreationally active participants.
Finally, in the Lower Extremity Jump Landing Biomechanics results, it was found that men displayed higher knee valgus and hip adduction. This pattern of injury may indicate high ACL injury risk.
Based on our findings, it was concluded that the Microsoft Kinect® was suitable for collecting joint kinematic data during a functional task. Also, future research should assess the ability of the Kinect camera system to measure knee and hip kinematics during different tasks such as walking gait or stair climbing.


