Advances in Food Technology and Nutritional Sciences

Open journal

ISSN 2377-8350

Microperimetry in Optic Neuritis

Indrish Bhatia, Shveta Lukhmana, Digvijay Singh, Vimala Menon, Pradeep Sharma and Rohit Saxena*

Received: June 30th, 2016; Accepted: August 1st, 2016; Published: August 2nd, 2016

INTRODUCTION

Optic neuritis negatively impacts various visual functions including visual fields. Varying patterns of field loss have been reported, ranging from altitudinal, arcuate and centrocaecal to diffuse and even unilateral hemianopic field defects.1,2,3,4,5,6,7,8

Nearly all studies on visual fields in optic neuritis have been done using the standard automated perimetry, which has inadequate compensation for eye movements and this is particularly important in cases of poor vision and central scotomas such as those seen in optic neuritis. Microperimetry is a novel diagnostic modality that overcomes this limitation by continuously tracking the patient’s fundus during stimulus projection. Eye movement detected by the machine either causes a pause in stimulus projection, or alteration the position of stimulus projection to match the amount of eye excursion. Additionally, the microperimeter also overlays the sensitivity map on the fundus image providing a visually appealing result with good structural correlation.923

 There are limited studies of microperimetry in optic neuritis and only one comparing it to the standard perimetry.24,25 This study evaluates microperimetry as tool for visual field assessment in optic neuritis and compares it with the standard automated perimetry.

METHODS

A prospective case control study was conducted at a tertiary eye care hospital in India after prior approval from the Institutional Ethics Committee (IEC). Ten consecutive cases of optic neuritis and 10 controls were enrolled into the study after written informed consent. The inclusion criteria for cases was the presence of acute unilateral optic neuritis diagnosed clinically (sudden onset diminution of vision in one eye of less than 2 weeks duration with or without optic nerve head changes and/or pain on eye movements preceding the vision loss in the presence of relative afferent papillary defect) in the absence of any other ocular or neurological pathology likely to affect fields. Cases were excluded if they were bilateral, had a previous episode of optic neuritis, were aged less than 18 years and/or had a Snellen’s visual acuity worse than 6/60. Controls recruited were healthy individuals aged above 18 years with no known ocular or neurological disease. Cases or controls were excluded if they did not consent to the study or were lost to follow-up.

The subjects underwent a comprehensive evaluation including a detailed clinical history and examination (neurological and ophthalmic) followed by visual fields and microperimetry. Visual acuity was assessed using the Snellen’s chart, visual fields by the 10-2 and 30-2 protocols on the Humphrey visual field analyzer (Carl Zeiss Meditec AG, Germany) as well as the central 20 degrees algorithm on the MP-1 microperimeter (Nidek, Japan). The order of these field tests was selected randomly. Visual fields on the microperimeter were performed using a 4-2 threshold strategy with an initial attenuation of 10 decibel-milliwatt (Dbm) and Goldmann III sized stimulus of white color, projected for 200 ms with a red cross fixation target of 7 degrees diameter.

To negate the effect of learning curve on visual field assessment, visual fields were repeated daily in both eyes till two identical fields on two consecutive days were obtained. These fields were then chosen for the study.

Patients were followed at 1 and 3 months after the initial presentation for visual parameters and field testing. Controls also underwent the Humphrey 10-2 and 30-2 field tests and microperimetry using the same settings as cases.

Statistical analysis was performed using SPSS 13.0 software (IBM Corporation, Armonk, NY, USA). For the purpose of analysis, the study population was divided into 3 groups; A (Eyes clinically diagnosed to be affected by optic neuritis n=10), B (Fellow, apparently unaffected eyes in unilateral cases, n=10) and C (Eyes of normal healthy controls; n=20). Comparison of variables was done at all hospital visits between the three groups, and over time for each group. Independent and paired samples t-test, Analysis of variance (ANOVA), Pearson’s chi square test, Mann-Whitney test and the Friedman test were used as appropriate. A p<0.05 was considered statistically significant.

RESULTS

The demographic details of the cases and control groups are summarized in Table 1. There was no statistically significant difference with regard to demography between cases and controls. The duration of optic neuritis at presentation was 6±2.6 days with a range of 1-10 days.


Table 1: Demographic profile of cases and controls.
Patients (n=10) Controls (n=10) p-value
Age (years)(Mean±SD)

(Range)


25.7±2.8 (18-38)


27.8±2.4 (25-32)


0.48 (independent sample t-test)

Sex

Male

Female


4 (40%)

6 (60%)


7 (70%)

3 (30%)


0.134 (Pearson chi square test)


Mean visual acuity was reduced in affected eyes at presentation, being significantly lower than that of fellow eyes and controls. Statistically significant improvement occurred at both 1 month and 3 month follow-ups. However, at 1 month follow-up, the visual acuity was still significantly lower than that of controls. Vision in fellow eyes was not significantly different from that of controls at any visit, and did not show any significant change over time (Table 2).


Table 2: Visual acuity changes and trend.

At first visit (0 month)

At 1 month At 3 months p value (for change over time)
Group A

(n=10)

Decimal scale (Mean±SD) 0.27±0.19 0.72±0.26 0.89±0.24

p(A0,A1): <0.001   

p(A1,A3): 0.012

Group B

(n=10)

Decimal scale (Mean±SD) 0.93±0.14 0.92±0.18 1.01±0.14

P(B0,B1): 0.755

p(B1,B3): 0.088

Group C

(n=20)

Decimal scale (Mean±SD) 0.94±0.17
p value(for intergroup differences)

p(A0,B0): <0.001

p(A0,C0): <0.001

p(B0,C0): 0.91

p(A1,B1): 0.07

p(A1,C0): 0.02

p(B1,C0): 0.85

p(A3,B3): 0.15

p(A3,C0): 0.89

p(B3,C0): 0.38

Group A: Eyes affected by optic neuritis; Group B: fellow eyes; Group C: eyes of controls.


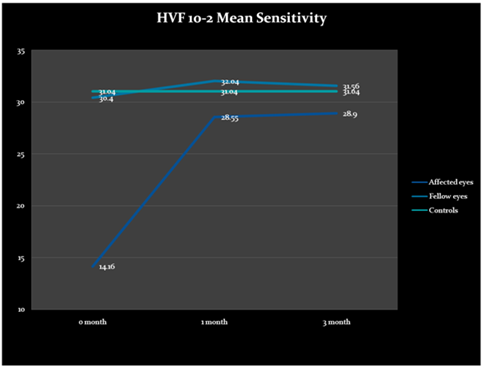
The mean sensitivity of the central visual field as measured by Humphrey visual field (HVF) 10-2 was significantly reduced at presentation in affected eyes when compared to fellow eyes and controls. This improved significantly by 1 month after presentation and reached near normal levels and did not improve significantly thereafter. The mean sensitivity of fellow eyes was comparable to that of controls at all visits (Table 3; Figure 1). The pattern deviation and change (within and between groups) for HVF 10-2 mean defect was similar to that discussed for HVF 10-2 mean sensitivity (Table 4).


Table 3: HVF 10-2 Mean threshold sensitivity changes and trend.
At first visit (0 month) At 1 month At 3 months p value (for change over time)
Group A

(Mean±SD)

14.16±11.51 28.55±8.32 28.90±8.36

p(A0,A1):<0.001

p(A1,A3):0.468

Group B

(Mean±SD)

30.40±1.98 32.04±1.61 31.56±1.76

p(B0,B1):0.085

p(B1,B3):0.344

Group C

(Mean±SD)

31.04±1.95
p value (for intergroup differences)

p (A0,B0): 0.001 

p (A0,C0): <0.001

p (B0,C0): 0.328

p (A1,B1): 0.084

p (A1,C0): 0.158

p (B1,C0): 0.373

p (A3,B3): 0.212

p (A3,C0): 0.545

p (B3,C0): 0.475

Group A: Eyes affected by optic neuritis; Group B: fellow eyes; Group C: eyes of controls.


Figure 1: Graphical Trend of Change in HVF 10-2 Mean Sensitivity

Graphical trend of change in HVF 10-2 Mean Sensitivity


Table 4: HVF 10-2 Mean defect: changes and trend.
At first visit (0 month) At 1 month At 3 months p value (for change over time)
Group A

(Mean±SD)

-20.87±12.13 -6.06±8.71 -5.74±8.42

p(A0,A1):<0.001

p(A1,A3):0.53

Group B

(Mean±SD)

-4.02±1.72 -2.49±1.88 -3.04±1.82

p(B0,B1):0.09 

p(B1,B3):0.19

Group C

(Mean±SD)

-7.27±1.84
p value (for intergroup differences)

p(A0,B0): 0.002

p(A0,C0): <0.001

p(B0,C0): 0.109

p(A1,B1): 0.192

p(A1,C0): 0.071

p(B1,C0): 0.650

p(A3,B3): 0.250

p(A3,C0): 0.148

p(B3,C0): 0.871

Group A: Eyes affected by optic neuritis; Group B: fellow eyes; Group C: eyes of controls.


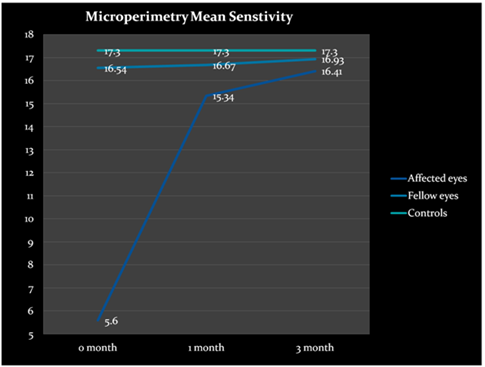
On Microperimetry, the mean sensitivity (central 20 degrees of the visual field) of affected eyes was significantly lower at presentation as compared to fellow eyes and controls, and improved significantly by 1 month follow-up. However, at 1 month, the mean sensitivity was still significantly lower than that of controls. Further changes in mean sensitivity over time were not statistically significant. The mean sensitivity of fellow eyes was not affected at any visit in comparison to controls (Table 5; Figure 2). The trend of affection and change of mean defect on microperimetry paralleled that of mean sensitivity (Table 6).


Table 5: Microperimetry mean threshold sensitivity changes and trend.

At first visit (0 month)

At 1 month At 3 months p value (for change over time)
Group A

(Mean±SD)

5.60±7.32 15.34±4.59 16.41±4.87

p(A0,A1):<0.001

p(A1,A3):0.058

Group B

(Mean±SD)

16.54±1.46 16.67±1.52 16.93±2.16

p(B0,B1):0.839

p(B1,B3):0.699

Group C

(Mean±SD)

17.30±1.64
p value (for intergroup differences)

p(A0,B0):0.002

p(A0,C0):<0.001

p(B0,C0):0.109

P(A1,B1):0.437  

p(A1,C0):0.030

p(B1,C0):0.214

p(A3,B3):0.920

p(A3,C0):0.849

p(B3,C0):0.901

Group A: Eyes affected by optic neuritis; Group B: fellow eyes; Group C: eyes of controls.


Figure 2: Graphical trend of change in Microperimetry Mean Sensitivity

Graphical trend of change in Microperimetry Mean Sensitivity


Table 6: Microperimetry mean defect: changes and trend.
At first visit (0 month) At 1 month At 3 months p value (for change over time)
Group A           (Mean±SD) -12.63±6.80 -4.35±4.68 -3.31±4.96

p(A0,A1):<0.001

p(A1,A3):0.083

Group B         (Mean±SD) -3.09±1.39 -3.04±1.46 -2.81±2.14

p(B0,B1):0.930

p(B1,B3):0.736

Group C            (Mean±SD) -2.42±1.70
p value (for intergroup differences)

p(A0,B0):0.004

p(A0,C0):<0.001

p(B0,C0):0.143

p(A1,B1):0.664  

p(A1,C0):0.027

p(B1,C0):0.169

p(A3,B3):0.494

p(A3,C0):0.796 

p(B3,C0):0.901

Group A: Eyes affected by optic neuritis; Group B: fellow eyes; Group C: eyes of controls.


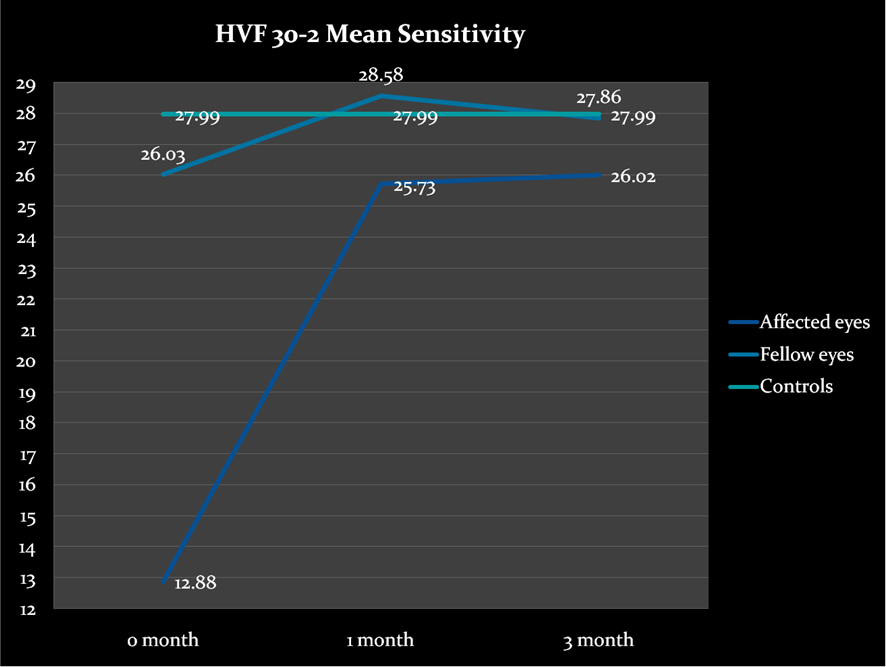
On the HVF 30-2 examination, the affected eyes showed a similar trend of affliction and recovery as the 10-2 though the fellow eyes differed. The mean sensitivity for fellow eyes was found to be significantly lower than that for controls at the time of presentation. This improved significantly by the first follow-up visit to match that of controls. No further statistically significant improvement was seen (Table 7; Figure 3). The results of mean defect on HVF 30-2 echoed those of mean sensitivity (Table 8).


Table 7: HVF 30-2 Mean threshold sensitivity changes and trend.
At first visit
(0 month)
At 1 month At 3 months p value (for change over time)
Group A    (Mean±SD) 12.88±10.32 25.73±7.72 26.02±7.54

p(A0,A1):<0.001

p(A1,A3):0.60

Group B    (Mean±SD) 26.03±2.59 28.58±1.50 27.86±1.77

p(B0,B1):0.03

p(B1,B3):0.26

Group C    (Mean±SD) 27.99±2.31
p value (for intergroup differences)

p(A0,B0):0.004

p(A0,C0):<0.001

p(B0,C0):0.044

p(A1,B1):0.636

p(A1,C0):0.224

p(B1,C0):0.914

p(A3,B3):0.743

p(A3,C0):0.259

p(B3,C0):0.619

Group A: Eyes affected by optic neuritis; Group B: fellow eyes; Group C: eyes of controls.


Figure 3: Graphical trend of change in HVF 30-2 Mean Sensitivity

Graphical trend of change in HVF 30-2 Mean Sensitivity


Table 8: HVF 30-2 Mean defect: changes and trend.
At first visit (0 month) At 1 month At 3 months p value (for change over time)
Group A          (Mean±SD) -19.32±11.38 -5.61±8.29 `-5.37±7.82

p(A0,A1):<0.001

p(A1,A3):0.63

Group B            (Mean±SD) -4.85±2.06 -2.41±1.58 -3.14±1.53

p(B0,B1):0.03

p(B1,B3):0.19

Group C           (Mean±SD) -3.08±2.24
p value (for intergroup differences)

p(A0,B0):0.001

p(A0,C0):<0.001

p(B0,C0):0.031

p(A1,B1):0.192

p(A1,C0):0.29

p(B1,C0):0.914

p(A3,B3):0.341

p(A3,C0):0.112

p(B3,C0):0.502

Group A: Eyes affected by optic neuritis; Group B: fellow eyes; Group C: eyes of controls.


The microperimetry mean sensitivity showed a strong and significant correlation with visual acuity and the mean sensitivity and mean defect on HVF 10-2 (Table 9).


Table 9: Correlation of microperimetry mean threshold sensitivity with visual acuity and 10-2 visual field parameters.
At presentation At 1 month At 3 months
Visual Acuity

r=0.865

p=<0.001

r=0.678

p=0.008

r=0.715

p=0.004

Mean sensitivity 10-2

r=0.917

p=<0.001

r=0.965

p=<0.001

r=0.970

p=<0.001

Mean defect 10-2

r=0.914

p=<0.001

r=0.963

p=<0.001

r=0.969

p=<0.001

Group A: Eyes affected by optic neuritis; Group B: fellow eyes; Group C: eyes of controls.


DISCUSSION

Microperimetry has several advantages over standard automated perimetry. These range from greater accuracy to more aesthetically appealing results. Our study was designed to evaluate the sensitivity of microperimetry for visual field analysis in optic neuritis and compare it with HVF 10-2. In addition, we also compared the findings of HVF 30-2 to the above two field tests in order to determine whether peripheral visual field testing provides any extra information than can be obtained from the central visual field alone.

Visual acuity in clinically affected eyes was found to be significantly lower than fellow eyes and controls. It improved incompletely over 1 month and needed a period of 3 months to reach normal levels, similar to the control group (p=0.89). This is consistent with previous studies that have reported delayed recovery of vision.26,27,28,29 This delayed recovery in visual acuity was paralleled by the delayed recovery of central 20 degree sensitivity on microperimetry at 1 month but not the sensitivity of the 10-2 standard automated perimetry. This may imply that field testing by microperimetry is more sensitive to visual function changes. A similar result was reported by previous studies in literature.24,25

The finding that on microperimetry, at 1 month follow-up, the mean sensitivity in affected eyes was still lower than that of controls (p=0.03) suggests that subtle residual changes in macular sensitivity may persist in eyes with optic neuritis (atleast for the first month) even after apparent clinical resolution on the standard 10-2 perimetry (p=0.16).These results are in contrast to a recent report by Lima et al,23  where in they suggested that microperimetry detects lesser sensitivity loss than standard automated perimetry in diseases involving the inner retina and optic nerve. However, their assumption is based on studies in glaucoma. Optic neuritis has a significant pathogenetic differences from glaucoma, and these may explain the difference in sensitivity patterns of the two tests in the two disorders. Acton et al26  published a review highlighting the differences between microperimetry and standard automated perimetry and found adequate evidence to show the link between functional and structural changes in diseases pertaining to the retina as well as correlation between visual outcome and sensitivity on microperimetry. Whilst not strictly comparable to the current study, the review does concur with our study.

Another significant finding in our study was that the asymptomatic fellow eyes were found to have defects (compared to controls) on HVF 30-2, whereas they tested normal on HVF 10-2 and microperimetry. This suggests that though macular sensitivity may be unaffected in fellow eyes at the time of acute attack of optic neuritis, there are changes in the remaining visual field (central 60 degrees), which may affect the quality of vision and be a marker for subclinical damage. Thus, even though central visual field examinations like HVF 10-2 and microperimetry chart scotomas and other defects in much greater detail, testing a larger area of the visual field cannot be done away with. Likewise for cases of optic neuritis with unaffected visual acuity, peripheral field defects may be present which would get missed on a test such as the microperimetry and would require a full field evaluation. Nevalainen et al,1 Fang et al,3 Rothova Z et al5 and Mienberg et al30  agree with this view, but Keltner J et al4 opine that in most cases, follow-up of optic neuritis eyes can be monitored by central visual field alone.

Among the central visual field tests, microperimetry appears to be superior to the standard automated perimetry. However there are potential drawbacks associated with this technology including the cost, requirement of technical expertise, and the long duration of the test (approximately 15 minutes per eye). The duration however can be reduced to a great extent (as low as 5 minutes per eye) by judicious selection of the test protocol and the testing strategy. Additionally, the inability to acquire peripheral visual fields prevents it from being a holistic perimetry testing system.

To conclude, the superior sensitivity of microperimetry and its greater correlation with vision as compared to HVF 10-2 put forward a case for the use of microperimetry as an alternative visual field examination in patients with optic neuritis. However, the standard HVF 30-2 examination remains indispensable in the work-up of optic neuritis.

CONFLICTS OF INTEREST

The authors declare that they have no conflicts of interest.

1. Nevalainen J, Krapp E, Paetzold J, et al. Visual field defects in acute optic neuritis–distribution of different types of defect pattern, assessed with threshold-related supraliminal perimetry, ensuring high spatial resolution. Graefes Arch Clin Exp Ophthalmol. 2008; 246(4): 599-607. doi: 10.1007/s00417-007-0722-2

2. Keltner JL, Johnson CA, Spurr JO, Beck RW. Baseline visual field profile of optic neuritis the experience of the optic neuritis treatment trial. Arch Ophthalmol. 1993; 111(2): 231-234. doi: 10.1001/archopht.1993.01090020085029

3. Fang JP, Donahue SP, Lin RH. Global visual field involvement in acute unilateral optic neuritis. Am J Ophthal. 1999; 125(5): 554-565. doi: 10.1016/S0002-9394(99)00298-6

4. Keltner JL, Johnson CA, Spurr JO, Beck RW. Comparison of central and peripheral visual field properties in the optic neuritis treatment trial. Am J Ophthalmol. 1999; 128(5): 543-553. doi: 10.1016/S0002-9394(99)00304-9

5. Rothová Z, Jech R. Residual findings in retrobulbar neuritis during demyelinization. Cesk Slov Oftalmol. 1998; 54(2): 95-99. Web site. http://europepmc.org/abstract/med/9622948. Accessed June 29, 2016

6. Gerling J, Meyer JH, Kommerell G. Visual field defects in optic neuritis and anterior ischemic optic neuropathy: Distinctive features. Graefes Arch Clin Exp Ophthalmol. 1998; 236(3): 188-192. doi: 10.1007/s004170050062

7. Trobe JD, Glaser JS. Quantitative perimetry in compressive optic neuropathy and optic neuritis. Arch Ophthalmol. 1978; 96(7): 1210-1216. doi: 10.1001/archopht.1978.03910060044008

8. Beck RW, Kupersmith MJ, Cleary PA, Katz B. Fellow eye abnormalities in acute unilateral optic neuritis: Experience of the optic neuritis treatment trial. Ophthalmology. 1993; 100(5): 691-697. doi: 10.1016/S0161-6420(13)31589-9

9. Orzalesi N, Miglior S, Lonati C, Rosetti L. Microperimetry of localized retinal nerve fiber layer defects. Vision Res. 1998; 38(5): 763-771. doi: 10.1016/S0042-6989(97)00171-5

10. Van de Velde FJ, Timberlake GT, Jalkh AE, Schepens CL. Static microperimetry with the laser scanning ophthalmoscope. (In French) Ophtalmologie. 1990; 4(3): 291-294. Web site. http://www.ncbi.nlm.nih.gov/pubmed/2250964. Accessed June 29, 2016

11. Jean B, Frohn A, Thiel HJ. Laser scanning in ophthalmology. Fortschr Ophthalmol. 1990; 87(2): 158-167. Web site. http://europepmc.org/abstract/med/2192974. Accessed June 29, 2016

12. Sjaarda RN, Frank DA, Glaser BM, Thompson JT, Murphy RP. Resolution of an absolute scotoma and improvement of relative scotomata after successful macular hole surgery. Am J Ophthalmol. 1993; 116(2): 129-139. doi: 10.1016/S0002-9394(14)71276-0

13. Schneider U, Kuck H, Inhoffen W, Kreissig I. Fundus-controlled microperimetry with the scanning laser ophthalmoscope in macular diseases. Klin Monbl Augenheilkd. 1993; 203(3): 212-218. doi: 10.1055/s-2008-1045670

14. Sjaarda RN, Frank DA, Glaser BM, Thompson JT, Murphy RP. Assessment of vision in idiopathic macular holes with macular microperimetry using the scanning laser ophthalmoscope. Ophthalmology. 1993; 100(10): 1513-1518. doi: 10.1016/S0161-6420(93)31448-X

15. Kakehashi A, Ishiko S, Konno S, Akiba J, Yoshida A. Differential diagnosis of macular breaks by microperimetry with a scanning laser ophthalmoscope. Nippon Ganka Gakkai Zasshi. 1995; 99(8): 920-924. Web site. http://europepmc.org/abstract/med/7676892. Accessed June 29, 2016

16. Toonen F, Remky A, Janssen V, Wolf S, Reim M. Microperimetry in patients with central serous retinopathy. Ger J Ophthalmol. 1995; 4(5): 311-314. Web site. http://europepmc.org/abstract/med/7496344. Accessed June 29, 2016

17. Schneider U, Kuck H, Inhoffen W, Kreissig I. Fundus oriented microperimetry with the scanning laser ophthalmoscope in age-induced macular degeneration. Klin Monbl Augenheilkd. 1996; 209(2-3): 8-13. Web site. http://europepmc.org/abstract/med/8992088. Accessed June 29, 2016

18. Schneider U, Inhoffen W, Gelisken F, Kreissig I. Assessment of visual function in choroidal neovascularization with scanning laser microperimetry and simultaneous indocyanine green angiography. Graefes Arch Clin Exp Ophthalmol. 1996; 234(10): 612-617. doi: 10.1007/BF00185293

19. Tezel TH, Del Priore LV, Flowers BE, et al. Correlation between scanning laser ophthalmoscope microperimetry and anatomic abnormalities in patients with subfoveal neovascularization. Ophthalmology. 1996; 103(11): 1829-1836. doi: 10.1016/S0161-6420(96)30419-3

20. Tsujikawa M, Ohji M, Fujikado T, Saito Y, Motokura M, Ishimoto I, Tano Y. Differentiating full thickness macular holes from impending macular holes and macular pseudoholes. Br J Ophthalmol. 1997; 81(2): 117-122. doi: 10.1136/bjo.81.2.117

21. Ishiko S, Ogasawara H, Yoshida A, Hanada K. The use of scanning laser ophthalmoscope microperimetry to detect visual impairment caused by macular photocoagulation. Ophthalmic Surg Lasers. 1998; 29(2): 95-98. doi: 10.3928/1542-8877-19980201-03

22. Takamine Y, Shiraki K, Moriwaki M, Yasunari T, Miki T. Retinal sensitivity measurement over drusen using scanning laser ophthalmoscope microperimetry. Graefes Arch Clin Exp Ophthalmol. 1998; 236(4): 285-290. doi: 10.1007/s004170050079

23. Lima VC, Prata TS, De Moraes CGV, et al. A comparison between microperimetry and standard achromatic perimetry of the central visual field in eyes with glaucomatous paracentral visual-field defects. Br J Ophthalmol. 2010; 94(1): 64-67. doi: 10.1136/bjo.2009.159772

24. Romano MR, Angi M, Romano F. Macular sensitivity change in multiple sclerosis followed with microperimetry. Eur J Ophthalmol. 2007; 17(3): 441-444. Web site. http://medlib.yu.ac.kr/eur_j_oph/ejo_pdf/2007_17_441-444.pdf. Accessed June 29, 2016

25. Xiao-Peng Cao, Yun Xiao, Xiao-Wei Gao, Xue-Hong Cai, Ying Lei, Peng Cao. Clinical effect of MP-1 microperimetry detection in early diagnosis of acute retrobulbar neuritis; (In Chinese). International Eye Science. 2012.

26. Acton JH, Greenstein VC. Fundus-driven perimetry (microperimetry) compared to conventional static automated perimetry: similarities, differences and clinical applications. Can J Ophthalmol. 2013; 48(5): 358-363. doi: 10.1016/j.jcjo.2013.03.021

27. Trobe JD, Beck RW, Moke PS, Cleary PA. Contrast sensitivity and other vision tests in the optic neuritis treatment trial. Am J Ophthalmol. 1996; 121: 547-553. doi: 10.1016/S0002-9394(14)75429-7

28. Beck RW, Cleary PA. Optic neuritis treatment trial: One-year follow-up results. Arch Ophthalmol. 1993; 111(6): 773-775. doi: 10.1001/archopht.1993.01090060061023

29. Beck RW, Trobe JD. The optic neuritis treatment trial: Putting the results in perspective. J Neuro-ophthalmol. 1995; 15: 131-135. Web site. http://www.ncbi.nlm.nih.gov/pubmed/8574355. Accessed Accessed June 29.

30. Mienberg O, Flammer J, Ludin HP. Subclinical visual field defects in multiple sclerosis: Demonstration and quantification with automated perimetry, and comparison with visually evoked potentials. J Neurol. 1982; 227(3): 125-133. doi: 10.1007/BF00313566

LATEST ARTICLES

Prevalence and Risk Factors of Subclinical Mastitis of Goats in Banadir Region, Somalia

Omar M. Salah*, Yasin H. Sh-Hassan, Moktar O. S. Mohamed, Mohamed A. Yusuf and Abas S. A. Jimale

doi.10.17140/VMOJ-9-184

Use of Black Soldier Fly (Hermetia illucens) Prepupae Reared on Organic Waste

Maggot Debridement Therapy: A Natural Solution for Wound Healing

Isayas A. Kebede*, Haben F. Gebremeskel and Gelan D. Dahesa,

doi.10.17140/VMOJ-9-183

Figure 11. Risk Map for the Introduction of Ruminant Diseases at Borders

Ovine Network in Morocco: Epizootics Spread Prevention and Identification of the At-Risk Areas for “Peste des Petits Ruminants” and “Foot and Mouth Disease”

Yassir Lezaar*, Mehdi Boumalik, Youssef Lhor, Moha El-Ayachi, Abelilah Araba and Mohammed Bouslikhane

doi.10.17140/EPOJ-8-131

The Impact of Family Dynamics on Palliative Care at the End-of-Life

Neil A. Nijhawan*, Rasha Mustafa and Aqeela Sheikh

doi.10.17140/PMHCOJ-10-154

Long-Term Follow-Up After Laparoscopic Radical Prostatectomy for Localized and Locally Advanced Prostate Cancer

Shrenik J. Shah*, Abhishek Jha, Chirag Davara, Rushi Mistry and Kapil Kachhadiya

doi.10.17140/UAOJ-7-147

Mindfulness, Sustained Attention and Post-Traumatic Stress in Tsunami Survivors

Christina Hagen*, Lars Lien, Edvard Hauff and Trond Heir

doi.10.17140/PCSOJ-2-115

Treatment and Control Methods of Bovine Mastitis: A Review

Isayas A. Kebede* and Gelan D. Dahesa

doi.10.17140/VMOJ-9-182

LATEST ARTICLES

Original Research

2024 Mar

Omar M. Salah*, Yasin H. Sh-Hassan, Moktar O. S. Mohamed, Mohamed A. Yusuf and Abas S. A. Jimale
Use of Black Soldier Fly (Hermetia illucens) Prepupae Reared on Organic Waste

review

2024 Mar

Isayas A. Kebede*, Haben F. Gebremeskel and Gelan D. Dahesa,