INTRODUCTION
Characteristics of adipose tissue in the human body (its condition and volume) reflect the specifics of metabolism in the body, and therefore are of interest for the medical diagnostics. The simplest method to estimate these characteristics is anthropometry, which can reveal the deviations of body proportions (dimension and weight-wise) from empirically defined standards. However, this method does not provide information about biochemical and anatomical features of the adipose tissue in the body. Hence, there is an interest to the methods that allow to get this information non-invasively.1 These include approaches based on the phenomenon of nuclear magnetic resonance (NMR), namely high resolution NMR spectroscopy and magnetic resonance imaging (MRI).2 Local NMR spectroscopy performed in vivo provides information on the chemical structure of the tissues. MRI gives images of tissue slices, on which one can select and calculate the volume of tissue with physical characteristics (chemical shift, relaxation, and others) most close to the tissue of interest (adipose tissue in our case).
The above mentioned methods are most effective when the whole human body is scanned.3 This can be achieved by moving the body through the scanner and taking images one part of the body at a time—the one that is currently located in the magnet’s isocenter, where the magnetic field is most uniform.
The main problem of the MRI is a relatively long scan time—several minutes for one part of the body. Moreover, for each part, 2 or more scans with different parameters should be performed to identify the relaxation characteristics of the studied tissues, which further increase the total time of the study.
Consequently, fast analysis methods (for example, whole body NMR spectroscopy) are of great interest, because the spectrum from the part of the body can be obtained in one second. One version of this method is proposed in the paper,4 which describes experiments with mice. In the mentioned paper, the correlation between the ratio of water and fat peaks in the NMR spectrum from the whole body of a mouse and the amount of fat contained in the animal body was found. These conclusions were made from the comparison of the spectral data with the results of carcass analysis based on the animal dissection with subsequent mechanical separation of fat, muscle and other tissues of the body.
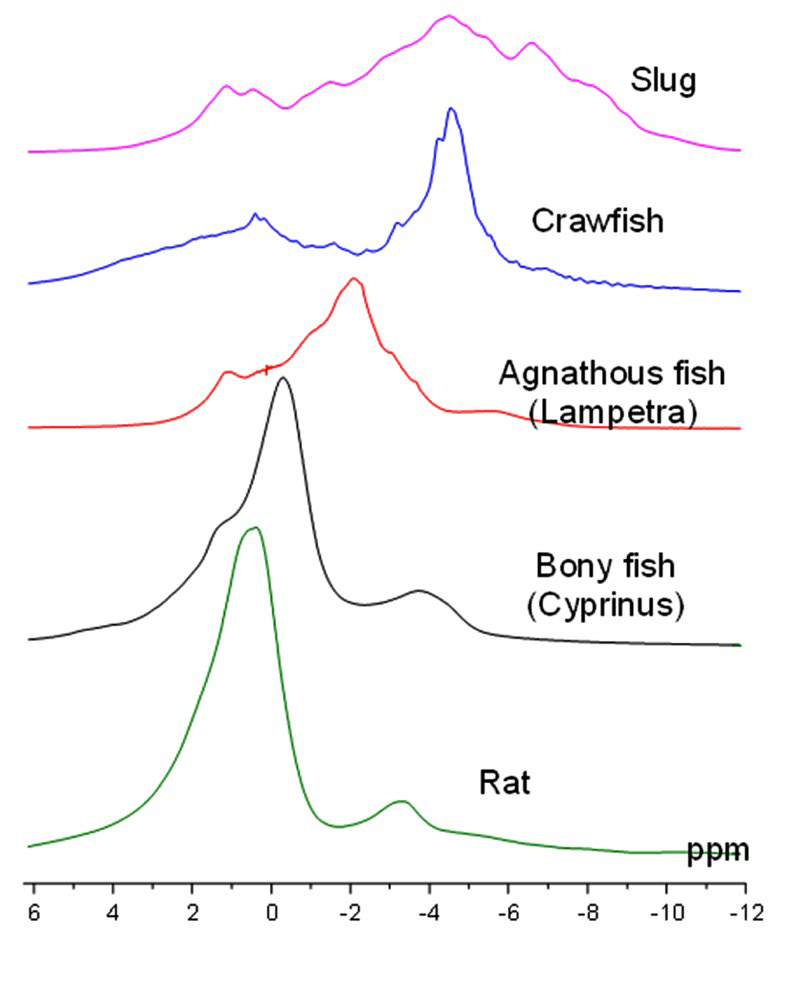
This method can be justified by the fact that the proton NMR spectrum of the whole body of vertebrates contains pronounced water and fat peaks located at 0 and -3.5 ppm respectively (Figure 1). Therefore, there is a good reason to believe that similar spectral measurements may be informative for human body too.
Figure 1: Whole-body NMR spectra for different types of animals at 0.5 Tesla: top to bottom–Mollusk (slug), Crustacea (crawfish), Agnatha (lampetra), Osteichthyes (carp), Mammalia (rat).
MATERIALS AND METHODS
The main problem with the acquisition of the NMR spectrum from the whole human body is that its size is significantly larger than the region of the magnetic field homogeneity. The measurements cannot be done at once for the whole body, as for a small laboratory animal (e.g., a mouse), but only part by part. Therefore, the scanned body segment must be located within a zone with good homogeneity of the magnetic field. The easiest way to perform such a scan is to move the object gradually through this zone.
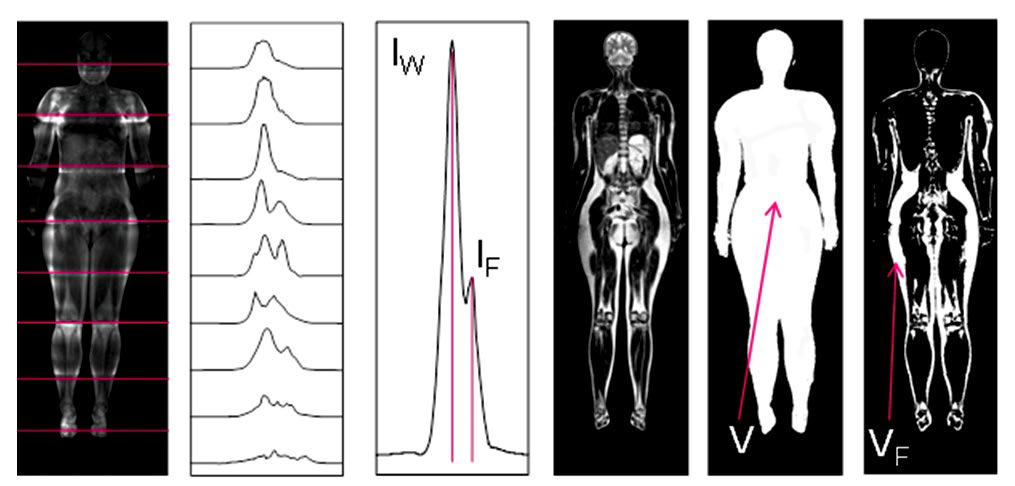
In the present study, we have implemented such techniques by using a 0.5-Tesla MR scanner Bruker Tomikon S50, which can work with gradient strength of up to 16.8 mT/m, and a 2-kW RF transmitter. NMR spectra were obtained slice-byslice. Schematic of location of these slices and the corresponding spectra are presented in the two leftmost frames of Figure 2.
In the combined NMR spectrum, the intensity of peaks of water IW and fat IF were measured (the third frame of Figure 2). Since the carcass method is not suitable for human analysis, the spectral measurements were compared with the data on the average density of the body ρ=m/V, where V is the volume of the body, and m is its mass.
The mass was determined by weighing on a common scale. To determine the body volume, MRI data were used however, there are alternative methods to do it (for example, measuring the change in water level when a study subject is immersed into water bath).
MRI allowed identifying the anatomical structures, to measure the body volume (V) and the total amount of abdominal and subcutaneous fat VF (three right frames of Figure 2).
The scanning area was a slice with the thickness of 20 cm oriented perpendicular to the direction of moving the body. The patient was placed in the usual for MRI horizontal position on a mobile platform, which was incrementally moved with the step equal to the slice thickness. It allowed moving the whole body through the magnet’s isocenter (where magnetic field is the most homogeneous) and obtaining a local NMR spectrum for each segment of the body with the thickness of 20 cm (number of such segments for adults varied between 8 and 10).
To limit the effective scanning volume, conventional slice-selective MRI method was used; the gradient field directed perpendicular to the plane of the selected slice5 was applied simultaneously with the frequency-selective excitation RF pulse.
The slice thickness Z is determined by the equation: Z=2πΔf/γG, where G–magnetic field gradient, γ/2π=26.5 MHz/T–gyromagnetic ratios of protons, Δf–the width of the frequency spectrum of RF pulse, which is inversely proportional to the pulse duration.
For monitoring location of a certain part of the body, one-slice (with the thickness in head-to-foot direction equal to 20 cm) images in three orthogonal planes were recorded in advance. These images were used for rough estimation of the body volume V.6
Processing MRI images was carried out using graphical tools of ImageJ software.7 Calculation of the body volume was performed the following way: for each projected MRI image the contour of visualized part of the body was determined and its area was quantified by binarization method–transformation of halftone image to black-and-white image. Binarization threshold was calculated automatically using the ImageJ tools. The contour area quantified for coronal projection was multiplied by slice thickness that gave the main contribution to the measured body volume. Extra contribution determined by measuring contour areas in other two projections was subtracted from this volume. This method gives slightly overestimated results because it is hard to take into account the volume variations in the periphery of the human body (head or extremities). However, the contribution of these areas to the volume of the whole body is small. Therefore, this method of measuring body volume can be acceptable for rough fast estimates.
RESULTS
For some participants of this study, MRI images of the whole body were obtained to compare the results of the spectral measurements with the MRI data. T1- and T2-weighted images (WI) were also obtained in the Fast Spin Echo (FSE) mode with the parameters TR/TE=600/15 and 5800/100 m/sec, respectively, and ETL for FSE equal to eight. Acquisitions of the local NMR spectra and whole-body MRI were carried out by moving incrementally these participants through the zone of the magnetic field homogeneity. For MRI, 26-slice scanning was performed with the resolution of 2.2×2.5 mm and the slice thickness of 10 mm. The total scan time did not exceed 30-40 min.
Figure 2: Measurement of body fat percentage by the local NMR spectroscopy (three left frames) and MRI (three right frames).
Fat structures on images were visually defined by comparison with anatomical atlases. A typical sign of adipose tissue is the fact that MRI-signal on T1- and T2-FSE-WI increases. This increase of the MRI signal in T1-WI is due to the fact that tissues with short relaxation time of T1 have stronger response. The reason why adipose tissues are clearly seen in T2- FSE-WI but not in T2-WI, is explained in Henkelman et al.8 The analysis of T2-FSE-WI did not include other clearly identifiable anatomical structures that also produce increased MRI signal on the images, such as bladder, cerebrospinal liquid, liver, kidney, brain structures, etc.
The result of such data processing (binarization of MR images and removal of the above mentioned structures from them) were the MR images similar to shown in the rightmost frame of Figure 2. On these images, the light areas, which supposedly represent adipose tissue, were measured. The total volume of adipose tissue was determined by combining the measurements for all slices.
The following Table 1 shows the results of 8 study subjects.
| Table 1: Results of 8 study subjects. |
| No. of subject |
1 |
2 |
3 |
4 |
5 |
6 |
7 |
8 |
| ρ (kg/m3) |
960 |
985 |
997 |
1000 |
1014 |
1016 |
1045 |
11175
|
|
I F/IW
|
0.97 |
0.84 |
0.93 |
0.77 |
0.63 |
0.61 |
0.31 |
0.42* |
| VF/V |
– |
0.46 |
0.42 |
– |
0.32 |
– |
– |
0.27
|
| *fat peak was not identified on the background of the wide water peak. |
DISCUSSION AND CONCLUSIONS
From these results we can conclude that, in general, there is an inverse relationship between the average body density and the fat-to-water ratios obtained from spectroscopy (IF/IW) and MRI (VF/V) data. This conclusion is in agreement with the intuitive assumption that this density should decrease when the body fat percentage increases. Thus, for any person the correlation between the ratio of water and fat peaks from the whole-body NMR spectrum and the real body fat percentage takes place. This statement is in agreement with the results of work Mystkowski et al.4
The comment to the Table 1 mentions the problem of differentiating broad spectral peaks in situation when the magnetic field has relatively low intensity (0.5 Tesla in our case). For comparison, in the work Mystkowski et al4 the spectral measurements were performed in the magnetic field of 4.7 Tesla. So, the peaks of water and fat in their spectra were well differentiated, and NMR measurements were reduced to assessing areas under NMR line contours (integrals). In our case, the field is relatively low (0.5 Tesla) and the overlapping of the NMR lines is significant. Hence, it is hard to separate the individual contributions of water and fat lines.
Because the location of these peaks is known, math modeling allows solving this problem when the forms of the lines are known. However, the lack of reliable information about the forms of these lines makes the solution of this problem difficult. Therefore, we measured only the intensities of fat and water peaks, but not their integrals. As a result, we obtained upper limit of the IF /IW ratio. For more accurate measurements, the human fat percentage should be evaluated by the NMR methods using MR scanners with the highest possible magnetic field (1.5 Tesla and above). In this case, the spectroscopy method may be more useful than MRI, because spectroscopic measurements can take substantially shorter time.
Obtained results demonstrate the potential of spectroscopy method for fast evaluation of fat percentage in human body. This method is simple to implement, which includes both acquisition of spectra and data processing. Because it is not associated with high RF exposure for the patient and does not take much time, this method can be easily integrated into the whole body MRI study.
ACKNOWLEDGEMENTS
This paper was supported by grant of the Russian Education and Science Ministry #14.604.21.0060 (RFMEFI60414X0060). We express special thanks to patients and health professionals who contributed to the study on a fully voluntary basis.
CONFLICTS OF INTEREST
The authors declare that they have no conflicts of interest.
STATEMENT OF HUMAN AND ANIMAL RIGHTS
All applied procedures were fulfilled in accordance with the ethical standards of the responsible committee on human experimentation (Institutional and National).
CONSENT
Informed consent was obtained from all the patients for being included in the study.


