INTRODUCTION
The human body may be subject to fragmentations by both natural and manmade disasters. Such conditions have lead researcher to continue to estimate Body Height (BH) using available human body parts. The documented results are used by Scientist either in the identification exercise or for body height reconstruction.
In humans, estimation of BH is also applied to check for normal or abnormal growth especially in the young individuals.1,2,3,4
The lower limb extends from the lower part of the trunk to the foot. An understanding of its sub-segments provides a good knowledge of the landmarks required in the measurement for BH prediction using lower limb segments.
The bones of the lower extremity are: the hip bone in the gluteal region/segment, the femur in the thigh, the patella in the knee, the fibular and tibia in the leg, the tarsals, metatarsals, and the phalanges in the foot.5
The long bones of the body have been used to estimate stature6,7,8,9,10,11,12,13,14 and results obtained were reliable.
In this study, we attempted to investigate which of the sub-segments of the lower extremity will predict BH best in the overall population as well as in the males and females.
MATERIALS AND METHODS
Subjects were randomly selected from a pull of 211 persons15 and attention was paid on the measurements of some of the sub-segments of the lower extremity after obtaining informed consents.
Demographics
Information on age, sex, and state of origin were collected.
Exclusion criteria
Individual with limb length discrepancies and other musculo-skeletal disorder affecting body height were excluded from this study. Pregnant women were also excluded.
Inclusion criteria
Subjects from the Igbo ethnic states who were apparently healthy were included in the study.
ANTHROPOMETRICS
Body height (BH): The height was measured to the nearest 0.1 cm using an Anthropometer with subjects standing without shoes with the heels held together, toes apart, and the head held in the Frankfort plane.16
The following lower extremity measurements were taken (see illustration of landmarks, figure 1 below)
Figure 1: Landmarks for measurement of lower extremity segments.5
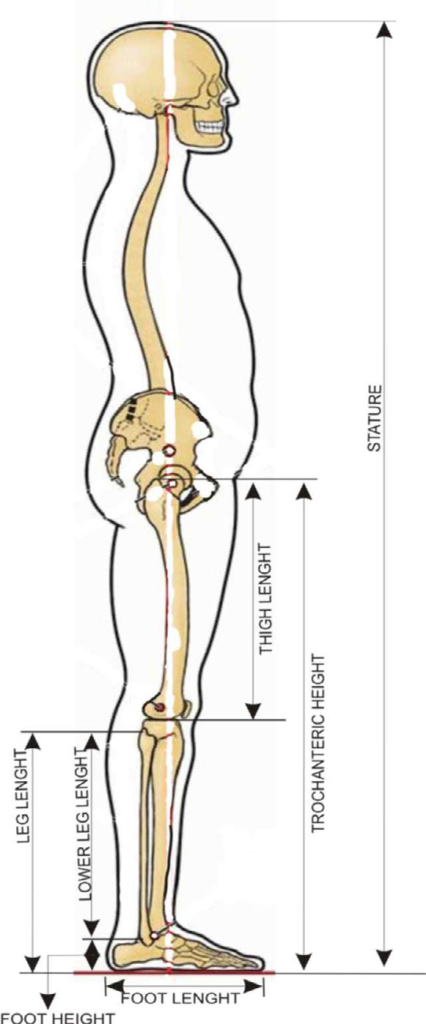
Trochanteric height (TROCH) was measured from the lateral bulging of the greater trochanteric protrusion to the floor.
Thigh length (TL) was measured as the distance between greater trochanter and the knee joint.
Lower leg length (LLL): is the distance from the tibia to the floor.
Leg Length (LL): is the distance from the lateral supracondyl of the tibia to the distal part of the lateral malleolus. All the lower extremity measurements13 were taken cutaneously using measuring tape.
DATA PRESENTATION AND ANALYSIS
In this study, analysis of data was carried out using statistical package for social sciences (SPSS 17.0 software). In summarizing the data, the Minimum, Maximum, Mean and Standard deviations were estimated and presented. A comparison of difference of variable in females and males was also carried out. To test the relationship between BH and lower extremity dimensions, Pearson correlation was performed. The prediction function was derived through linear regression for each of the measurement with BH for the overall population, males and females separately. Finally the predicted/estimated values of BH were compared with that of observed/actual values.
RESULT
Table 1 shows the descriptive statistics of the overall population, females and males for the lower extremity anthropometry. The mean value for the dependent variable (BH) of the population under study was 167.55±9.10 while those of the explanatory variables are as in table 1.
| Table 1: Descriptive statistics of the overall population, females and males, for lower extremity anthropometry (cm). |
| Variables |
Overall population |
females |
males |
| N |
Min |
Max |
Mean |
SD |
N |
Min |
Max |
Mean |
SD |
N |
Min |
Max |
Mean |
SD |
AGE
(YEARS) |
211 |
16 |
45 |
23.58 |
4.95 |
123 |
16 |
45 |
23.47 |
5.36 |
88 |
18 |
43 |
23.35 |
4.34 |
| BH(CM) |
211 |
149.
00 |
190.00 |
167.55 |
9.10 |
123 |
149.
00 |
190.
00 |
163.
17 |
7.64 |
88 |
156.
00 |
190.
00 |
173.
66 |
7.30 |
| TROCH |
198 |
55.90 |
107.00 |
89.93 |
6.38 |
117 |
55.
90 |
104.00 |
88.65 |
6.48 |
81 |
71.00 |
107.00 |
91.79 |
5.762 |
| TL |
198 |
33.00 |
59.00 |
43.11 |
4.36 |
117 |
35.
00 |
55.00 |
42.88 |
4.40 |
81 |
33.00 |
59.00 |
43.44 |
4.32 |
| LL |
198 |
33.00 |
56.00 |
46.55 |
4.14 |
117 |
33.
00 |
55.00 |
45.48 |
3.49 |
81 |
36.00 |
56.00 |
48.10 |
4.53 |
| LLL |
198 |
31.00 |
57.00 |
42.98 |
4.01 |
117 |
31.
00 |
51.00 |
42.00 |
3.77 |
81 |
34.00 |
57.00 |
44.41 |
3.94 |
| BH: Body Height; TROCH: Trochanteric height; TL: Thigh Length; LL: Leg Length; LLL: Lower Leg Length. |
Table 2 represents a comparison of difference of variables in females and males. It reveals that TROCH, TL, LL, LLL are highly significant in males than in females, P<0.0001 while TL is not significant.
| Table 2: Comparison of variables between females and males in lower extremity anthropometry. |
| VARIABLES (CM) |
Paired Differences |
T |
Df |
Sig.
(2-tailed) |
|
95% Confidence Interval of the Difference |
| Mean |
Std. Deviation |
Std. Error Mean |
Lower |
Upper |
| TROCH (F) – TRLOCH (M) |
-4.25641 |
6.55555 |
.74227 |
-5.73446 |
-2.77836 |
-5.734 |
77 |
.000 |
| TL (F) – TL (M) |
-.83333 |
5.60593 |
.63475 |
-2.09727 |
.43061 |
-1.313 |
77 |
.193 |
| LL (F) – LL (M) |
-3.14872 |
5.60980 |
.63518 |
-4.41353 |
-1.88390 |
-4.957 |
77 |
.000 |
| LLL (F) – LLL(M) |
-2.92564 |
5.21438 |
.59041 |
-4.10130 |
-1.74998 |
-4.955 |
77 |
.000 |
| BH: Body Height; TROCH: Trochanteric height; TL: Thigh Length; LL: Leg Length; LLL: Lower Leg Length. Variables are significant at p<0.05. |
The Pearson correlations (r) between the dependent variable and the explanatory variables for the overall population, females and males are given in table 3. In the overall population, all the four explanatory variables were significantly correlated with BH. The correlation between body height (YBH) and Lower Leg Length (XLLL), r=0.500 was better than that between YBH and trochanteric height (XLLLTROCH)r=0.454. The least significant correlation was observed in TL (r=0.253) in in the overall population.
| Table 3: Correlation coefficients between body height (Dependent variable) and lower extremities variables (Explanatory variables) in overall population, females and males. |
| Variables |
Overall population |
Females |
Males |
| N |
Pearson Correlation |
Sig.
(2-tailed) |
N |
Pearson Correlation |
Sig.
(2-tailed) |
N |
Pearson Correlation |
Sig.
(2-tailed) |
| TROCH |
198 |
454** |
.000 |
117 |
.328** |
.000 |
81 |
.515** |
.000 |
| TL |
198 |
.253** |
.000 |
117 |
.189* |
.041 |
81 |
.385** |
.000 |
| LL |
198 |
.365** |
.000 |
117 |
.092 |
.322 |
81 |
.427** |
.000 |
| LLL |
198 |
.500** |
.000 |
117 |
.507** |
.000 |
81 |
.296** |
.007 |
BH: Body Height, TROCH: Trochanteric height, TL: Thigh Length, LL: Leg Length, LLL: Lower Leg Length.
*. Correlation is significant at the 0.05 level (2-tailed).
**. Correlation is significant at the 0.01 level (2-tailed). |
The correlation between female’s body height (YFBH) and female’s lower leg length (XFLLL) i.e. r=0.507 was better than that between YFBH and females trochanteric height (XFTROCH), r=0.328; but the least significant correlation was observed in TL, r=0.189. LL in the females did not show any significant correlation with BH, as such LL could not be used to construct regression equations in the females. In the males, the correlation between males BH, (YMBH) and males trochanteric height (XMTROCH), r=0.515 was better than that between YMBH and males leg length (XMLL), r=0.481.
Table 4 shows the constant, regression coefficient and the variation explained of lower extremity variables with the BH in the overall population. Twenty-Five percent of the variation in BH is inherent by lower leg length (LLL) while the combination of LLL, LL, and TROCH contributed 33.4% to the variation in the dependent variable.
| Table 4: Constant, Regression coefficient and Variation explained (R2) of lower extremity variables with BH (dependent) variables in the overall population. |
|
Constant |
Regression Coefficient |
R2 |
p value |
| TROCH |
108.969 |
.651 |
.206 |
.000 |
| TL |
144.632 |
.530 |
.064 |
.000 |
| LL |
130.030 |
.805 |
.133 |
.000 |
| LLL |
118.569 |
1.138 |
.250 |
.000 |
| LLL
LL,
TROCH |
88.969 |
.265
.405
.833 |
.334 |
.015
.007
.000 |
| BH: Body Height; TROCH: Trochanteric height; TL: Thigh Length; LL: Leg Length; LLL: Lower Leg Length. |
The regression coefficients (see Table 5) for the variables used for BH prediction in the females and males were highly significant, indicating that they contributed positively for the prediction of BH in the females as well as in the males. The variation explained (R2 ×100) showed that it ranges from 3.6% to 25.76% in the females while it ranges from 8.7% to 31.6% in the males. The best prediction power was observed in LLL in female while it was the combination of TL and LL in the males.
| Table 5: Constant, Regression coefficient and Variation explained (R2) of lower extremity variables with BH (dependent) variables in females and males. |
| Variables |
Females |
Variables |
Males |
| Constant |
Regression Coefficient |
R2 |
p value |
Constant |
Regression Coefficient |
R2 |
p value |
| TROCH |
128.336 |
.393 |
.107 |
.000 |
TROCH |
114.567 |
.644 |
.265 |
.000 |
| TL |
148.858 |
.334 |
.036 |
.041 |
TL |
145.809 |
.642 |
.148 |
.000 |
| LLL |
119.239 |
.166 |
.257 |
.000 |
LL |
140.980 |
.680 |
.182 |
.000 |
|
|
|
|
|
LLL |
149.694 |
.540 |
.087 |
.007 |
|
|
|
|
|
LL,
TL |
115.859 |
.609
.652 |
316 |
.000
.000 |
| BH: Body Height; TROCH: Trochanteric height; TL: Thigh Length; LL: Leg Length; LLL: Lower Leg Length. |
|
The computed values of the multiple correlation coefficients R, of the coefficients of determinations R2 and R2 adjusted, and the standard errors of the estimates (SEE),17 of all possible and multiple linear regression equations for each of the variables were tested for the best model (Table 6 and 7). The multiple linear regression model was found to be the best model with the highest values for multiple correlation coefficient ‘R’ as 0.578, coefficient of determination R2 as 0.334 and R2 adjusted as 0.323 and with lower SEE as 7.518 in the overall population.
| Table 6: R, R2, Adjusted R2, and SEE in overall population in lower limb anthropometry. |
| Variables |
R |
R2 |
Adjusted R2 |
SEE |
| TROCH |
.454 |
.206 |
.202 |
8.165 |
| TL |
.253 |
.064 |
.059 |
8.864 |
| LL |
.365 |
.133 |
.129 |
8.532 |
| LLL |
.500 |
.250 |
.246 |
7.937 |
LLL,
LL,
TROCH |
.578 |
.334 |
.323 |
7.518 |
| BH: Body Height; TROCH: Trochanteric height; TL: Thigh Length; LL: Leg Length; LLL: Lower Leg Length; R: Multiple correlation coefficient; R2: Coefficients of determinations; SEE: Standard error estimate. |
| Table 7: R, R2, Adjusted R2, and SEE of lower extremities variables in females. |
| Females |
Males |
| Variables |
R |
R2 |
Adjusted R2 |
SEE |
Variables |
R |
R2 |
Adjusted R2 |
SEE |
| TROCH |
.328 |
.107 |
.100 |
7.380 |
TROCH |
.515 |
.265 |
.256 |
6.218 |
| TL |
.189 |
.036 |
.027 |
7.671 |
TL |
.385 |
.148 |
.137 |
6.695 |
| LLL |
.507 |
.257 |
.251 |
6.732 |
LL |
.427 |
.182 |
.172 |
6.559 |
|
|
|
|
|
LLL |
.296 |
.087 |
.076 |
6.929 |
|
|
|
|
|
LL,
TL |
.562 |
.316 |
.298 |
6.040 |
| BH: Body Height; TROCH: Trochanteric height; TL: Thigh Length; LL: Leg Length; LLL: Lower Leg Length. |
The multiple linear regression model was also found to be the best model to predict BH in the males (R=0.562), while single linear regression model performed better in the females (R=0.507) Considering all possible simple and multiple linear regression analysis, the best multiple linear equation to estimation BH from lower extremity dimensions in males is YMBH=115.859 +.609(LL)+.652(TL).
When the explanatory variables were considered one after the other, the best linear equation used to regress BH for the females is YFBH=119.239+.166(LLL), while that of the males is YMBH=114.567+.644(TROCH) however stature could also be estimated from any of the dismembered parts or sub-segments of the lower extremity using the formula constructed in the tables (Table 8).
| Table 8: Regression Equations for BH in the overall population, females and males lower extremity measurements. |
| Regression equation (overall population) |
±SEE |
Regression equation (overall population) |
±SEE |
Regression equation (overall population) |
±SEE |
| BH=108.969+.651(TROCH) |
8.165 |
BH=128.336+.393(TROHT) |
7.380 |
BH=114.567+.644(TROCHT) |
6.218 |
| BH=144.632+.530(TL) |
8.864 |
BH=148.858+.334(TL) |
7.671 |
BH=145.809+.642(TL) |
6.695 |
| BH=130.030+.805(LL) |
8.532 |
BH=119.239+.166(LLL) |
6.732 |
BH=140.980+.680(LL) |
6.559 |
| BH=118.569+1.138(LLL) |
7.937 |
BH=127.775+1.401(FL) |
7.443 |
BH=149.694 +.540(LLL) |
6.929 |
| BH=88.969+.265(LLL) +.405(LL) +.833(TROCH) |
7.518 |
|
|
BH=115.859 +.609(LL)+.652(TL) |
6.040 |
| BH: Body Height: TROCH: Trochanteric height; TL: Thigh Length; LL: Leg Length; LLL: Lower; SEE: Standard error of stimates. |
The mean predicted value of BH through the regression function was similar to the mean observed value; however the minimum and maximum value indicated that there were differences in the predicted and observed value (Table 9).
| Table 9: Minimum, Maximum, Mean and standard deviations of the predicted Values of BH by regression functions using the lower extremities parameters in overall population. |
| OBSERVED VALUE FOR BH |
Minimum |
Maximum |
Mean |
Std. Deviation |
N |
| 149.00 |
190.00 |
167.5460 |
9.1027 |
211 |
| PREDICTED VALUE |
TROCH |
145.3409 |
178.5899 |
167.4859 |
4.14785 |
198 |
| TL |
162.1269 |
175.9106 |
167.4859 |
2.31359 |
198 |
| LL |
156.5823 |
175.0888 |
167.4859 |
3.33295 |
198 |
| LLL |
153.8482 |
183.4376 |
167.4859 |
4.56587 |
198 |
LLL,
LL,
TROCH |
146.7266 |
183.3746 |
167.4859 |
5.27892 |
198 |
| BH: Body Height; TROCH: Trochanteric height; TL: Thigh Length; LL: Leg Length; LLL: Lower; Std: Standard deviation. |
The mean predicted value of BH through the regression function was similar to the mean observed value; however the minimum and maximum value indicated that there were differences in the predicted and observed value; the minimum predicted value overestimates the minimum observed value and in both sexes while the maximum predicted value underestimates the maximum observed value in both sexes except the maximum predicted value from LL (Tables 10 and 11).
| Table 10: Minimum, Maximum, Mean and standard deviations of the predicted Values of BH by regression functions with lower extremity variables in females. |
|
OBSERVED VALUE FOR BH
|
Min |
Max |
Mean |
SD |
N |
| 149 |
190 |
163.172 |
7.643 |
123
|
|
PREDICTED VALUE
|
TROCH |
150.314 |
169.225 |
163.189 |
2.549 |
117
|
|
TL
|
160.555 |
167.239 |
163.189 |
1.470 |
117 |
| LLL |
151.680 |
172.609 |
163.189 |
3.946 |
117
|
| Table 11: Minimum, Maximum, Mean and standard deviations of the predicted Values of BH by regression functions with lower extremity variables in males. |
|
OBSERVED VALUE FOR BH
|
Min |
Max |
Mean |
SD |
N |
| 156.00 |
190.00 |
173.660 |
7.296 |
88
|
|
PREDICTED VALUE
|
TROCH
|
160.300 |
183.488 |
173.693 |
3.7115 |
81
|
|
TL
|
166.992 |
183.682 |
173.693 |
2.774 |
81 |
| LL |
165.466 |
179.069 |
173.693 |
3.079 |
81
|
|
LLL
|
168.069 |
180.499 |
173.693 |
2.132 |
81 |
LL,
TL |
163.142 |
187.024 |
173.693 |
4.049 |
81
|
DISCUSSION
Four lower extremity measurements including BH of the subjects were taken. The prediction function was derived through linear regression and multiple regressions for each of the measurement with BH, for the general population and for the males and females separately.
In sexing the lower extremity parameters, all the variables were highly significant (p<0.0001) except TL. These values were higher in the males than in the females. This agrees with the popular phenomena that most anthropometric variables are significantly higher in the males than in the females.15,18,19,20,21,22,23,24,25
In this study, the value of coefficient of determination R2 for the multiple linear regression equations with BH as the dependent variable and LLL, LL and TROCH as explanatory variables in overall population was 0.334. The value of R2 with BH as the dependent variable and LL and TL as explanatory variables in males was 0.316. This means that 33.4% of the total variation in BH is explained by the explanatory variables LLL, LL and TROCH put together in the in overall population, while 32% of the total variation in BH is explained by the explanatory variables LL and TL in males. The values of multiple correlation coefficient R for the multiple linear regression equations for the overall population and males were 0.578 and 0.562 respectively, while the SEE were 7.518 and 6.040 respectively. This means that the multiple linear regression models for the overall population as well as for the males fits very well to the observed value (compare tables 6, 7, 8 with 9, 10 and 11) unlike the linear regression models.
he findings above are not congruent with the report by Ozaslan A, et al13, who carried out similar work by measuring seven lower extremity variables on adult Turks (203 males and 108 females). Five (TROCH, LL, TL, Foot length, and Foot height) out of the seven variables were significantly correlated with stature. The highest value of coefficient of determination R2 was associated with TROCH (58%) and LL (56%) in the males while in females it was LLL (65%) and LL (63%).
The R, R2 ,Adjusted R2 and SEE obtained in this study were lower than that obtained by.6,13 This means that the error arising from the predicted BH is minimal in the present study.
Using a Polish sample, Hauser R, et al8 were able to determine that the longest measurement of femur was the most useful for correlating with living height, atleast in males. Similarly26 reported that the femur was the most useful for estimating stature in a sample of adult Portuguese while27 indicated that the femur and tibia were the best predictors of stature in a Mesoamerican population. This is at variance with the result of this study because in the overall population the combination of TROCH, TL and LLL performed better than any of the independent lower extremity segments; this also applies to the males using LL and TL. However the independent/explanatory variables that ranks first in the prediction of BH in our study was LLL in the overall population as well as in the females while TROCH performed better than the rest of the other lower extremity segment for prediction of BH in the males.
CONCLUSION
The multiple regression model generated using LLL, LL and TROCH put together provided the best/highest accuracy of determination in the overall population while LL and TL gave that of the males.
CONFLICTS OF INTEREST: None.


