INTRODUCTION
Since ancient times, fasting has been performed for religious reasons or as a cure of illnesses. Dr. Takahira1 was at the vanguard of fasting therapy in 1910-1920. He studied precisely the metabolic changes caused by fasting, and reviewed the efficacy of fasting therapy in various disease states. Cahill2 studied metabolic changes during 40 days of starvation and found that β-hydroxy butyrate (BHB) replaces glucose as a source of energy.
Koda’s method is the combination of a low-energy dietary therapy, vegetarian diet, fasting, and physical exercise to stimulate the self-healing capacity.3,4 Using this regimen, Mitsuo Koda had recovered himself from chronic hepatic failure and gastro-intestinal tract weakness, and he could also confirm beneficial effects for many patients with intractable diseases.4 Unpolished brown rice and green vegetable paste constitute the basic regimen of Koda’s therapy, as it improves the intestinal environment by resolving constipation. Koda’s method could maintain the balance of the autonomic nervous system, so it might not only be effective for gastro-intestinal conditions, but also for some neurodegenerative diseases.4
This case study basically deals with a women patient (M) who had suffered spinocerebellar degeneration at a young age and recovered by using Koda’s method. She had been living on only one glass of fresh vegetable juice per day for 19 years since her acute episode at age 20. Four other persons who were experimenting Koda’s method were asked to join the study for comparison. These five participants were studied with a special focus on their energy balance, metabolic state, and intestinal microflora.
The study protocol was approved by the ethical committee of the Life Science Promoting Association (No. H24-1).
MATERIALS AND METHODS
Subjects Past History and Dietary Analysis
Past history, daily lifestyle, and dietary data were obtained by interviews at the Mori Clinic. Three-days dietary records were confirmed by a registered dietitian, and the intake of nutrients was calculated by using the Functional Food Factors (FFF) database.5
M (case 1) was a vivid woman. All five participants looked well, but B (case 2) and S (case were lean, owing to their breast cancer and gastric cancer, respectively. Confined to a wheelchair, W (Case 3) was alert, and displayed well-developed upper extremities. H (case 5) was a vivid, Muscular Professor. Summary case reports are described below for each patient.
Case 1: M
This 50 years-old, vivid and healthy-looking woman was born in December 25, 1962. She suffered spino-cerebellar degeneration at age twenty.6 She could not keep her posture, so she could not walk but instead crawled on the ground. After diagnosis, her doctor predicted that she would probably not survive more than 5-years. She tried many treatments in despair. Finally she visited Koda’s clinic, where fasting therapy was prescribed. She twice tried one-month fasting courses, and her neurodegenerative symptoms miraculously disappeared. Put on regular Koda’s diet composed of brown rice and vegetables, she saw her disease relapse. She thus finally decided to live on one glass of fresh green-yellow vegetable smoothy paste per day. For her last 7 years of life, she was only taking filtered vegetable juice, adding 10 tablets each of Ebios (fermented beer remnant)7 and Spiren (chlorella supplement)8 and 1 g vitamin C tablet. Her vegetable juice was a mixture of grinded and filtered green vegetable soup, composed of 30 g kale, 20 g radish leaves, 20 g komatsuna (saltgreen), 20 g chingen-sai, 20 g carrot leaves, 20 g sunny lettuce, 20 g kikuna (garland chrysanthemum), and 20 g yukina (winter saltgreen). In addition, she drank 500 ml of water and up to 4-5 cups of persimmon-leave tea ad libitum when feeling thirsty.9
She usually went to bed at 0:00 and got up 3:00 am. She used to work hard at her acupuncture clinic during daytime. She was often asked to lecture outside, and travelled to many places. She had no other complaint about her health. Her height was 154.4 cm and body weight 57.7 kg.
Case 2: B
This 60 years-old lean female patient was born in July 23, 1963. Her height was 152.6 cm and her body weight was 38.2 kg. She suffered allergy and gastro-intestinal tract problems in childhood. At age 19, she received a tonsillectomy. At age 33, an ovarian cyst was removed surgically. At age 35 she was hospitalized in Koda’s clinic for her gastro-intestinal tract weakness, and fasting therapy was prescribed with clear soup for 2 weeks. At that time her body weight was 48 kg, but she preferred to eat sweet foods, so after discharge her body weight rebounded to 55 kg. At age 58, after a health check-up, a left breast cancer was detected and resected. In November 2011, she started again Koda’s raw vegetable diet. She has been taking daily sui-mag (di-hydroxy magnesium solution 100 mg/dl) at 6.30 am, Koda’s diet (red vegetable soup with 5 g salt) at 12:00, 100 g brown rice powder with 30 g honey, 200 ml green vegetable soup, 300 g soy bean curd with 1ml soy sauce, and 10 ml of kabosu (citrus) juice at 19:00. Her body temperature was slightly low at 35.8, but her physical examination was otherwise normal.
Case 3: W
This 36 years-old male patient was born on September 26, 1976. He appeared on a wheelchair. At age 26, after a motorcycle accident, he had a fractured thoracic vertebra with paraplegia below the chest. His lower extremities showed marked muscular atrophy and his body weight was 37.8 kg, despite a height of 170.5 cm. Believing that Koda’s therapy might cure the paralysis, he practiced Koda’s vegetarian diet for 10 years in addition to rehabilitation. He needed manual removal of 100- 150 g feces twice a day, and when bowel movements were absent, he drunk a cup of sui-mag. He took two glasses of red and green vegetable juice daily, 10 tablets each of ebios and spiren at 12:00, red and green vegetable juice, 300 g tofu with 1 ml shoyu, 120-150 g brown rice powder with 30 g honey, and 10 g salt occasionally.
Case 4: S
This 55 years-old male patient was born on April 3, 1958. He was a short-track athlete at high school. His optimal weight was 60 kg, but it increased to 80 kg at age 45 during work at a computer company, where he gradually developed hypertension. At age 54, a stage-3c carcinoma of the gastric cardia was detected by endoscopy, and a Billroth-II gastrectomy was performed. One month after the operation he started Koda’s raw vegetable diet. Two months later he had edema due to low proteinemia, so fish was added to the diet. Three months ago, a metastasis in Virchow’s lymph node was found, but he refused chemotherapy and continued acupuncture and dietary therapy. He took daily two glasses of red and green vegetable juice, 10 tablets of each ebios and spiren at 12:00, and 300 g tofu with 1 ml shoyu and 120-150 g brown rice powder with 30 g honey were added to the above two juice at 18:00 p.m. Two small cups of Sui-mag was added at 20:00 p.m.
Case 5: H
This 71-years old muscular man was born on August 31, 1942. He had been a long-distance runner at university. After graduation he started body building and became a champion. He used to eat a lot of meat to develop his muscles, but he became easily fatigued. He started Koda’s raw vegetable diet after hearing Koda’s lecture, and participated in the 1985-1986 clinical study on the effects of complete raw vegetable diet. He felt that the diet changed his body and his physical performance increased. He suffered retinal detachment in his left eye in 2000, so he returned to Koda’s raw vegetable diet. He was fine to the point of being able to go for skiing with students. He lived on Koda’s vegetarian diet at least twice a day, but he liked fruits at breakfast, with a large bowel of raw vegetable salad and two cooked dishes for lunch and dinner. He took occasional sweets as a snack with black coffee. He preferred Japanese burdock noodle occasionally. He regularly passed 200-300 g stools daily.
Energy Expenditure
Measurements of basal metabolic rate (BMR) were conducted as previously described.10 The subjects came to the clinic in the early morning and were asked to minimize walking prior to the BMR measurement. BMR was measured in the post-absorptive stage at least 12 hours after the last meal. Measurements were performed in a room at a constant temperature of approximately 25 °C. After entering the clinic, the subjects rested in the supine position wearing a face mask for at least 30 minutes. The samples of expired air were collected in Douglas bags over two 10-minutes periods, and the mean of the two values was used for the analyses.
The expired O2 and CO2 concentrations were measured using a gas analyzer (Arco System, AR-1, Kashiwa, Japan) with a galvanic O2 sensor and an infrared CO2 sensor. Prior to each of the consecutive measurements, the gas analyzer was calibrated using atmospheric air. The volume of expired air was determined using a dry gas volume meter (Shinagawa, DC-5, Tokyo, Japan) and then converted to the volume under conditions of standard temperature, pressure, and dry gas. BMR (kcal/day) was calculated using Weir’s equation.11
Laboratory Tests
Venous blood samples were collected after a fast of at least 12 hours for measurement of blood biochemistry. The following blood parameters were analyzed in the Serum Research Laboratories, Tokyo.12
Whole blood was used for Hemoglobin (Hb), Red Blood Cell (RBC) count, White Blood Cell (WBC) count, Hematocrit (HT), Mean Corpuscular Volume (MCV), Mean Corpuscular Hemoglobin (MCH), Mean Corpuscular Hemoglobin Concentration (MCHC), platelet count, and blood morphology, such as STAB, SEG, EOSIN, BASO, MONO, LYMPH (T/B).
As nutritional markers, Total Protein (TP), Albumin (Alb), Triacylglycerol (TG), Total Cholesterol (T-Cho), Free Cholesterol (F-Cho), Low-Density Lipoprotein-cholesterol (LDL-cholesterol), Malondialdehyde-modified low density lipoprotein (MDA-LDL), Oxidized low-density lipoprotein (OxLDL), High-Density Lipoprotein-cholesterol (HDL-cholesterol) were measured. In addition, the following vitamins and minerals were quantitatively measured: vitamin A, vitamin B1, vitamin B2 , vitamin B6 , pyridoxan, pyridoxal, pyridoxin, vitamin B12, folic acid, vitamin C, 25-OH vitamin D, 25-(OH)2 vitamin D, and vitamin E, and Ca, P, Na, K, Cl, Mg, Fe, Unsaturated Iron Binding Capacity (UIBC).
To assess the liver function, Total Bilirubin (T-Bil), bilirubin (direct and indirect), Asparagic acid aminotransferase (AST)), Alanine aminotransferase (ALT), Lactate Dehydrogenase (LD), Alkaline phosphatase (ALP), Leucine Amino Peptidase (LAP), Alanine aminotransferase (γ-GTP), Choline esterase (ChE) were measured.
As metabolic markers of muscle, pancreas and kidney, Amylase (AMY), Creatine Kinase (CK) or Creatine Phosphokinase (CPK), blood Urea Nitrogen (UN), creatinin, Uric Acid (UA) were measured. HbA1c and fasting blood glucose were also ordered, but failed by clotting during transportation to the laboratory.
As a special nutritional reference, ketones in the venous blood, such as acetoacetic acid, 3-hydroxy butyric acid, acetone and total ketone bodies were quantitatively measured. Ordinary and highly-sensitive CRP tests were performed as markers of inflammation. In addition, Leptin, Adiponectin (LA), resistin, and 39 serum amino acids profiles were determined.
Intestinal Bacteria
Fresh feces were collected in separate sterile feces containers (Sarstdt, Germany) containing 2 ml of RNA later (Ambion, Inc., USA) and were stored at room temperature. The samples were stored at 4 °C until using for extraction of fecal DNA. DNA was extracted from stool samples by using the bead-bearing method as previously described by Matsuki, et al.13 The V6-V8 region of the bacterial 16S rRNA gene was PCR amplified using the barcode-tag universal primer sets Q-968F- #(5’-CWSWSWWSHTWACGCGARGAACCTTACC-3’) and Q-1390R-#(5’CWSWSWWSHTTGAGGGCGGATGWGT AC-3’) (where # indicates a series of 128 barcode sequence tags underlined in the sequence). The PCR and pyrosequencing were performed as described by Nakayama, et al.14
All sequences were examined for possible chimeric artifacts by the CHECK CHIMERA program of the Ribosomal Database Project (RDP).15 Sequence data were aligned with the CLUSTAL W package and corrected by manual inspection. The results were summarized at Phylum level (Firmicutes, Bacteroidetes, Actinibacteria, Proteobacteria, Fusobacteria, Verrucomicrobia, Cyanobacteria, Lentisphaerae, and Tenericutes) and at family level (Bifidobacteriaceae, Bateroidaceae, Porphyromonadaceae, Prevotellaceae, Streptococcaceae, Clostridiaceae, Lachnospiraceae, Ruminococcaceae, Violonellaceae, Fusobacteriaceae, Enterobacteriaceae, Verrucomicrobiaceae, and others such as bacteroidales).
RESULTS
Demographic Data of Subjects and Total Energy Expenditure
Demographic data of participants are summarized in Table 1. Their Body Mass Index (BMI) was low except for M. In the case of W, severe muscular atrophy of the lower extremities contributed to the loss of body weight. Blood pressure and body temperature also tended to be within the lower range.
Table 1: Demographic data of the participants.
|
Name
|
M |
B |
W |
S |
H
|
|
age yrs.
|
52 |
61 |
38 |
56 |
72 |
| Sex |
female |
female |
male |
male |
male
|
|
height (cm)
|
154.4
|
152.6 |
170.5 |
172.8 |
157.8
|
|
body weight (kg)
|
57.7
|
38.2 |
37.8 |
51.5 |
50.8
|
|
BMI
|
24.2
|
16.4 |
13 |
17.2 |
20.4
|
|
blood pressure (systolic/diastolic)
|
95/72
|
105/65 |
82/55 |
95/65 |
105/70
|
|
body temperature
|
36.5
|
35.7 |
36 |
35.7 |
36.2
|
|
Total Energy Expenditure/day
|
1092/1228
|
1287 |
974 |
935 |
1130
|
The basal metabolic rate (BMR) was 1000-1200 kcal/ day. In the case of M, the morning measurement was 1092 kcal/ day and the evening measurement was 1228 kcal/day. As Total Energy Expenditure (TEE) could be estimated BMR * 1.5, TEE would be around 1500 kcal/day.10
Nutrient Intake from Koda’s Diet
Koda’s diet provides about 1000 kcal energy source per day from brown rice, vegetable juice and tofu. There are two different juices: one is pure green yellow vegetable leaves (green juice), and the other contains vegetable roots, such as carrot, radish, lotus and taro (red juice).16
M took only green juice for nearly 19 years with supportive vitamin C tablets and ebios (fermented beer remnant).7 She took only 68 kcal/day from juice, and it became 122 kcal/ day including supplements. H took soba noodles and occasionally pancakes with sweet red beans (dorayaki) because he liked sweet taste. The total calorie intakes of B, W, S, and H were 1065, 1084, 1084, and 1674, respectively. It was about two third in 3 subjects and in Case of M it was about 1/15 of necessary energy intake. Protein intakes were in the range of 40-50 g/day, fat 18-23 g/day, carbohydrate 170-190 g/day, except for M (Table 2). Vitamin and mineral intakes fulfilled the Japanese Dietary Reference Intakes (DRI) 2010.17 There was no cholesterol, vitamin B12 and vitamin D intake. Dietary fiber intake was more than 20 g. Fat intake was also low, less than 20 g, and in case of M it was almost none. In her case, many nutrients were less than one tenth of average. Dietary fiber intake was only 5.6 g/ day, although plant-derived vitamins and minerals were closer to normal.
Table 2: Dietary intake by Koda’s diet.
Sat: saturated, FA:\fatty acid, *na: not applicable, provider’s data.
|
Name
|
M |
B |
W |
S |
H
|
|
Diet
|
veg_juice |
supplument* |
KodaB |
KodaB |
KodaA |
KodaB+snack |
| Duration |
19 yrs |
|
3 yrs
|
10 yrs
|
1 yr
|
10 yrs
|
|
Energy
|
44
|
77.4
|
1084
|
1084
|
1065
|
1674
|
|
Protein
|
5
|
14.9
|
49 |
49 |
41 |
65 |
| Fat |
1 |
2.3 |
23 |
23 |
18 |
27
|
| Carbohydrate |
7.3
|
0.03
|
174.1 |
174.1 |
189.0 |
294 |
| Water soluble DF |
0.83 |
na |
5.31 |
5.31 |
5.14 |
5.31
|
|
Insoluble DF
|
4.15
|
na
|
15.67 |
15.67 |
15.14 |
15.67 |
| All dietary fiber |
5.64 |
7.7 |
22.3 |
22.3 |
21.6 |
30.2
|
|
Ash
|
2.4
|
na
|
21.1 |
21.1 |
25.2 |
21 |
| Na |
34 |
na |
4085 |
4085 |
6024 |
4085
|
|
K
|
735
|
41.3
|
3145 |
3145 |
2991 |
3499 |
| Ca |
320 |
4 |
938 |
938 |
819 |
990
|
|
Mg
|
43
|
na
|
401 |
401 |
360 |
401 |
| P |
84 |
na |
1121 |
1121 |
938 |
1121
|
|
Fe
|
39
|
0.1
|
12.3 |
12.3 |
11.4 |
15.0 |
| Zn |
0.7 |
na |
7.1 |
7.1 |
6.4 |
7.1
|
|
Cu
|
0.1
|
na
|
1.4 |
1.4 |
1.2 |
1.4 |
| Mn |
0.7 |
na |
5.8 |
5.8 |
5.2 |
5.8
|
| I |
0.9 |
na
|
28.8 |
28.8 |
23.9 |
28.8 |
| Se |
1.8 |
na |
25.7 |
25.7 |
21.5 |
25.7
|
| Cr |
1.2
|
na
|
9.2 |
9.2 |
7.5 |
9.2 |
| Mo |
16.5 |
na |
291.9 |
291.9 |
244.5 |
291.9
|
| cryptoxanthin |
12.3
|
na
|
13.08 |
13.08 |
13.08 |
13.08 |
| βcarotene_eq |
5200 |
5830 |
23405 |
23405 |
23405 |
23405.0
|
| αtocopherao |
3.10
|
na
|
7.01 |
7.01 |
6.69 |
7.006 |
| βtocopherol |
0.02 |
na |
0.58 |
0.58 |
0.47 |
0.58
|
| γtocopherol |
0.39
|
na
|
12.95 |
12.95 |
9.84 |
12.95 |
| vitamin K |
4339 |
na |
8363 |
8363 |
8350 |
8363
|
|
vitamin B1
|
0.2
|
3.24
|
1.3 |
1.3 |
1.2 |
1.5 |
| vitamin B2 |
0.3 |
5.2 |
0.6 |
0.6 |
0.6 |
0.8
|
|
niacin eq.
|
1.9
|
na
|
24.6 |
24.6 |
22.2 |
24.6 |
| vitamin B6 |
0.3 |
0.4 |
1.6 |
1.6 |
1.5 |
1.6
|
|
vitamin B12
|
0
|
52
|
0 |
0 |
0 |
0 |
| Folic acid |
201.8 |
na |
439.6 |
439.6 |
425.2 |
439.6
|
|
Pantothenic acid
|
0.6
|
na
|
4.5 |
4.5 |
4.3 |
4.5 |
| Biotin |
2.5 |
na |
29.6 |
29.6 |
25.3 |
29.6
|
|
vitamin C
|
90.3
|
na
|
134.3 |
134.3 |
135.2 |
134.3 |
| sat. fatty acid |
0.023 |
na |
4.02 |
4.02 |
3.22 |
4.02
|
|
monosat. FA
|
0.005
|
na
|
4.68 |
4.68 |
3.76 |
4.68 |
| polysat. FA |
0.067 |
na |
10.06 |
10.06 |
7.86 |
10.06
|
Blood and Biochemistry
Biochemical data are summarized in Table 3. Total protein, albumin and High-Density Lipoprotein (HDL) cholesterol were normal in all subjects. The total cholesterol level was rather high, except for W. TG was low in all, but remained within normal range.
Table 3: Biochemical data of participants.
na: not applicable.
|
Name
|
reference range |
unit |
unit |
M
|
B |
W |
S |
H
|
|
TP
|
6.7-8.3 |
g/dL |
|
8.4
|
8.1
|
7.3 |
7 |
7.2
|
|
Alb
|
3.8-5.2 |
g/dL |
|
5.1
|
4.4
|
4.6 |
3.8 |
4.2
|
|
TG
|
50-149 |
mg/dL |
|
6.1
|
80 |
73 |
54 |
79 |
|
T-Cho
|
150-219 |
mg/dL |
|
183
|
264
|
140 |
199 |
256
|
|
F-Cho
|
30-60 |
mg/dL |
|
46 |
68 |
36 |
57 |
62 |
| LDL-chol |
70-139 |
mg/dL |
|
101
|
134
|
65 |
105 |
192
|
|
MDA-LDL
|
|
U/L |
|
115 |
na |
75 |
97 |
182 |
| HDL-chol |
M 40-86 |
F 40-96 |
mg/dL |
59
|
98
|
54 |
81 |
56
|
|
T-Bil
|
0.3-1.2 |
mg/dL |
|
0.8 |
0.4 |
0.4 |
0.4 |
0.7 |
| direct bil |
<0.4 |
mg/dL |
|
0.2
|
0.1
|
0.1 |
0.1 |
0.2
|
|
indirect bil
|
<0.8 |
mg/dL |
|
0.6 |
0.3 |
0.3 |
0.3 |
0.5 |
| AST (GOT) |
10-40 |
U/L |
|
48
|
69
|
33 |
117 |
25
|
|
ALT (GPT)
|
5-40 |
U/L |
|
23 |
72 |
70 |
93 |
24 |
| LD (LDH) |
115-245 |
U/L |
|
258
|
335
|
138 |
302 |
210
|
|
ALP
|
115-359 |
U/L |
|
270 |
346 |
772 |
367 |
166 |
| LAP |
35-73 |
U/L |
|
61
|
77
|
63 |
82 |
52
|
|
γ-GTP
|
M <70 |
F <30 |
U/L |
25 |
38 |
12 |
76 |
19 |
| ChE |
M 242-495 |
F 200-459 |
U/L |
327
|
323
|
322 |
189 |
422
|
|
AMY
|
37-125 |
U/L |
|
78 |
71 |
99 |
90 |
102 |
| CK (CPK) |
M 62-287 |
F 45-163 |
U/L |
1212
|
67
|
122 |
68 |
171
|
|
UN (BUN)
|
8.0-22.0 |
mg/dL |
|
10.4 |
12.3 |
14.8 |
11.4 |
15 |
| creatinine |
M 0.61-1.04 |
F 0.47-0.79 |
mg/dL |
0.53
|
0.38
|
0.27 |
0.7 |
0.8
|
|
UA
|
M 3.7-7.0 |
F 2.5-7.0 |
mg/dL |
4.6 |
3.2 |
3.7 |
4.1
|
7.4 |
| Ketone bodies (venous blood) |
|
acetoacetate
|
<55 |
μmol/L |
635 |
7 |
11 |
8 |
69 |
| 3-hydroxy butyrate |
<85 |
μmol/L
|
3136
|
33 |
32 |
19 |
207
|
|
total ketone bodies
|
<130 |
μmol/L |
3771 |
40 |
43 |
27 |
276 |
| CRP |
<0.30 |
mg/dL |
0.05
|
0.06
|
0.02
|
0.45
|
0.05
|
|
high sensitive CRP
|
|
ng/mL |
na |
na |
85 |
3840 |
287 |
| leptin |
|
ng/mL |
3.7
|
na
|
1.5 |
1.8 |
4.5
|
|
adiponectin (LA)
|
>4.0 |
μg/mL |
9 |
na |
18.6 |
14.6 |
9.1 |
| resistin |
|
ng/mL |
7.1
|
na
|
3.9 |
4 |
9
|
Liver enzymes concentrations, such as aminotransferases (AST), ALT, LD and ALP were high in all, except H. Creatine Kinase (CK) was extremely high in M, in whom ketone bodies were remarkably high. The β-hydroxy butyrate/aceto-acetate ratio was 4.9. H also showed high concentrations of ketone bodies, with a ratio of 3.0, but liver function tests showed normal values. Both continued Koda’s diet for more than 10 years.
UN was within normal range, and creatinine was low in Band W. CRP was only elevated in S with cancer. Leptin, adiponectin and resistin were within the normal range.
Amino-acid profiles showed elevated aspartic acid, especially in M and H who showed hyperketonemia (Table 4). In M, α-aminobutyric acid, Branched-Chain Amino Acids (BCAA) and Fisher ratio were high. By contrast, asparagine was low in all. Essential Amino Acids (EAA) and BCAA were low in B. Other amino-acids did not show notable deviations from normal.
Table 4: Plasma free amino acid profile of participants.
|
Amino acid/ name
|
M |
B |
W |
S |
H |
standard
|
|
Taurine
|
60.7 |
75.3 |
81.7 |
82.6 |
278.6 |
39.5-93.2 |
|
Aspartic acid
|
16.4 |
2.9 |
2.6 |
5.4 |
8.7 |
<2.4 |
| Hydroxyproline |
tr |
tr |
tr |
14.6
|
tr
|
<21.6
|
|
Threonine
|
88.8 |
84.7 |
124.8 |
80.2 |
129.8 |
66.5-188.9 |
| Serine |
141.6 |
91 |
131.4 |
97.4
|
105
|
72.4-164.5
|
|
Asparagine
|
44.7 |
39.5 |
43.1 |
43 |
50 |
44.7-96.8 |
| glutamic acid |
43.6 |
22.5 |
21.2 |
25.5
|
55.2
|
12.6-62.5
|
|
Glutamine
|
493.7 |
564.3 |
537.7 |
522.9 |
516.2 |
422.1-703.8 |
| Sarcosine |
nd |
nd |
nd |
nd
|
nd
|
tr
|
|
a-aminoadipic acid
|
tr |
nd |
nd |
nd |
nd |
nd |
| proline |
114 |
144.1 |
89.2 |
97.5
|
162.3
|
77.8-272.7
|
|
glycine
|
278.6 |
205.5 |
198 |
227.8 |
212.3 |
151-351 |
| alanine |
283.9 |
345.2 |
25.3 |
299.2
|
284
|
208.7-522.7
|
|
ctrulline
|
21.2 |
22.6 |
19.2 |
27.2 |
32.5 |
17.1-42.6 |
| a-aminobutyric acid |
44.4 |
8 |
9.5 |
7.5
|
23
|
7.9-26.6
|
|
valine
|
270.3 |
138.1 |
142.4 |
143.8 |
238.8 |
147.8-307 |
| cystine |
19.4 |
9.8 |
11.1 |
20.8
|
25.5
|
13.7-28.3
|
|
cystathionine
|
nd |
nd |
nd |
nd |
nd |
tr |
| methione |
24.3 |
14.5 |
234 |
17.6
|
21.7
|
18.9-40.5
|
|
isoleucine
|
121.5 |
33.2 |
40.9 |
50.3 |
72.2 |
43-122.8 |
| leucine |
189.1 |
69.2 |
79 |
93.9
|
129.4
|
76.6-171.3
|
|
tyrosine
|
53.7 |
41.7 |
43 |
57 |
57.2 |
40.4-90.3 |
| phenylalanine |
66.5 |
33 |
32.6 |
48
|
56.5
|
42.6-75.7
|
|
g-amino-b-hydroxybutyric acid
|
nd |
nd |
nd |
nd |
nd |
nd |
| b-alanine |
3.3 |
3.6 |
3 |
3.4
|
4.5
|
tr
|
|
b-amino-isobutyric acid
|
nd |
nd |
tr |
tr |
tr |
tr |
| g-aminobytyric acid |
nd |
nd |
nd |
nd
|
nd
|
nd
|
|
monoethanolamine
|
8.8 |
tr |
tr |
tr |
6.2 |
<10.4 |
| homocystine |
nd |
nd |
nd |
nd
|
nd
|
nd
|
|
histidine
|
62 |
58.1 |
68.9 |
58.2 |
67.1 |
59-92 |
| 3-methylhistidine |
tr |
tr |
nd |
tr
|
tr
|
<5
|
|
a-methylhistidine
|
nd |
nd |
nd |
nd |
nd |
<18.5 |
| carnosine |
nd |
nd |
nd |
nd
|
nd
|
nd
|
|
asserine
|
nd |
nd |
nd |
nd |
nd |
nd |
| tyryptophan |
39.6 |
42.5 |
41.4 |
42.3
|
46.4
|
37-74.9
|
|
hydroxylysine
|
nd |
nd |
nd |
nd |
nd |
nd |
| ornithine |
39.3 |
54.4 |
53.8 |
52
|
69.7
|
31.3-104.7
|
|
lysine
|
115.8 |
139.3 |
151.2 |
132.7 |
150.6 |
108.7-242.2 |
| arginine |
88.6 |
87.3 |
53.3 |
88.3
|
73
|
53.6-133.6
|
|
total AA
|
2677.3 |
2318.7 |
2240.8 |
2313.6 |
2842.6 |
2068.2-3510.3 |
| NEAA |
1699.4 |
1706.1 |
1535.6 |
1646.6
|
1930.1
|
1381.6-2379.4
|
|
EAA
|
977.9 |
612.6 |
705.2 |
667 |
912.5 |
660-1222.3 |
| BCAA |
580.9 |
240.5 |
262.3 |
288
|
440.4
|
265.8-579.1
|
|
EAA/NEAA
|
0.58 |
0.36 |
0.46 |
0.41 |
0.47 |
0.4-0.63 |
| BCAA/Total AA |
0.22 |
0.1 |
0.12 |
0.12
|
0.15
|
0.11-0.18
|
|
Fisher ratio
|
4.83 |
3.22 |
3.47 |
2.74
|
3.87
|
2.43-4.4
|
Vitamins and minerals were well provided by the brown rice or brown rice powder, except for vitamin A, 25-OH vitamin D. As for the vitamins, all showed high folic acid concentrations, and in H 25-(OH)2 vitamin D and vitamin E were high. As for mineral intake, K and Mg tended to be high. Ca was low in 2 out of 5. In M iron was low and UIBC was high. (Table 5)
Table 5: Serum vitamins and minerals of the participants.
|
Name
|
Reference |
|
M |
B |
W |
S |
H
|
|
vitamin A
|
97-316 |
IU/dL |
|
59 |
131 |
76 |
84 |
182 |
| vitamin B1 |
24-66 |
ng/mL |
|
27 |
32 |
34
|
31
|
46
|
|
vitamin B2
|
66.1-111.4 |
ng/mL |
|
84.5 |
54.4 |
68.3 |
61.5 |
78.7 |
| vitamin B6 |
|
|
|
|
|
|
|
|
|
Pyridoxamine
|
M<0.6 |
F<0.6 |
ng/mL |
|
0.2 |
0.2 |
0.2 |
0.2 |
| Pyridoxal |
M 6.0-40.0 |
F<4.0-19.0 |
ng/mL |
|
9.4
|
5.9
|
4.7 |
9.3
|
|
Pyridoxin
|
M<3.0 |
F<3.0 |
ng/mL |
|
3 |
3 |
3 |
3 |
| vitamin B12 |
180-914 |
pg/Ml |
|
879 |
205
|
296
|
333 |
407
|
|
Folic acid
|
>4.0 |
ng/mL |
|
22 |
21.7 |
17.8 |
12.9 |
19.8 |
| vitamin C |
5.5-16.8 |
μg/mL |
|
15 |
10.4
|
8.9
|
12.9 |
11.8
|
|
25-Oh vitamin D
|
7-41 |
ng/mL |
|
5 |
5 |
5 |
5 |
26 |
| 25-(OH)2 vitamin D |
20.0-60.0 |
pg/mL |
|
42.8 |
26.4
|
9.8
|
11.1 |
66.2
|
|
vitamin E
|
0.75-1.41 |
mg/dL |
|
0.76 |
nd |
0.53 |
1.16 |
1.42 |
| Ca |
8.5-10.2 |
mg/dL |
|
9.1 |
9.2
|
7.8
|
9 |
8.3
|
|
P
|
2.4-4.3 |
mg/dL |
|
4.1 |
3.2 |
3.6 |
3.8 |
3.4 |
| Na |
136-147 |
mEQ/L |
|
136 |
140
|
139
|
141 |
142
|
|
K
|
3.6-5.0 |
mEQ/L |
|
5.8 |
4.8 |
4 |
4.9 |
6.2 |
| Cl |
98-109 |
mEQ/L |
|
105 |
109
|
106
|
108 |
104
|
|
Mg
|
1.8-2.6 |
mg/dL |
|
2.6 |
2.8 |
2.5 |
2.9 |
2.1 |
| Fe |
M 54-200 |
F 48-154 |
μg/dL |
52
|
86
|
72
|
59 |
54
|
|
UIBC
|
M 104-259 |
F108-325 μ |
μg/dL |
436 |
245
|
248
|
231 |
209
|
As for the blood features, all subjects were within the normal range, except for S who had low Hb (9.5 g/dl) due to metastatic gastric cancer. The RBC count was more than 0.4 bil/l in all, and the WBC count was elevated to 8400/μl in M, but others were around 4000/μl. Platelets were all nearly 200000/ μl. Lymphocyte counts were low in M and S, but T lymphocytes represented more than 80% in all subjects (data not shown).
Fecal Bacteria
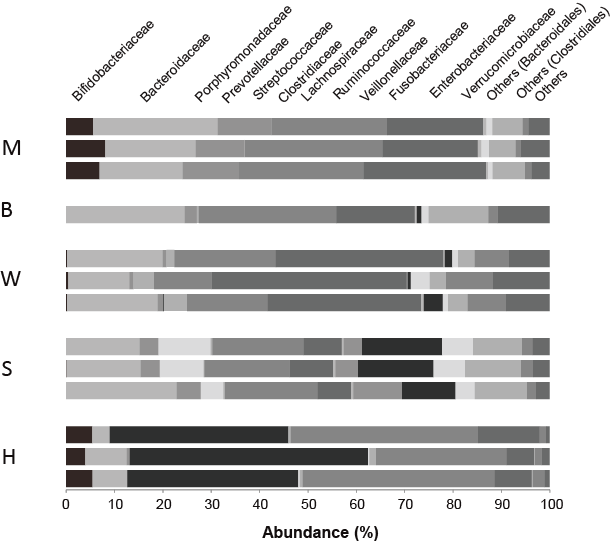
The distribution of fecal bacteria by family is shown in Figure 1. High ketonemia was recognized in two participants, M and H. Both continued more than 10 years Koda’s diet. Bifidobacterium are the dominant bacteria in these two participants. It is a major family of Actinobacteria, which is known to decompose non-digestible oligosaccharides.
Figure 1: Comparison of microbiota of participants by family level
M and H cases, who showed elevated beta-hydroxy butyrate showed noticeable population of bifidobacteriaceae (left part of column).
DISCUSSION
The Koda dietary therapy has proven effective for many intractable diseases in Japan.3,4 It is composed of brown rice and vegetable smash or soup, intermingled fasting therapy, as an alternative medicine. It seems to stimulate the human nervous and endocrine systems, and to increase self-healing ability.4 Also, it changes the metabolic state. For example, Osame18 reported changes in blood sugar and various hormones during his own fasting experiment, and found that the lowering blood glucose was followed by an increase in free fatty acids. Glucagon, glucocorticoids, adrenalin, and growth hormone were simultaneously increased.
In our case series, the daily intake of energy during Koda’s diet was only 900-1000 kcal. The total energy expenditure, however, was predicted more than 1500 kcal/d from BMR (1000-1200 kcal and physical activity of more than 1.5 in freeliving condition), and this discrepancy was enormous in case of M. Although the nutritional intake was insufficient (one tenth of average), nutritional biomarkers, such as hemoglobin, protein, albumin, TG, and cholesterol were almost within the normal range.
It has been said that weight decreases by several kilograms in the first 2-3 months after starting Koda’s diet, but it becomes stable afterward, and weight gain can happen after several months.4 Mori’s long course showed such a curve (Figure 2). It was called the Koda curve and it is thought that the metabolic efficiency of the whole body improves.
Figure 2: Changes of body weight and laboratory data for 10 years since onset of disease in Case of M.
Blood glucose level became low during fasting, and slight decrease of body weight is recognized, but serum protein, hemoglobin, hematocrit and RBC count remain within the normal value. Body weight first decreased but it recovered 2-3 later

Cahill2 studied the glucose metabolism of people who let themselves fast for 40 days. A rise of β-hydroxybutyrate (BHB) to approximately 6 mM was characteristic. During starvation, insulin levels are extremely low and facilitate acyl-CoA entry into mitochondria, producing significant amounts of acetyl-CoA that cannot be metabolized in the Krebs cycle and is diverted towards ketone bodies synthesis.19 Cahill20,21 reported that in the starving human adult, BHB and aceto-acetate are produced in the liver from long-chain fatty acids and released into the blood.
The ratio of acetoacetate to 3-β-hydroxybutyrate depends on the redox status in the liver mitochondria (i.e., the NAD+/NADH ratio). Under normal circumstances, the BHB to aceto-acetate ratio is around 1. However, in diabetic ketoacidosis, this may increase to more than 10. The reference range of BHB is less than 0.4-0.5 mmol/L. In normal individuals BHB and acetoacetate are less than 0.1 mM and acetone essentially not measurable. It has been said that levels of more than 1 mmol/L require further action, whereas levels of more than 3 mmol/L require immediate medical review.20,21,22,23,24,25,26,27
Glucose, BHB, acetoacetate should be used for the energy source of the brain of these people. Liver, fat, muscle, and kidney affected the fasting energy production. The liver produced two-fifths, and the kidney three-fifths of the remainder. As for the gluconeogenesis of 80 g that brain requires a day, it was estimated that lactic acid from glycerol made 15-20 g, pyruvate reuse 20 g, 35-40 g from ketone bodies by an alanyl course, and 10-11 g/day by protein. With BHB as substrate, Nicotinamide Adenine Dinucleotide (NADH) increases relative to NAD+ and CoQ10 increased relative to CoQH2 . This provides an increase in energy for Adenosine triphosphate (ATP) synthesis as compared to that in the heart using glucose. BHB increased contractility, and oxygen consumption decreased.
Increased BHB was observed in two participants, M and H. M’s ketone bodies in the blood were more than 3 mM, so the main energy should come from ketone bodies. This level is seen in ketoacidosis, but the acidity would be neutralized by magnesium hydroxyde (sui-magu). Biochemical changes of M coincided with the metabolic adaptation to yield BHB, as shown by elevated AST, ALT, and CK. High aspartate was a reflection of above metabolic change. H was occasionally omnivorous, although he showed increased BHB. In his case all hepatic enzymes and CK were within normal range. The three other patients also showed elevated AST, ALT, LD and/orγ-GTP, without increase of CK. Any carbohydrate ingested, in even small amounts, decreases the level of BHB.19Thus, these 3 patients did not show the increase of ketone bodies.
As only ketone bodies increased without symptoms of ketoacidosis, BHB would be produced by enterobacteria. Intake of dietary fibers seemed not to be enough as the energy source, so the contribution of enterobacteria should be examined. As only two of the five patients produced high ketone bodies, it is plausible that intestinal bacteria would produce ketone bodies or precursors.
We analyzed the intestinal bacteria of participants who continued to take a Koda-type restriction diet for more than one year. The human digestive tract harbors trillions of bacteria, many of which establish lifetime, symbiotic relationships with their hosts. Those bacteria feed us with the products and byproducts of their own digestive activities. The gut microbiome had evolved to encode a variety of digestive enzymes that break down hard-to-digest polysaccharides from food plants. In the case of M, vegetable juice was filtered to remove insoluble fibers, so only soluble fibers could contribute to the energy source. Some Bacteroides had xylanase or cellulose activities, so these species may play an important role in fiber degradation in a strict vegetarian. Bifidobacterium was also known to digest insoluble oligosaccharide.
Hayashi, et al.28 had previously analyzed the fecal bacteria of Mori 15 years ago. They found that Clostridium and Bacteroides were the dominant groups, but they did not find Fusobacterium. They also found many Bifidobacterium by direct culture, but they could not find a relationship with vegetarian diet by Polymerase Chain Reaction (PCR) method.
We found that the high BHB was only recognized in two subjects with Bifidobacteriacae. Noack-Loebel, et al.29 reported that many Bidifobacterium spp. were detected in the lacto-ovo-vegetarian diet consumed by children. Fusobacterium prausnitzii is one of the most frequent and numerous species detected in the human large bowel using 162 eDNA library method (approximately 4-10% of the total clone population. Finegold, et al.30 failed to detect this species in a vegetarian. All of our subjects did not show fusobacterium except for the man with gastric cancer. H, who was not a strict vegetarian, showed the dominant Prevotellaceae but this finding is difficult to interpret. It was noteworthy that 4 participants showed the dietary intake was less than two third of Transesophageal echo TEE, so at least one third energy should come from intestinal microbiota. Calorie restriction diet may clarify the contribution of microbiota for energy production.
Numerous animal models consistently demonstrated that gut microbiota can modulate host energy homeostasis and adiposity through different mechanisms.31 Although, extensive experimental data suggested that microbiota manipulation can beneficially affect host glucose metabolism, a causal relationship will needs to be proven in humans.31,32,33,34
In addition to the dietary therapy, Koda’s therapy aimed at autonomic nerve training to improve the nerve-muscular reflex by letting exercise to perform waist twisting, movements to strengthen the capillary circulation, alternate bathing in warm and cool water, naked body therapy to be exposed to cool air.4 These could maximize the self-healing ability to reach the spiritual level of living. This is a target of study in integrative medicine in near future.35 We shall start to call volunteers to participate in the cross-sectional and prospective study on Japanese traditional brown rice vegetarians for health. Some of them would practice fasting for their health by themselves.
CONFLICTS OF INTEREST
The authors declare that they have no conflicts of interest.
CONSENT
As for the Patients consent statement, All participants agreed to publish the manuscript, entitled “Koda’s fasting therapy: Energy balance and intestinal bacterial flora” in Advances in Food Technology and Nutritional Sciences – Open Journal, and provided the written informed consent (written in Japanese). The study was conducted at the Mori Acupuncture Clinic, Osaka as a collaborative work with authors.
ACKNOWLEDGEMENT
The authors appreciate Dr. Hirokazu Tsuji, Yakult Central Research Institute, for his support to analyze fecal bacteria. Authors also thank Dr. Philippe Calain for discussion and English revision of this manuscript. The authors appreciate the Life Science Promoting Association for funding this study.


