INTRODUCTION
Air pollution (AP) is a well-established public health problem. Most notably, particulate matter (PM) with an aerodynamic size of <2.5 μm (PM2.5) and <10 μm (PM10) has been studied extensively for over several decades.1 The association of PM2.5 and increased risk of acute myocardial infarction has been well-documented by the application of both time series and case crossover analyses which are effective approaches to capture acute effects.2,3,4 However, less is known about the long-term or chronic effects of AP on the cardio-vasculature. This requires a longitudinal or retrospective cohort design in which exposure has accumulated over a long span of time.5,6
Subclinical atherosclerosis (SCA) is one example of a cardiovascular outcome relevant to PM2.5 exposure, takes decades to develop and is difficult to assess. Given the availability of historic AP data, average cumulative AP exposure (a year or more) can be estimated and mapped to an individual’s residential history. There are opportunities to study long-term AP exposures in relation to long-term atherosclerotic processes using conventional tomography-based measures such as coronary artery calcification (CAC). Another way to overcome this challenge in assigning temporality in the case of chronic exposure and cardiovascular disease is to focus the research on a vulnerable subpopulation where effects of the exposure can be measured in a shorter timeframe or where specific intermediate measures can link the exposure to the outcome. An important example may be to measure associations in middle-aged women, as a potential “at risk” and particularly informative population. In this population, age is a risk factor for both long-term exposure to AP and cardiovascular disease (CVD). Middle-aged women are of particular interest in this scenario given that the menopause transition is underway.7 The dynamic hormonal and metabolic changes in middle-aged women8 may be important intermediaries between AP exposure and CVD risk. A focus on this subpopulation and these specific physiologic processes can improve measurement of the health effects of AP, give insight into biologic mechanisms, and support efforts to reduce chronic disease burden in women.
BACKGROUND
Subclinical Measures of Atherosclerosis and Particulate Matter: Potential Pathways
Atherosclerosis, a progressive disease, is characterized by the plaque accumulation in the arteries.9 Along the biological pathway leading to a clinical coronary event, there are subclinical changes in the endothelium of the coronary and carotid arteries, which have been shown to be predictive of future cardiovascular risk.10 CAC is a significant marker of SCA and coronary heart disease (CHD).11,12 There is a direct correlation of coronary calcium measured by electron beam computerized tomography (EBCT) and atherosclerotic lesions in the arteries of the heart.13 Traditional cardiovascular risk factors, including age, smoking, systolic blood pressure (SBP), diastolic blood pressure (DBP), high-density lipoprotein cholesterol (HDLc), and body mass index (BMI), are also significant predictors of CAC. See Figure 1 below of potential pathways of PM2.5 and its potential involvement in the development of CAC/subclinical atherosclerosis.
Figure 1. Potential Pathways of PM2.5 and its Potential Involvement in the Development of CAC
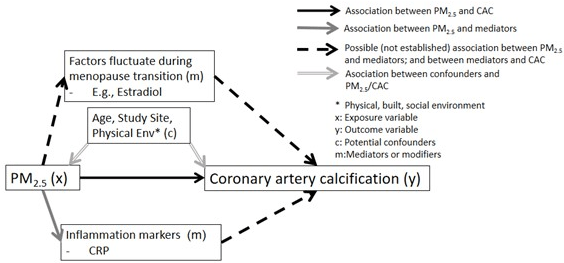
Controlled exposure and cellular experiments shed light on mechanisms linking PM2.5 exposure with CAC. At the cellular level, cell types, including lung epithelial, endothelial cells, and cardiomyocytes, have shown to respond to in vitro PM exposure with elevated reactive oxygen species (ROS) levels and oxidative stress.14,15,16 With the controlled exposure, inhalation of the tiny particles (e.g., PM2.5) deep into lungs and blood circulation through the alveolar-capillary membrane may stimulate an inflammatory response (e.g., increased levels of interleukin (IL)-6, nitric oxide (NO)) and decrease cell viability in human coronary artery epithelial cells, which impacts vascular health, further hardening arteries.17 The commonly proposed physiological pathways linking AP and CV events are through: 1) pulmonary oxidative stress or inflammation (this implies lung-specific inflammation); 2) endothelial dysfunction (blood vessel endothelium); and 3) atherothrombosis.17 The inflammation and coagulation systems’ interaction are the key mechanism leading to endothelial dysfunction, which link to eventual CV events.17 Stimuli such as air pollutant exposure may initiate the development and progression of calcification through the death of smooth muscle cells (SMC), which could be the driving force for early microcalcification.18 This is then followed by infiltration of macrophages into the lipid pool, undergoing cell death and calcification, which leads to the development of a necrotic core processed along with inflammation.19 In addition, ROS regulate the activity of redox-sensitive signaling pathways and affect vascular biology.20 Inhalational exposure to AP triggers not only inflammation but also major ROS generated in AP exposure, which affects NO release, leading to endothelial dysfunction, with detrimental effect on vascular cells.20,21,22,23
Diverse Methods Used in Measuring Particulate Matter Exposure
Researchers in the U.S. have access to a variety of measures of outdoor air quality.24,25 The U.S. Environmental Protection Agency (EPA) and the Clean Air Act mandated the widespread installation of air pollution monitors by the federal, state, and local governments that covers to a large extent the most populated geographic areas of the U.S. Early studies utilized “nearest monitor” for exposure assessments as well as “distance from a road” for exposure measurement. Nearest monitor readings are not applicable for large swaths of the US and abroad that are largely rural but populated where no monitors are in place. A new approach to exposure assessment was developed and came into wide use starting in 200026 with the use of modelled data in the EPA’s hierarchical bayesian model (HBM). This approach estimated PM2.5 throughout the U.S. (https://www.cdc.gov/nceh/tracking/phase.htm).27 These are modelled daily estimates and are available for the 12 km (Eastern U.S.) and 36 km (contiguous 48 U.S. states) resolution. HBM estimates provides both spatial and temporal variance of PM2.5, allowing the estimation of air concentration values across the U.S. in the areas where air monitors are sparser. This opened the field and permitted more standardized and validated measurements for use in epidemiological studies.28 Another reasonable and validated approach in countries where such systems are not in place is to estimate individual levels of air pollution using co-kriging, a geostatistical tool, to predict air pollution at unsampled point locations using air pollution monitor data.29 The kriging methodology allows the assessment of spatial variations and account for dominant wind patterns. Kriging is the best linear unbiased estimator, and its estimate is based on the variogram model and the values and location of the measured air pollution points.30 An important aspect of predictions based on kriging is that it includes a measure of uncertainty of predictions. Recent studies incorporated satellite information into air pollution models to better characterize PM2.5 exposure than centralized monitoring data.31,32 Employing remote sensing for PM2.5 measurement better captures PM2.5 composition at a finer geographic resolution and provides a more robust measures of PM2.5 over a given area, increasing spatial and temporal resolution of air pollution modeling.
Is the Menopause Transition a Critical Window for Air Pollution and Cardiovascular Disease?
Women are much less likely to suffer from or die of CHD before age 55 than men but lose this protection after age 55.33 During the menopausal transition, a vulnerable period of accelerating CVD risk, women undergo adverse alterations of vascular remodeling, which are believed to be affected by more than chronologic aging alone.34,35 Previous studies reported that women with premature or early menopause, defined by surgical intervention or premature ovarian failure, may also have an increased risk of non-fatal cardiovascular disease.36
Along general pathways described above on how PM2.5 exposure might contribute to adverse cardiovascular changes and increase CVD risk, there is evidence supporting a connection between PM2.5 exposure and increases in inflammatory markers such as C-reactive protein (CRP), plasminogen activator inhibitor Type 1 (PAI-1) and homocysteine among midlife women.7,37 Among middle-aged women, there are alterations in estradiol (E2) level during their menopausal transition, which could be the reasons supporting the connections between PM2.5 exposure and CVD risk during women’s midlife. Interestingly, studies have shown links between the menopausal transition and adverse alterations in low-density lipoprotein cholesterol (LDL-C), and E2 levels among non-obese women,38,39 which could increase their CVD risk. Therefore, it is possible that these physiological changes during the menopausal transition, involving changes in E2,40 and inflammation markers41 (such as CRP), could augment the adverse effect of PM2.5 exposure on SCA. Because those unique physiological changes described above, there are strong reasons to study menopausal women as a distinct and unique subset of the adult population.
OBJECTIVES
This review first focused on the exposure measurement methodology, study designs and results of the association of PM2.5 and SCA, measured as CAC in the general population. Second, particular attention was paid to describing theories of the underlying biology in the general population and in women undergoing the menopause transition. Through a synthesis of the literature, recommendations for future studies in women at midlife were provided. The major goal was to identify research gaps based on conducted review and propose a conceptualized model to better evaluate this association.
Studies published from 2005 to the present which considered the long-term impact of PM2.5 and its constituents on SCA risk using a measure of CAC were included in the review.42,43,44,45,46,47,48 Another important measure of SCA, carotid Intima medial thickness (CIMT) has been also associated with PM2.5 and other air pollutants. Although CIMT is not as predictive of incident CVD as CAC, midlife women experience significant increases in CIMT during the menopausal transition making this measure of specific interest. Therefore, we also reviewed additional studies36,46,49,50 assessing the association between PM2.5 exposure and CIMT of the carotid arteries, and differences in this association by gender or age.
METHODS
Evaluate the Association between Long-term PM2.5 Exposure and Coronary Artery Calcification
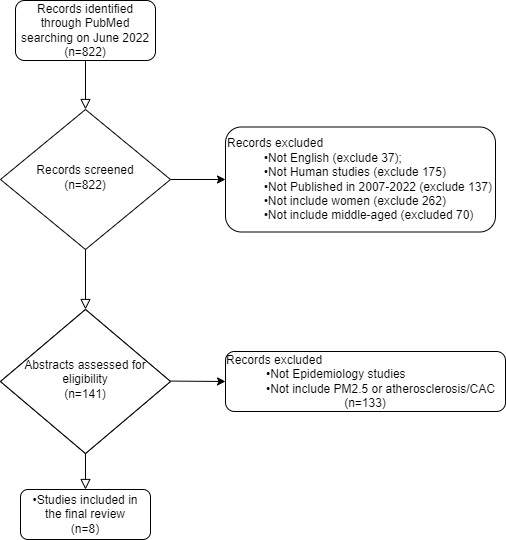
To identify published research on the association between PM2.5 exposure and CAC, we used the National Library of Medicine (PubMed) on June 25, 2022, including all investigations using atherosclerosis with AP as MeSH terms for our search. The keywords (“particulate matter”[MeSH Terms] OR “air pollution”[MeSH Terms]) were combined with ((“atherosclerosis”[MeSH Terms]) OR (“atherosclerosis, coronary”[MeSH Terms]) OR (“coronary artery calcification”[MeSH Terms]) OR (“subclinical atherosclerosis”[MeSH Terms])), for the search. All titles were initially reviewed from the search to screen the relevant and original studies addressing associations between AP and SCA among women from 2007-2022. Additionally, only English language studies, those involving humans, women and middle-aged participants were included. The epidemiologic investigations with cross sectional or longitudinal cohort designs were included. After a complete review of all abstracts, and full texts, there were eight separate publications assessing the long-term exposure to PM2.5 and the risk of SCA as measured by CAC (Figure 2). Long-term PM2.5 exposure was defined by our review as those assessing cumulative exposures. We included only those studies that evaluated the PM2.5 long-term exposure and its chronic effect to CAC. Different approaches across the reviewed studies were applied to assess the long-term exposure of PM2.5.
Figure 2. Inclusion and Exclusion Criteria for Literature Review on Previous Studies Evaluated Association between PM2.5 and CAC
For selected studies on the associations of PM2.5 and CAC, information related to study design, population at risk and sample sizes, and general demographic characteristics were extracted; details of the exposure assessment as well as method of outcome measurement, primary findings, adjustment factors, and effect modification terms were noted. We summarized findings to date and proposed models going forward that may improve the study of the association of PM2.5 and CAC in women at midlife. We compared and contrasted each of these studies for the following components: 1) design of each investigation; 2) population at risk/clinical measures including age, gender and race/ethnicity; 3) exposure assessment methodology (e.g., how PM2.5 was estimated); 4) timing and the definitions of long-term exposure; 5) specific results of the association of PM2.5 and CAC, including risk estimates and 95% CI confidence intervals in general population, or men and women when applicable. Additionally, a descriptive summary and synthesis of associations between PM2.5 exposure and CAC were provided, with a focus on whether age and gender differences were evaluated in those studies.
Evaluate the Association between Long-term PM2.5 Exposure and Carotid Intima Medial Thickness
Studies that reported on associations of long-term PM2.5 exposure and carotid intima medial thickness (CIMT) were also reviewed because changes in CIMT have been observed during the menopause transition. As our main interest and focus of this review is on the studies of PM2.5 exposure and CAC, we had a particular focus on studies that evaluated gender or menopausal status as effect modifiers of PM2.5 exposure and CIMT association. For those studies, we focused on summarizing the role of gender and menopausal status on PM2.5 exposure and the CIMT association.
RESULTS
Effects of PM2.5 Exposure on CAC among the General Population and in Women
Design of each investigation: Eight studies assessing the association between ambient AP (PM2.5 exposure) and CAC among the general population and in women were reviewed (Figure 2). They included 1) four separate investigations from the Multi-Ethnic Study of Atherosclerosis (MESA) by Roux et al,46 Sun et al,48 Kim et al,43 Kaufman et al44; 2) two studies from the German Heinz Nixdorf Recall Study (HNRS) by Hoffmann et al45 and Hennig et al51; 3) one investigation from the Framingham Offspring cohort by Dorans et al47 and 4) the coronary atherosclerosis disease early identification and risk stratification by non-invasive imaging (CREATION) Chinese cohort by Wang et al.42 All the studies, except for the most recent MESA work in 2016,44 the study conducted using the Framingham Offspring cohort in 2016 by Dorans et al,47 and the last published piece of work using the Heinz Nixdorf Recall Study by Henning et al,51 were cross-sectional studies.
The four studies assessed the PM2.5 and CAC association using the MESA cohort collected CAC data at baseline (2000-2002),43,44,46,48 and the one longitudinal study also utilized CAC repeated measures data collected at follow-up visits from 2002 to 2005 and from 2010 to 2012.44 In addition, the German HNRS study by Hoffmann et al45 utilized baseline data (2000-2003) on 4,494 men and women from a highly industrialized rural area in Germany, and in 2020 Hennig et al51 used the same cohort and the follow-up visits’ data (2006-2008) to conduct longitudinal study. The aim of the original HNRS study was to improve the prediction of cardiovascular events by integrating new imaging and non-imaging modalities in risk assessment,52 so the air pollution data was added to this cohort later for evaluating the association with CAC. Furthermore, the Framingham Offspring cohort by Doran et al47 included 3,399 participants and 51% were men. The inception of the Framingham Offspring cohort was investigating the familial clustering of CVD phenotypes and the role of shared environmental factors versus genetic factors in contributing to such aggregation.53 The air pollution data were added to this cohort by Dorans et al,47 and they conducted the study assessing the association between PM2.5 and CAC presence and progression. The last published piece of work (Wang et al42) came from the CREATION Chinese study. The data were collected from 8,168 adult outpatients aged 25 to 92 with suspected CHD in 2015 to 2017 at baseline.42 The original aim of this study was to identify risk factors that lead to coronary artery atherosclerotic plaque progression and CAD events and Wang et al42 added the air pollution estimation data to conduct their study.
Population at risk/clinical measures: The characteristics of each reviewed study, summarized in Table 1, including age and gender distribution of the study population, the two key factors of interest. The US MESA, US Framingham Offspring, German HNRS, and Chinese CREATION studies had similar study aims to determine the relationship between PM2.5 exposure and CAC presence or progression.42,43,44,45,46,47,48 The four most common ethnic groups (including: White, African American, Chinese American, and Hispanic) in the United States were included in MESA, and CAC was found to be higher in white patients.44 The HNR study group at baseline (mean age=60.2; range: 45-74) was slightly younger than the MESA cohort (mean age=62; range: 45-84-years) and included individuals with previous CV disease (CVD).54 The Framingham Offspring cohort had an average age of 52.2 and 59-years-old at baseline and at follow-up CAC measuring visits, and approximately half were women.47 The Chinese CREATION study included a wide age range (age range: 25-92-years), with an average age at baseline of 56.9 (SD: 10.4).42 Of all participants across reviewed studies, 46.4-53% were women, and the average age of the general population ranged from 52.2 to 62-years-old (exception: the Chinese CREATION cohort had a very wide age range: 25-92-years). When comparing the age range of included participants in the two longitudinal studies, the MESA cohort by Kaufman et al44 was older, on average, than was the Framingham offspring cohort (62 vs. 52.2-years-old), and it had more female participants (53% vs. 46.4% female) (Table 1).
| Table 1. Description of Studies Included for Synthesis |
| Author |
Study Design |
Study
Population
(Location, Characteristics) |
Pop Size/# |
Exposure Measurement |
Outcome |
Age, years Mean (Range) |
%
Female
|
| Hoffmann et al45 |
Cross-sectional |
Germany,
2000-2003
Heinz Nixdorf Recall Study (HNRS) |
4494 |
Distance from residence to road approach to characterize exposure; Daily mean value for PM2.5 exposure for 2002 was calculated for each grid cell |
CAC
-Ln (CAC+1) |
60 (7.8) |
51 |
| Diez Roux
et al46 |
Cross-sectional |
USA, 2000-2002
MESA |
5172 for imputed PM; 5041 for 2001 mean PM |
20-year imputed mean; and 2001 mean PM were estimated. Imputed exposure used spatio-temporal model; and mean 2001 PM2.5 exposure was estimated for each participant by averaging all available daily values collected at the monitor nearest their residential address at baseline. |
CAC
1) Presence of CAC: Agatston scores>0;
2) Ln (CAC) for persons with nonzero CAC |
62 (45-84) |
53 |
| Sun
et al48 |
Cross-sectional |
USA, 2000-2002
MESA |
6256 |
PM2.5 exposure: 1) Nearest monitor
(primary approach); 2) inverse-distance monitor weighting; 3) city-wide average |
CAC
1) Presence of CAC: Agatston scores>0;
2) Ln (CAC) for persons with nonzero CAC |
62 (45-84) |
52 |
| Kim
et al43 |
Cross-sectional |
USA, 2000-2002
MESA |
5488;
-2683, presence of CAC; -2805, no CAC
|
Long-term concentrations of PM2.5
components at participants’ homes were predicted using both city-specific
spatio-temporal models and a national spatial model |
CAC
1) Presence of CAC: Agatston scores>0;
2) Ln (CAC) for persons with nonzero CAC |
61.9 (45-84) |
52.3 |
| Dorans
et al47 |
Longitudinal cohort |
USA, 2002-2011
Framingham Offspring cohort study |
-3399
CAC round 1 measured in 2002-2005;
CAC round 2 measured in 2008-2011, for 51% of participants
|
Spatio-temporal model PM2.5 exposure and residential proximity of major roads
|
CAC
1) Detectable CAC: Agatston scores>0;
2) Ln (CAC) for persons with nonzero CAC;
3) Detectable progression of CAC between the 1st and 2nd round of scans;
4) Annual change in CAC per year |
52.2 at 1st scan (SD: 11.7);
59 at 2nd scan (SD: 11.8) |
46.4 |
| Kaufmann et al44 |
Longitudinal cohort |
USA, 2002-2012 (mean follow-up 6.2-years) MESA |
6795
-5834 had at least two CAC scans;
-961 had only baseline CAC scan |
Individual-weighted PM2.5
-integration of all exposure monitoring and modeling outputs into a final,
individual-level prediction, for each 2-week period of follow-up, permitting time-varying
time-location information |
CAC
1) CAC mean progression rate over follow-up;
2) Ln (CAC+25) |
62 (45-84) |
53 |
| Wang
et al42 |
Cross-sectional |
China, 2015-2017
CREATION |
8168 |
Hierarchical land-use regression modeling, for PM2.5 exposure, based on annual mean daily monitoring data;
sensitivity analysis, estimated cumulative exposures back for 3, 4, 5, 6, and 10-year periods before 2015 |
CAC
1) Detectable CAC: CAC>0;
2) Severe CAC: CAC>400 |
56.9 (25-92; SD=10.4) |
51 |
| Hennig
et al51 |
Longitudinal cohort |
Germany,
2000-2003 and
2006-2008, HNRS |
4814 middle-aged adults, 1154 had CAC |
Residence-based approach to characterize exposure (land use regression and
chemistry transport modelings); Daily mean values for PM2.5 for 2000-2002 and
2006-2008 were calculated for each grid cell |
CAC
Progression of CAC;
% increase annual growth rate for CAC |
59.1 (SD: 7.6) |
53 |
| Pop size/#, population size; PM2.5, particulate matter ≤2.5 µm in diameter |
Exposure assessment methodology: In this section, we summarized the exposure assessment measures in detail for each of the included studies. Overall, there were varied assessment techniques of PM2.5 exposure within the four cohorts. Early investigations (Hoffmann et al45 and Dorans et al47) used distance from a main road to the residence. More recently, the exposure has been estimated based on hierarchical models including nearest monitor, inverse-distance monitor weighting, and city-wide average.42,43,44,46
Diez Roux et al,46 (MESA) imputed mean PM2.5 data, using a spatial-temporal model. In addition, they also estimated mean 2001 PM2.5 exposure for each participant by averaging available daily data collected at the nearest monitor of the residential address at baseline.46 There was significant heterogeneity in the level of exposure between the six study sites (Baltimore, Maryland; Chicago, Illinois; Forsyth County (Winston-Salem), North Carolina; Los Angeles County, California; New York City, NEW York; and St. Paul, Minnesota), with PM varying from 12.82 (SD=0.71) in Minnesota to 24.10 (SD=3.29) μg/m3 in California.46 In another MESA study conducted by Sun et al,48 PM2.5 components were considered (sulfur, elemental carbon, silicon, and organic carbon) when evaluating the association with CAC. Three approaches were used for exposure assessment: nearest monitor, inverse-distance monitor weighting, and city-wide average. In the study conducted by Kim et al,56 two advanced exposure prediction modeling approaches were used, and those approaches have been described in detail elsewhere.55 Briefly, annual averages of predicted PM2.5 components’ concentrations at baseline participant addresses were estimated for one year from May 2007 to April 2008 when data on all four PM2.5 components were available.43,56 Unfortunately, the modeling was based on 2009-2010 levels of the PM2.5 as testing was not available during the study baseline period (2000-2002), which lead to exposure misclassification43 This use of levels from misaligned years could introduce significant bias, as we know there has been a significant downward trend in AP for the past 20-years. The authors stated that the study intent was to obtain the most valid and precise measures of association possible, and therefore they predicted individual-level concentrations based on a rigorous exposure modelling approach,43 which is a more accurate approach compared to that used by Sun et al48 MESA (Kaufman et al44) used average measurements from a cohort-focused monitoring campaign, the spatiotemporal model employed, incorporating community specific measurements, agency monitoring data, and geographical predictors, for PM2.5 exposure estimation.
Hoffmann et al45 (Germany HNRS) estimated exposure using the residence-based approach, and the daily mean value for PM2.5 for 2002 was calculated for each grid of 5 km. In addition, they also estimated distances between residences and major roads using official digitized maps and categorizing them into high traffic exposure (≤100 m) vs. low traffic exposure categories.45 In 2020, Hennig et al using also HNRS cohort calculated daily mean PM2.5 for each grid cell and conducted the cohort study. They utilized residence-based approach to characterize the PM2.5 exposure, including land use regression and chemistry transport models.51 Dorans et al,47 in the Framingham Offspring study relied on residential distance from a major roadway as well as residential PM2.5 exposure. Spatially resolved average PM2.5 exposures were used for exposure assessment. Averaged daily total PM2.5 predictions over the same index year were used to estimate the annual average PM2.5 exposure for all participants.47 Wang et al42 used hierarchical land-use regression modeling for PM2.5 exposure assessment based on annual mean daily monitoring data (2014-2015) from the nationwide monitors. In addition, this study further tested different PM2.5 exposure time window impacts on CAC, including cumulative exposures going back for 3-6-years and for 10-year periods before baseline CAC measurement.42
The mean level of PM2.5 exposure reported by the US MESA studies (by Diez Roux et al46; Kim et al43; Sun et al48; and Kaufman et al44) and German HRNS study (by Hoffman et al45) ranged from 13.7 to 22.8 µg/m3. The median value in the US Framingham Offspring Study was 10.7 μg/m3; and the average was 70.1 μg/m3 (SD=20.0) in the Chinese study.42,47
Of the seven investigations, the earlier studies by Hoffmann et al45 and Diez Roux et al46 were weighted towards roadway proximity- and monitor-based measurements. Roadway proximity does not provide a metric of PM2.5 (µg/m3) and is therefore more imprecise. On the other hand, MESA studies, Framingham Offspring study, and a study used CREATION cohort utilized spatiotemporal models (e.g., satellite-derive measurements in land-use regression) to predict PM2.5 levels. The use of different methodologies of exposure assessment across studies may have contributed to the differences noted. Overall, those studies that employed spatiotemporal exposure assessment are less prone to exposure misclassification than the studies that used monitor-based measures, thus, given the more valid exposure assessment.
Timing of exposure metric and measures of PM2.5 long-term exposure: The ranges of PM2.5 long-term exposure measures’ time across studies included in this review were from one-year average (e.g., Hoffman et al45), to 20-years’ exposure (Diez Roux et al46) based on the closest monitor.
Specifically, Hoffman et al45 in the HNRS study used a residence-based approach to estimate PM2.5 with the European Air Pollution Dispersion model for an annual average for 2002, and the study period was 2000-2003. They also added a proximity to major roadways estimate as a surrogate for PM2.5.45 Hennig et al51 estimated mean long-term PM2.5 in a spatial grid of 1×1 km2 assigned to participants’ addresses using the European Air pollution Dispersion chemistry transport model. They calculated daily PM2.5 data utilizing the routine monitoring data from local environmental agency for time 2000-2003 and 2006-2008 and assigned to participants’ baseline and follow-up addresses using geographic information systems and used those daily values for year 2004 and 2005, when modelled data were not available.51 The longest measure of long-term exposure was carried out by Diez Roux et al46 (MESA) who estimated a 20-year exposure of PM2.5 for 1982-2002 by using geocoded residence over time and the closest monitor for all addresses within 13.1 km of a monitor. Sun et al48 MESA study built upon the Diez Roux46 model with organic carbon (OC) and elemental carbon (EC) components of PM2.5 and using community monitors for 2007 to 2009.
Community monitors for the MESA study were deployed in 2005 and ended in 2008, and the Sun et al48 study used 2007-2008 monitors to estimate exposures for baseline measures (2000-2002), as the monitored data only became available several years after baseline. The endpoint measures were obtained during the period 2000-2002.48 Exposures may have varied as the data were collected 5 to 8-years later than the endpoint outcome measures. The authors addressed the exposure misclassification by assigning “future” exposure to the participants in their final analyses. They justified this by stating that there was a good correlation over the 6-year MESA study period (2002-2007).48 However, their exposure assessment of assigning a later-than-outcome assessment time exposure to the participants (extrapolating exposures) was not accurate, compared with assigning the exposure prior to the outcomes were measured. Kim et al43 (MESA) looked specifically at only chemical components of PM2.5 using 2007-2008 modeled spatiotemporal estimates. Finally, Kaufman et al44 as a final MESA project, was the only study to consider progression of CAC, with a large sample size and an average of 6.2-years’ follow-up. Participant-specific PM2.5 exposure averaged over the years 2000-2010 ranged from 9.2-22.6 μg/m3. PM2.5 exposure estimations were from 1999 to 2012, while the CAC measures were done at baseline (2000-2002) and at follow-up visits (2002-2005; 2005-2007; 2010-2012).44
The Framingham cohort study (Dorans et al47) adopted a 2003 average PM2.5 from a spatiotemporal model as well as an average for the entire period of 2003-2009. They also included a measure of residential proximity to a major roadway, which is a surrogate for exposure to local traffic emissions.
Wang’s study in 2019 of 8,867 individuals in China followed people from 2015-2017 but used 2014-2015 annual mean daily monitoring data for estimating long-term air pollution concentrations for each participant.42 The annual mean levels of PM2.5 exposures were 70.1 (SD=20.0) μg/m3.42
In their sensitivity analyses, they also estimated cumulative exposures back for 3- up to 10-year prior to the baseline visit and evaluated the associations with the CAC.
In summary, there appear to be various definitions of long-term exposure in human health studies of PM2.5 and SCA association. The reason may be due to the unknown latency period related to the development of SCA, CAC, and plaque. Therefore, investigators often are left to adopt the annual average of PM2.5 or possibly a six-years’ PM2.5 exposure, based on the length of their investigations. The important aspect of the exposure measure is, however, is to capture true exposure over a period. Overall, the studies we reviewed adopted at least one year prior to the baseline visits’ PM2.5 exposure as a surrogate for their long-term PM2.5 assignment.
Results of the Association of PM2.5 and CAC, Including Risk Estimates and 95% Confidence Intervals
Studies that reported null or equivocal findings: Five of the eight investigations have yielded equivocal or null findings related to long-term PM2.5 exposure and subsequent CAC measurements.43,45,46,47,48 All the adjustment covariates in each included study for the risk estimates were reviewed and summarized below in table. In the German HNRS cohort, Hoffman et al45 reported that PM2.5 exposure was not associated with higher CAC in all subjects (12.7% higher CAC per interquartile range (IQR) increase in PM2.5<3.91 μg/m3>, 95% CI: -5.6, 45.5). However, those who lived 50 m from a major road had a statistically significant higher chance for a high CAC (OR=1.63, 95% CI: 1.14-2.33) compared to those who lived >200 m away from a major road; and a strong association in men and younger participants was reported.45 In subgroup analyses, the study reported that PM2.5 exposure showed stronger effects on CAC among the participants who had not been working full-time in the last 5-years before the baseline visit.45 Within the MESA study, Diez Roux et al46 failed to find a statistically significant association between PM2.5 exposure and CAC. In addition, they found no evidence that long-term PM2.5 exposure was more strongly associated with CAC in subgroups, including women and older people.
Later analysis within the MESA cohort by Sun et al48 showed that none of the evaluated PM2.5 components was associated with risk of CAC. No effect modifications were evaluated in this study. In other work from MESA published in 2014, Kim et al43 utilized a different modelling approach than Sun et al48 discussed above. Regardless, they were not able to detect an association between CAC and any of the modeled PM2.5 exposures. In addition, the study did not evaluate any effect modifiers, neither by gender nor by age.
Finally, using the Framingham Offspring Cohort participants, Dorans et al47 did not observe any association between PM2.5 exposure and any CAC in the region with relatively low-levels of and little variation in PM2.5 exposure (median PM2.5 in 2003=10.7 μg/m3 and range: 2.9-26.7 μg/m3). Interestingly, their subgroup analyses, which were published in supplemental material, showed a stronger association between PM2.5 and CAC among men than women, though the interactions evaluated were not statistically significant (OR for male: 1.03, 95% CI: 0.92, 1.15 vs. female: 0.92, 95% CI: 0.82, 1.04).47
Studies that are supportive of an association between PM2.5 exposure and CAC: Kaufman et al44 assessed associations of progression of SCA with ongoing exposure of PM2.5. This longitudinal cohort work from MESA showed a statistically significant positive association between PM2.5 exposure and CAC progression which considered CAC measurements over time (Agatston unit yearly change per IQR PM2.5 exposure (5 μg/m3) increase: 4.1 (95% CI: 1.4 to 6.8).44 They also reported that the associations between PM2.5 and CAC progression were stronger among women and those older than 65 (specific data on the risk estimates were not available).44
Wang et al42 utilized a cohort of Chinese participants and found a positive association between long-term PM2.5 exposure and CAC severity (Agatston unit % increase per PM2.5 exposure IQR increase (30 μg/m3): 27.2 (95% CI: 10.8 to 46.1)).42 They concluded that PM2.5 exposures were independently positively associated with CAC. In addition, they evaluated interactions of the exposure response by age and gender and found that PM2.5 exposure effects on CAC were stronger among males (percent change in CAC (95% CI): 42.2 (24.3, 62.7) vs. females: 17.6 (2.6, 34.8)) and among those older than 60.
In 2020, Hennig et al51 reported positive association between PM2.5 and CAC progression in middle-aged participants with no or minor atherosclerotic burden at baseline, while overall no consistent associations were observed. With an increase of 1.5 μg/m3 in PM2.5, they reported an estimated odds ratio of 1.19 (95% CI: 1.03, 1.39) for progression of CAC and an increased CAC annual growth rate of 2% (95% CI: 1%, 4%).
In summary, as described earlier, both exposure (PM2.5) and outcome (CAC) measure methods had limitations (e.g., temporal, and spatial resolution issues). The investigators tried to control confounding in their different populations. Most of the studies adjusted for age, gender, race, socioeconomic factors (e.g., education, income, area of residence), BMI, physical activity, smoking, and some studies further adjusted for lipid levels (e.g., HDL, LDL, triglycerides), blood pressure, physical activity, alcohols consumption, diabetes, hypertension, and lipid-lowering medication, when assessing the association between long-term PM2.5 and CAC (Table 2). Results need to be interpreted with caution because adjustment for those factors (e.g., potential mediators) for assessing the association is not optimal for mediation analyses as doing so may block the pathway. These previous studies adjusted for covariates to explore whether they alter the association between PM2.5 and CAC. To summarize the reviewed risk estimates, non-statistically significant findings were reported by investigators in all cross-sectional studies related to PM2.5 exposure and CAC presence association,43,45,46,48 except for one Chinese study by Wang et al.42 In addition, the longitudinal design was adopted for three of the investigations of PM2.5 exposure on CAC progression. Kaufman et al44 US modelled CAC progression and its association with PM2.5 exposure and reported a positive association. Hennig et al51 reported positive associations among a subgroup of people who had no or minor atherosclerotic burden at baseline. However, the Framingham Offspring cohort study by Dorans et al47 evaluated the association between PM2.5 exposure and CAC presence and progression and found no significant relationship.
| Table 2. Association between PM2.5 Exposure and the Development of CAC |
| Author |
Exposure |
Outcome Assessment / Validation |
Effect Measure
(OR, RR, %change) |
Risk Estimate, LCL to UCL (Lower
95% CI)
|
Adjustment Factors |
Effect Modification |
| Hoffmann et al45 |
PM2.5
exposure |
CAC
Use of chest CTs for each participant. CAC score calculated by the Agatston score. Final CAC score was summation of CAC scores of all foci in the epicardial coronary system |
% increase per IQR increase (3.91 µg/m3) |
Positive associated, but NS: 17.2% (95% CI: -5.6 to 45.5) |
Age, sex, city of residence, area of residence, education, smoking, physical inactivity, waist to hip ratio, diabetes, blood pressure and lipids |
Subgroup analyses among
participants who had not been working full-time
during the last 5-years
No effect modification by age or sex was found |
| Diez Roux
et al46 |
PM2.5
exposure |
CAC
Two chest CT per
participant, calculated mean Agatston score;
50% had CAC>0 |
Relative prevalence |
NS |
Age, Sex, race, socioeconomic
factors, BMI, hypertension, HDL-C, LDL-C, smoking, diabetes, diet and physical activities. The following variables were explored for effect modification: age, sex, lipid levels, site, education, race/ethnicity, diabetes, BMI, smoking |
The following variables were explored for effect modification: age, sex, lipid levels, site,
education, race/ethnicity, diabetes, BMI, smoking
No effect modification by age or sex was found |
| Sun
et al48 |
PM2.5
exposure |
CAC
49% had CAC>0, and their median CAC score are 86 (IQR: 270.5);
Two chest CT per
participant, calculated mean Agatston score |
RR per IQR increase
-Presence of CAC
-ln (detectable CAC) |
NS |
Age, gender, race-ethnicity; total cholesterol, HDL cholesterol, smoking status, hypertension,
lipid-lowering medication;
education, income, waist
circumference, body surface area, BMI, BMI2, diabetes, LDL,
triglycerides; metropolitan area |
Effect modification by variables not assessed |
| Kim
et al43 |
PM2.5
exposure and chemical
composition
of
PM2.5
exposure |
CAC
48.9% had CAC >0, and their mean CAC score are 61.9 (SD=10.1);
Two scans were
obtained for each ID; the mean Agaston score of the 2 scans were used |
Relative risk |
NS |
Age, gender, race/ethnicity;
Framingham Risk Score (total
cholesterol, HDL cholesterol, smoking status, hypertension,
lipid-lowering medication); extended set of variables (education, income, waist circumference, body surface area, BMI, BMI2, diabetes, LDL,
triglycerides); metropolitan area |
Effect modification by variables not assessed |
| Dorans
et al47 |
PM2.5 exposure and residential proximity of major roads |
CAC
CAC was detectable in 47% of observations
Detectable CAC progression thresholds are: CAC=0, threshold change in score of 3.4; 0<CAC≤100, change of 15.9; 100<CAC≤300, change of 46.7; 300<CAC≤1000, change of 73.7; CAC>1000, change of 325 |
ORs of:
-Detectable CAC and average CAC
-Detectable CAC
progression and
average annual change in CAC |
NS
|
Primary model: age, age2, sex, BMI, smoking, education, median
census-tract value of
owner-occupied housing units (quartiles), cohort (offspring or third generation), date of scan and number of days between scan and examination at which individual-level covariates reported.
Repeated measures analyses: scan (1st or 2nd round); for detectable CAC progression: age at MDCT1 (age, age2), covariates reported at Offspring
Examination 7 or Generation 3
Examination 1, and time between MDCT scans; for annual change in CAC, age at 1st scan (age, age2) and time since first scan and included interaction terms with time since first scan: age at first scan (age, age2), sex and cohort |
No effect modification by age, sex, cohort, 10-year risk of
atherosclerotic CVD, or smoking status was found |
| Kaufmann et al44 |
PM2.5
exposure |
CAC
Two chest CT per
participant, calculated mean Agatston score;
CAC increased average by 24 Agatston units per year (SD 58) |
Agatston unit yearly change per IQR (5 µg/m3) increase |
4.1 (95% CI: 1.4 to 6.8) |
Baseline age, sex, ethnicity, site, CT scanner type, BMI, physical activity, smoking and second-hand smoke
exposure (both time-varying), employment outside the home, total cholesterol, HDL, triglycerides, statin use (time-varying), neighborhood socioeconomic index, level of
education, income
Additional models: blood pressure and diabetes. |
Effect modification by
several factors was weak and inconsistent between PM2.5 and NOX, another exposure this study evaluated
Suggested a greater impact to elderly (65-74-years), women, non-obese (BMI≤30), hypertensive individuals |
| Wang
et al42 |
PM2.5
exposure |
CAC
Summed total CAC score
Mean CAC was 91.4 (322.2) Agatston units |
% increase per IQR increase (30 µg/m3) |
27.2 (95% CI: 10.8 to 46.1) |
Age, sex, BMI, smoking (status,
duration, and intensity), alcohol
consumption, education, and physical activity; area-level variables:
urbanization (2500 population per 1×1-km2 grid), study region (e.g., north, southeast, and southwest), Beijing residence (yes or no), and categories of residence distances to Fuwai Hospital |
Potential effect modification was evaluated for specific participant characteristics (age and sex),
disease risk factors (BMI, smoking,
diabetes, and statin use), and
geography (region and
urbanization)
Association of CAC with PM2.5 was greater among male, diabetes, and elderly (≥60-years) participants
In restricted analyses,
postmenopausal women (N=1732 out of 3790, 45.7%), had an even stronger association between PM2.5 and CAC (PM2.5 per 10 µg/m3: 34.5%; 95%CI, 5.8% to 70.9%) |
| Hennig
et al51 |
PM2.5
exposure |
CAC>0≥ detectable CAC |
OR of detectable CAC per 1 unit increase in PM2.5 |
1.28 (95% CI: 1.13 to 1.45) |
Age, sex, BMI, smoking status and quantity, environmental tobacco smoke, LDL-C/HDL-C, physical
activity, education, traffic noise and for dichotomous outcomes additionally years of follow-up.
Extended model adjusted for SES and city |
No effect modification by age, sex, BMI, DM, incident statin intake, low education, smoking, and high CVD risk (using Framingham risk score) was found |
| PM2.5
exposure |
CAC>400≥severe CAC |
OR of severe CAC |
1.59 (95% CI: 1.20 to 2.21) |
| PM2.5
exposure |
Progression of CAC: Yes vs. No
Annual growth rate in Agaston score=log(CACt1+1)-log(CACt0+1)/years of follow-up |
OR of progression of CAC per IQR increase in PM2.5 (1.5 µg/m3)
Annual growth rate change for CAC |
1.20 (95% CI: 1.02-1.43)
1.55 (95% CI: 1.05-2.29)
Among those with no/minor
atherosclerotic
burden at baseline |
PM2.5, particulate matter≤2.5 µm in diameter
OR: Odds ratio; RR: Relative risk; IQR: Interquartile range |
Effects of PM2.5 exposure on CAC among women: Four out of the 8 studies examined effect modification by sex or age with PM2.5 to CAC risk.42,44,45,47 Although all four studies reported that the assessed interactions were not statistically significant, two of the studies concluded that the effect of PM2.5 exposure to CAC was stronger in subgroup analyses of the elderly and women (Table 2).42,44 Kaufman et al44 (MESA) study found that the association between PM2.5 and CAC progression was stronger among women, though the evaluated interactions were not statistically significant.44 The study by Wang et al42 conducted further sensitivity analyses among postmenopausal women (N=1732 out of 3790 women, 45.7% postmenopausal women). They reported that the positive association of PM2.5 exposure and CAC was significant and much stronger among this subgroup of women (34.5% greater CAC score for a 10 μg/m3 increase in PM2.5; 95% CI: 5.8% to 70.9%).42 These findings indicate that there is a potential stronger effect among women or among women after menopause for PM2.5 exposure to CAC development.
The remaining seven studies assessed association between PM2.5 exposure and CAC neither adjusted for menopause status nor were able to assess the menopausal transition as an effect modifier for evaluating the association between PM2.5 exposure and CAC.43,44,45,46,47,48
PM2.5 and CIMT: effect of gender or age as modifier: We also reviewed the studies assessing the PM2.5 exposure and CIMT risk association with a focus on looking at those studies, which particularly assessed gender or age as effect modifier. We found five studies, which examined effect modifications by gender.46,49,50,57,58 Table 3 includes information on study design, cohort, and evaluated effect modification in detail. Overall, findings suggest that there is no statistically significant interactions of gender or age on the PM2.5 exposure and CIMT association.
| Table 3. Effect Modification for the Association between PM2.5 Exposure and the Development of CIMT |
| Author |
Study Design |
Study Population |
Pop Size/# |
Exposure |
Outcome |
Evaluated Effect Modification |
| Künzli et al50 |
Cross-sectional |
Two clinical trials’ participants from
Los Angeles, CA, USA, 1998-2003 |
798 |
PM2.5 |
CIMT |
For CIMT, association between PM2.5 and CIMT was stronger among older (≥60-years), women, person using lipid-lowering therapy at baseline, and never smokers.
Strongest association was in women ≥60-years (N=186 out of 355 women) (15.7%, 95% CI: 5.7-26.6%) |
| Diez Roux
et al46 |
Cross-sectional |
USA, 2000-2002
MESA |
4912 |
PM2.5 |
CIMT |
The following variables were explored for effect modification: age, sex, lipid levels, site, education, race/ethnicity, diabetes, BMI, smoking.
No effect modification by age or sex was found |
| Künzli et al57 |
Cohort,
Longitudinal analyses |
Five clinical trials’ participants from
Los Angeles, CA,
USA, 1998-2003 |
1483 |
PM2.5 |
CIMT progression |
Associations between PM2.5 and CIMT progression were not different by sex, lipid-lowering treatment, and ethnicity. |
| Bauer et al58 |
Cross-sectional |
Germany, 2000-2003
HNRS |
3380 |
PM2.5 |
CIMT |
Effect modification was investigated by including interaction terms, and no effect modification by sex was found. Younger and obese participants, those without diabetes mellitus, statin users, and participants with any full-time employment and residents of Bochum and Essen, Germany show slightly stronger associations, but all 95% CIs were not statistically significant. |
| Adar
et al49 |
Cohort,
Longitudinal and cross-sectional analyses |
USA, 2000-2002
MESA |
N=6256 for baseline;
N=5660 (83%) had 2 ultrasound exams, 2000-2006; N=5362 had no missing data |
PM2.5 |
CIMT risk and progression |
Effect modification was examined by age, gender, race, education, obesity, diabetes, hypertension, statin therapy, and baseline CIMT
Association between PM2.5 and CIMT was strong among women, diabetics, hypertensive, and residents of St Paul. |
| CIMT: Carotid intima-media thickness test |
One cross-sectional study (N=798), by Kunzli et al50 used two clinical trials’ data from the Vitamin E Atherosclerosis Progression Study (VEAPS), and the B-Vitamin Atherosclerosis Intervention Trial (BVAIT). The study exposure was annual mean PM2.5 (ranged: 5.2-26.9 μg/m3; mean=20.3), assigned to participants using their geocoded residential areas. This study reported that the association between PM2.5 exposure and CIMT was strong among older people (≥60-years), and women, with the strongest association found in women ≥60-years (N=186 out of 355 women; % difference in CIMT=15.7%, 95% CI: 5.7-26.6%). However, they reported that there was no clear evidence of associations of PM2.5 exposure with CIMT by age or sex, as all their evaluated p for interactions were greater than 0.05.50
The study by Diez Roux et al46 which used the MESA cohort (N=5172), also evaluated the association between PM2.5 exposure to CIMT, along with CAC as summarized above. The exposure data were obtained from a space-time model of EPA monitor data linked to participants’ residential history data. A weak positive association was reported for PM2.5 exposure and CIMT, controlling for age, sex, race/ethnicity, socioeconomic factors, diet, smoking, physical activity, blood lipids, diabetes, hypertension, and BMI (1-4% increase per 12.5 μg/m3 increase in PM2.5). The heterogeneity of effects was examined by this study, and they reported that there was no evidence of any assessed effect modification, including age and sex.46
Kunzli et al57 used data from five clinical trials (the VEAPS, the BVAIT, the Estrogen in the Prevention of Atherosclerosis Trial, the Troglitazone Atherosclerosis Regression Trial, and the Women’s Estrogen Lipid-Lowering Hormone Atherosclerosis Regression Trial) to conduct a longitudinal analysis for assessing the association between PM2.5 exposure and CIMT progression. PM2.5 were derived from a geo-statistical model with data from the monitoring station and home outdoor mean concentrations were estimated.57 A positive, but not statistically significant association was reported for PM2.5 exposure and CIMT progression. For the effect modifications they tested, they found that associations did not differ by sex.57
Another cross-sectional study conducted by Bauer et al58 using the HNRS cohort estimated residential long-term exposure to PM2.5 using a chemistry transport model. The inter-decile range increase in PM2.5 was 4.2 μg/m3 and was associated with a 4.3% increase in CIMT.58 They evaluated several effect modifiers, including age and sex and found no statistically significant differences in the associations between PM2.5 exposure and CIMT.58
Furthermore, Adar et al49 using the MESA cohort data evaluated the cross-sectional and longitudinal associations between PM2.5 exposure and CIMT. The PM2.5 exposure was estimated over the previous year’s baseline and between ultrasounds of CIMT using a spatiotemporal model. This study suggested that higher long-term PM2.5 exposures were associated with increased CIMT progression and the reductions in PM2.5 exposure were related to slower CIMT progression.49 Among their evaluated effect modifiers, a stronger association was detected for women, but not for age,49 although this tested interaction was not statistically significant.
In summary, we considered five investigations that were robust to include both men and women for not only assessing long-term PM2.5 exposure and its effect on CIMT, but also evaluating if the strength of the PM2.5 effect differ by gender. Two of those studies (Adar et al49; Künzli et al50) reported that women may be at higher risk of PM2.5 exposure effects on CIMT as compared to men. However, although the other studies reported an increase in CIMT associated with PM2.5 in both men and women, there appeared to be no strong evidence of effect modification by gender.
DISCUSSION
Our review was able to build upon earlier work by Akintoye et al in assessing the association between PM2.5 and SCA and focused specifically on women in midlife who are postmenopausal or elderly. The results of our review indicate that middle-aged women may be a vulnerable group, but significant differences in risk exposure impact of PM2.5 particulate matter, as measured by typical subclinical atherosclerosis (SCA) measures the statistical evidence provided in the articles to date and reviewed by investigators here does not support a hypothesis of such a difference. However, we maintain our recommendation that group differences in risk exposure outcomes are a critical area of study and propose continued studies of the social impact of environmental pollution exposure, both acute and chronic, immediate, and cumulative. In this review, we identified several sources of methodologic heterogeneity which could explain the overall null findings.
A limitation of the existing work that evaluated the association between PM2.5 exposure and CAC risk is that most of the included studies only considered the overall association in the general population and were not designed to consider or sensitively detect or report any group differences by menopausal status. Only one recent study, by Wang et al42 evaluated the association among the subgroup of postmenopausal women, and showed a stronger association compared to the group of premenopausal women. No study has evaluated the effect of PM2.5 exposure on CAC progression in women. The MESA cohort that evaluated PM2.5 exposure and CAC association, included an older population (mean age=62), in which most of the women were postmenopausal; therefore, they were could not assess the impact of the menopausal transition on PM2.5 exposure and CAC risk.
Previous studies on the biological changes occurring among women, which may affect their cardiovascular health during midlife, may provide support for further work in this area. A study using both the Healthy Women Study cohort and the Women’s Healthy Lifestyle Project cohort reported that hormone-regulated changes, which commonly occur during menopausal transition, could potentially increase CVD risk and progression of subclinical disease.59 In addition, previous studies (e.g., SWAN) have also addressed this vulnerable period of menopausal transition for women effected by their reproductive or biological changes.60,61 Furthermore, in the Nurses’ Health Study, natural menopause was found to be associated with increased CHD risk (though this study did not adjust for age and smoking).62 Another study conducted in 2018 by Cabrera-Rego et al63 reported that the menopausal transition is associated with increased carotid arterial stiffness, independent of age.
To disentangle the effects of menopause transition and chronological aging on the PM2.5 exposure and CAC risk association, a longitudinal study with measures of the physiological changes during menopausal transition would be helpful to identify causal effects. There is an important opportunity going forward to incorporate women in midlife and the effects of chronic air pollution exposure on biomarkers of inflammation, hormonal measures, and their commensurate effect on cardiovascular disease. Future investigations both in the US and abroad are needed. However, the data regarding the role of menopausal transition when assessing the association between PM2.5 exposure and CAC is not well-substantiated, as this information was not collected within each investigation over time. As summarized above, the only work assessing menopausal status’s effect on PM2.5 exposure and CAC presence association considered baseline menopausal status cross-sectionally.42 They did not have further data available to explore the potential physiological changes occurring before or around menopause. This limited their ability to evaluate further on how menopausal status change may affect the association between PM2.5 exposure and CAC. The cross-sectional approach cannot take into consideration the heterogeneity of the changes occurring in women transitioning through menopause (e.g., changes in E2). Longitudinal analyses will be needed to explore the potential effect modification (e.g., factors changing over the menopausal transition) and their roles affecting the association between PM2.5 exposure and development of CAC. Measuring and modeling the association with repeated measures of covariates’ variables in a longitudinal framework that is more sensitive to subtle physiologic changes over time will produce different insights, as compared to cross-sectional approaches.
PM2.5 Exposure-inflammation Markers-CAC, among Middle-aged Women
Using 1,923 women (age range: 42-54) from the study of women’s health across the nation (Ostro et al64), a multi-center, multi-racial/ethnic, longitudinal study, investigators reported that chronic long-term PM2.5 exposure is associated with increased CRP levels. In this study, the association between PM2.5 and CRP was observed among the mid-life women with an even stronger effect in several susceptible subgroups, including those with high blood pressure.64 In addition, another SWAN study, by Green et al30 provided evidence that the exposures to PM2.5 in the preceding year are associated with adverse effects on inflammation (e.g., CRP) and hemostasis (a physiologic response to vascular injury) for CV outcomes. What’s more, a previous SWAN study by Wu et al61 reported gaseous air pollutants (CO, NO2, SO2) and the associations with increased thrombotic potential (formation of a blood clot) and cholesterol metabolism disruption which has been linked to atherosclerosis.65 Those studies provided insight on the potential pathway we could explore further through inflammation markers linking the PM2.5 exposure and CAC association.
PM2.5 Exposure-hormone-CAC, among Middle-aged Women
Furthermore, there is evidence showing the linkage between PM2.5 exposure and SCA through hormone level changes. Though the biologic mechanism of the interaction between PM2.5 exposure and menopausal transition to the CAC development remains uncertain, experimental, and animal studies have examined some potential mechanistic links. As indicated by the Nurses’ Health Study, it is likely that decreasing estrogen over the menopausal transition may alter the lipoprotein profiles, which could contribute to the development of SCA.66 Another SWAN’s study reported that women with higher E2 levels before menopause and then lower E2 thereafter were associated with lower odds of plaque, compared to women with the low E2 trajectory.67 Based on these study findings, it is possible that during the menopausal transition, fluctuating estrogen is a potential explanation for causing women during this period to become more vulnerable to the effects of PM2.5 exposure than general populations for SCA.68 Therefore, it is interesting to explore the role of menopause transition or hormone changes during the menopausal transition on the association between PM2.5 exposure and SCA.
The evidence above shows that a longitudinal observational cohort with those variables (e.g., inflammation markers, hormone levels) available will be helpful to explore the association between PM2.5 and CAC among middle-aged women with a focusing on considering the underlying biology of mid-life transitions. Evaluating the role of menopausal transition on PM2.5 exposure and CAC association could help target the populations of individuals at high-risk of CAC or high-risk period of increasing CAC risk for preventing CVD.
CONCLUSION
This overview considers the extent to which gender and specifically postmenopausal or older women may be at increased CVD risk for the health effects of PM2.5. Our study found from previous observational studies that there is equivocal evidence with some, but not all studies reporting associations between PM2.5 exposure and CAC presence or progression among the general population.42,43,44,45,46,47,48 Subgroups of postmenopausal and older women showed stronger associations between PM2.5 exposure and CAC. We conclude that there was limited evidence for the association of PM2.5 exposure in women and CAC, and little to no knowledge of the role of the menopausal transition in this association. To date, no study has been carried out on middle-aged women who are undergoing the menopause transition to specifically study this association. One important reason to pursue this study design is to elucidate potential mediators and/or effect modifiers that are expressed as part of the menopause transition, which might improve estimation of AP effects on women’s health. Key components of future research on this important question include longitudinal measures of physiologic changes (i.e., CAC progression) during menopausal transition. This will advance the field by narrowing the list of candidate pathways illustrated here and increase knowledge of the unique effects of AP on women’s health.
FUNDING
None.
ACKNOWLEDGEMENTS
NA.
CONFLICTS OF INTEREST
The authors declare that they have no conflicts of interest.


