INTRODUCTION
Diabetes affects 25.8 million people of all ages in the United States (US), which represents 8.3% of the US population.1 This is higher in Hispanics as evidenced by data from the Hispanic Community Health Study/Study of Latinos (HCHS/SOL), a population-based cohort study of Hispanic and Latino adults from diverse backgrounds, in which a diabetes prevalence of 16.7% in men and 17.2% in women was reported.2,3 Among the Hispanic groups studied in HCHS/SOL, Puerto Ricans had the highest prevalence of diabetes, particularly among women. In addition, results from the Behavioural Risk Factor Surveillance System in Puerto Rico (PR) also showed that the estimated prevalence of self-reported diabetes was >12%,4 which is among the highest compared to other states and territories of the US. Furthermore, a study in a representative sample of adults residing in the San Juan Metropolitan Area of PR showed that the prevalence of diabetes was even higher, with an age-standardized prevalence of pre-diabetes and diabetes, detected by Fasting Plasma Glucose (FPG) and/or HbA1c, as 25.5% and 47.4%, respectively.5 Diabetes is considered one of the leading causes of death in US and PR;6 therefore, this is an important health disparity to address among Puerto Ricans.
Growing evidence suggests that diabetes risk is associated with vitamin D status. A recent meta-analysis of 21 prospective studies with a total of 76,220 participants (mostly nonHispanic Whites) with about 5,000 incident cases of diabetes found a relative risk for diabetes of 0.62 (95% CI: 0.54-0.70) when comparing the highest with the lowest levels of 25(OH) D.7 For each 10 nmol/L increment in serum 25(OH)D levels, there was a reduction in the risk of diabetes of 4% (p<0.01).7 In addition, when 25(OH)D levels were near 50 nmol/l, the risk of diabetes was significantly reduced. Another meta-analysis of 19 cross-sectional, 13 case-control, and 12 prospective studies suggested that low serum 25(OH)D levels is associated with glucose intolerance, β cell dysfunction, and insulin resistance.8
Vitamin D deficiency is a public health concern, with a high prevalence worldwide.9 In the US, 32% of the population has vitamin D levels below 20 ng/mL.10 There is also a health disparity in vitamin D status. Hispanics are at high risk of low vitamin D status.10-15 Among 358 Hispanic-American men, the highest prevalence of vitamin D deficiency was found among those born in PR (26%), compared to those from the Dominican Republic (21%), Central America (11%), and South America (9%).16 Recently, we found in a large sample of 2,293 adults in PR that 72% had vitamin D insufficiency (levels below 30 ng/ ml) and 28% were vitamin D deficient.17
There is scarce information assessing the association between vitamin D status and glycemic in Hispanics. This is important to study as Hispanics have a higher prevalence of both diabetes and low vitamin D status, particularly Puerto Ricans. Therefore, to start addressing this gap in knowledge, we assessed whether there was an association between vitamin D and glycemic status in a clinic-based sample in Hispanic adults living in PR.
METHODS
The study was based on a retrospective, secondary analysis of medical records of patients attending the “Endocrinology, Diabetes and Metabolism Clinic” located in the municipality of Utuado in PR.
Participants
The study population consisted of non institutionalized individuals who attended this clinic for the first time between 2005 and 2013. A convenience sample was selected from those records meeting the following inclusion criteria: aged 21 years and older; having test results for Fasting Blood Glucose (FBG), Oral Glucose Tolerance Test (OGTT), and/or Haemoglobin A1c (HbA1c); and serum 25(OH)D levels taken within 3 weeks of each other. Patients using any type of vitamin D supplementation regimens were excluded from the study, as there was a large variation in the doses reported (from 400 to 10,000 IU/d).
Data Collection
A data collection sheet was used to extract the information from medical records, which included data on demographics, anthropometrics, blood tests results for 25(OH)D levels and glucose metabolism markers, and prescribed hypoglycemic agents, which could potentially influence vitamin D metabolism.
Demographics and other health measures
Gender and age, calculated in years at the time of the medical visit, were recorded from the medical records. Prescribed hypoglycemic agents were recorded as physician’s notes with names and doses used.
Anthropometrics
Body weight (pounds) and height (inches) were measured once by the clinic staff using a physician scale (Detecto, Model 338, MO, USA) while participants were wearing street clothes but no shoes. These measurements were converted to kg and meters. Body Mass Index (BMI) was calculated as the ratio of weight (kilograms) to the square of height (meters).
Blood tests
Laboratory test results dates were recorded from the medical records as month/day/year. All blood test results were taken after an overnight fast. Results from serum 25(OH)D levels were recorded in nanograms per millilitre (ng/mL) and these were analyzed by two methods. The main method used by 97% of the samples was immunoassay and only 3% were performed with Liquid Chromatography mass spectrometry (LC-MS/MS). Due to methodological differences between these methods,18 only blood test results analyzed by immunoassay were included. Serum 25(OH)D levels were measured by the local laboratory using a commercially available enzyme immunoassay kit (IDS 25-Hydroxy Vitamin D EIA kit). The blood tests were collected all year round and the date of the serum 25(OH)D was recorded to adjusted for seasonality. Since the half-life of 25(OH)D levels is 2-3 weeks,18 only blood tests results measured within this period were included in the analyses.
Although there is no universally accepted cut-offs for serum 25(OH)D levels, the Institute of Medicine (IOM) established that serum 25(OH)D levels above 20 ng/ml (50 nmol/l) are optimal and sufficient to maintain bone health.19 However, the Endocrinology Society defines vitamin D deficiency as 25(OH)D levels below 20 ng/ml and adds a category for vitamin D insufficiency (levels 21-29 ng/ml; 52-72 nmol/l).20 Furthermore, the Endocrinology Society also states that levels above 30 ng/ml (75 nmol/l) provide increased overall health benefits, such as reducing the risk of diabetes. Therefore, for the present study, vitamin D status was classified as: deficient if serum 25(OH)D levels were <12 ng/ml (30 nmol/l); inadequate if levels were 12-20 ng/ml (30-50 mmol/l); insufficient if levels were 21-29 ng/ml and optimal as levels ≥30 ng/ml.
The markers for glucose metabolism recorded were Fasting Blood Glucose (FBG), HbA1c, and 2-hour Plasma Glucose (2hPG). These were measured routinely by local laboratories; glucose levels were measured by Spectrophotometry and HbA1c by HPLC. Individuals were classified as having diabetes by using the following criteria: HbA1c ≥6.5%; FBG ≥126 mg/dl (≥7.0 mmol/l); and/or 2hPG≥200 mg/dl (≥11.1 mmol/l)21,22 or if use of hypoglycemic agents was documented in the medical record.23 The following criteria were used to classify pre diabetes: HbA1c 5.7-6.4%; FBG 100-125 mg/dl; or a 2hPG≥140 (≥7.8 mmol/l) and <200 mg/dl (<11.1 mmol/l).21 Normal glucose status was defined as HbA1c <5.7%; FBG <100 mg/dl; and/or 2Hpg of <140 mg/dl (<7.8 mmol/l).21
This study was approved by the Institutional Review Board of the Medical Sciences Campus (MSC) of the University of Puerto Rico (UPR). In addition, the clinic director provided written authorization to access all medical records. To assure confidentiality, all data collection sheets were stored in a locked room in the Nutrition Program of the MSC UPR Graduate School of Public Health.
STATISTICAL ANALYSIS
Baseline characteristics were summarized using mean and Standard Deviation (SD) for continuous variables and frequency distributions for categorical variables. Analysis of Covariance (ANCOVA) was used to assess differences in age-adjusted mean serum 25(OH)D levels across glycemic status (normal, pre diabetes, and diabetes). Bonferroni’s posthoc test was used for multiple comparisons. Pearson’s correlation coefficient was used to assess the correlation of serum 25(OH)D with glucose parameters. A multinomial logistic regression model was used to assess the association between vitamin D and glycemic status after adjustment for age, gender, BMI, and season. All analyses were performed using SPSS Statistical Package (SPSS version 21.0 for Windows, 2012, SPSS Inc., Chicago, Il.). Statistical significance was set at p<0.05.
RESULTS
From 1,379 consecutive medical records reviewed, 716 (52%) records met the inclusion criteria. A total of 89 records reported the use of vitamin D supplements and 574 did not have the levels of serum 25(OH)D or any of the glucose measures reported or were not done within 3 weeks of each other; therefore, these were excluded from the analyses. The descriptive characteristics of the study sample are presented in table 1.
Table 1: Descriptive statistics of the sample (Mean ± SD† or %)
|
Characteristic
|
|
Total |
|
|
Males |
|
|
Females |
|
| n |
mean |
SD |
n |
mean |
SD |
n |
mean |
SD
|
| Age (y) |
716
|
54.1 ± 14.9 |
263 |
53.8 ± 13.9 |
453 |
54.3 ± 15.4
|
| BMI (kg/m2 ) |
693
|
30.1 ± 6.3 |
255 |
30.4 ± 5.8 |
438 |
29.8 ± 6.5
|
| 25(OH)D (ng/ml) |
716
|
24.3 ± 8.6 |
263 |
25.5 ± 8.4 |
453 |
23.6 ± 8.6*
|
| Vitamin D Status (%) |
| Deficient (<12 ng/ml) |
39
|
5.4 |
10 |
3.8 |
29 |
6.4
|
| Inadequate (12-20 ng/ml) |
192
|
26.8 |
63 |
24.0 |
129 |
28.5
|
| Insufficiency (21-29 ng/ml) |
319
|
44.6 |
120 |
45.6 |
199 |
43.9
|
| Optimal (≥30 ng/ml) |
166
|
23.2 |
70 |
26.6 |
96 |
21.2
|
| FBG (mg/dl) |
697
|
122.8 ± 57.7 |
259 |
132.8 ± 64.6 |
438 |
117.0 ± 52.4*
|
| 2h OGTT (mg/dl) |
280
|
141.3 ± 68.2 |
100 |
154.1 ± 77.5 |
180 |
134.2 ± 61.5*
|
| HbA1c |
547
|
6.9 ± 2.0 |
218 |
7.2 ± 2.2 |
329 |
6.8 ± 1.8*
|
| Glycemic Status (%) |
| Normal |
216
|
30.2 |
60 |
22.8 |
156 |
34.4
|
| Pre diabetes |
201
|
28.1 |
77 |
29.3 |
124 |
27.4
|
| Diabetes |
294
|
41.1 |
125 |
47.5 |
169 |
37.3
|
| Use of hypoglycemic meׁdications |
| No |
278
|
38.8 |
115 |
43.7 |
163 |
36.0
|
| Yes |
438
|
61.2 |
148 |
56.3 |
290 |
64.0
|
*p<0.05 compared to males by t test. † Age-adjusted means.
Most participants were females (63.3%) and mean age was 54.1±14.9 years. Most patients were overweight (38.8%) or obese (46.3%), had suboptimal vitamin D status (76.8%), had undiagnosed diabetes according to laboratory criteria (55.8%), and 39.1% were taking hypoglycaemic medications. Serum 25(OH)D levels and FBG were significantly higher in men compared to women (p<0.05).
Figure 1 shows the difference in mean 25(OH)D levels by glucose status. Overall, individuals classified as normal glucose status had higher 25(OH)D levels than those with diabetes (p<0.001), whereas subjects with pre-diabetes had higher 25(OH)D levels than those with diabetes (p<0.01). No significant difference was observed between subjects with normal glucose and those with pre diabetes (p=0.78). When analyzed separately by gender, those with normal glucose status had higher 25(OH)D levels than those with diabetes (p<0.001), but no significant differences were found in vitamin D levels between those with pre-diabetes and those with diabetes).
Figure 1: Difference in 25(OH)D levels by glucose status, according to gender
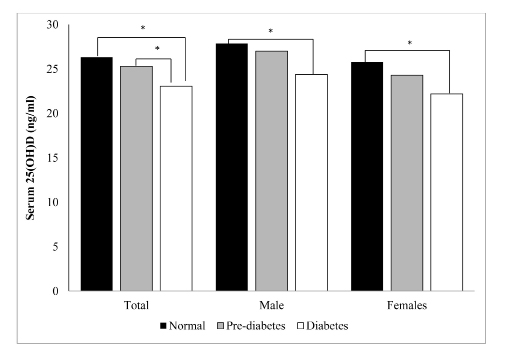
p<0.05 by ANCOVA, adjusting for age
Correlations between 25(OH)D levels and glycemic parameters are shown in table 2. There was a significant inverse correlation between 25(OH)D levels and FBG (p<0.001), whereas participants with lower 25(OH)D levels had higher FBS levels in the total sample and in males. Similarly, there was a significant inverse correlation between 25(OH)D levels and HbA1c levels overall and in men (p<0.001), whereas those with lower 25(OH)D levels had with higher HbA1c levels. No correlation
was seen with 2h-OGTT.
Table 2: Pearson’s correlation† between 25(OH)D levels and glycemic parameters
|
Glycemic Parameters
|
Total |
Male |
Female
|
| FBG |
– 0.10*
|
– 0.18* |
– 0.09
|
| 2h OGTT |
– 0.01
|
– 0.04 |
– 0.04
|
| HbA1c |
– 0.11*
|
– 0.23** |
– 0.04
|
In the multinomial logistic regression model, decreased serum 25(OH)D levels were associated with diabetes after adjusting for age, gender, BMI, and seasonality (Table 3). However, this was not observed with pre-diabetes status.
Table 3: Multiple logistic regression of the association between 25(OH)D levels and risk of pre-diabetes and diabetes.
|
Odds of pre diabetes (95% CI)
|
| 25(OH)D (ng/ml) |
|
Crude
|
P value |
Adjusted* |
P value
|
|
<12 ng/ml
|
2.459 (0.671, 9.014) |
0.174 |
2.140 (0.556, 8.231) |
0.268 |
|
12 – 20 ng/ml
|
1.365 (0.725, 2.571) |
0.335 |
1.222 (0.616, 2.424) |
0.567
|
| 21 – 30 ng/ml |
1.296 (0.762, 2.203) |
0.338 |
1.392 (0.787, 2.462) |
0.256
|
|
>30 ng/ml
|
1.00 |
|
1.00
|
|
|
Odds of diabetes (95% CI)
|
| 25(OH)D (ng/ml) |
|
Crude
|
P value |
Adjusted* |
P value
|
|
<12 ng/ml
|
4.727 (1.566, 14.275) |
0.006 |
4.195 (1.287, 13.666) |
0.017
|
|
12 – 20 ng/ml
|
2.373 (1.419, 3.970) |
0.001 |
2.422 (1.348, 4.354) |
0.003
|
|
21 – 30 ng/ml
|
1.500 (0.963, 2.335) |
0.073 |
1.773 (1.068, 2.942) |
0.027
|
|
>30 ng/ml
|
|
1.00 (reference)
|
|
*Adjusted for age, gender, BMI and seasonality
DISCUSSION
In the present study we found that mean serum 25(OH) D levels were significantly lower in individuals with diabetes compared to those with normal glycemic or pre diabetes. We also found a significant inverse correlation between serum 25(OH)D levels and glucose parameters, i.e., FBS and HbA1c, particularly in males. In addition, we found that risk of diabetes increased as levels of serum 25(OH)D levels decreased.
The inverse correlation between serum 25(OH)D levels and HbA1c found in the present study has also been reported in the US using data from the National Health and Nutrition Examination Survey in different racial/ethnic groups and in Caucasians from Italy.24,25 Also, studies have found an inverse correlation between serum 25(OH)D levels and FBS, 2h-OGTT, and HbA1c in Caucasians in Germany and Finland (p<0.001).23,26 We were unable to detect a significant negative correlation between 25(OH)D and 2 hours OGTT; this could be explained by the fact that insulin resistance was not reported in the medical records to make corrections in this variable, which is known to affect glucose metabolism.
The present study also found an increase diabetes risk as serum 25(OH)D levels decreased, which is consistent with the meta-analysis of Italian, British, Turkish, and Austrians cohort studies reported by Pittas et al.8 Similarly, studies in individuals from southern Spain and from Greece have also found a higher incidence of diabetes in individuals with lower vitamin D status.27,28 Furthermore, a study in Sweden found that individuals with pre diabetes and diabetes had lower vitamin D status compared to those with normal glycemia,29 similar to results from the present study.
A possible mechanism for the relation between vitamin D status and diabetes is the presence of specific vitamin D receptors in pancreatic beta cells, which improves the function of insulin secretion.30 A recent review suggests that vitamin D deficiency may lead to variations in insulin secretion, glucose intolerance, and diabetes, through a direct action of the vitamin D receptors activation or indirectly through calcemic hormones and also via inflammation.31 Vitamin D may lower insulin resistance by its effect on phosphorus and calcium metabolism and by its effect on the regulation of the insulin receptor gene.32
Differences in the recommendations from the IOM and the US Endocrine Society’s Practice Guidelines for the classification of vitamin D status reflect different goals and views on current evidence. Using the cut-off points established by the IOM, there are less individuals considered to have inadequate vitamin D status. The IOM levels were established with an endpoint in bone health while the Endocrine Society’s cut-off points are more related to optimizing health for preventing endocrine related disorders, such as diabetes. Our results support the views of the Endocrine Society, as our study found that those with serum 25(OH)D levels >30 ng/ml had significantly lower risk of diabetes. Therefore, it is recommended that these cut-off points be used when considering the clinical management of patients with diabetes in this population of Puerto Ricans.
The present study provided the opportunity to describe the association between serum 25(OH)D levels and diabetes using a large sample of Hispanic adults in PR. The use of serum 25(OH)D as a measure of vitamin D status is an important strength because this measures total vitamin D (D2 and D3) status, which reflects vitamin D intake as well as vitamin D synthesized in the skin upon exposure to sun. However, our study has some limitations that merit discussion. First, the temporal relationship between vitamin D and glycemic status cannot be assessed in this cross sectional study. Second, this study was done at a single endocrinology clinic, thus our data are unlikely to be representative of the Puerto Rican population. Third, data on known
and suspected risk factors for diabetes were not readily available (such as physical activity, family history of diabetes, central obesity, hypertension, dyslipidemia, and blood pressure), thus their potential confounding effects were not assessed. Longitudinal studies should be performed to confirm our findings in a larger and representative sample of Hispanics.
CONCLUSION
In conclusion, low vitamin D levels significantly increased the odds of diabetes in this sample of Hispanic adults in PR. Given that diabetes is one of the leading causes of death in US and PR and that Puerto Ricans have the highest prevalence of both diabetes and low vitamin D status compared to the US and other territories, it is important that health professionals regularly screen for vitamin D status and offer interventional strategies to correct vitamin D deficiency. These results may have significant public health implications for defining potential intervention and management of diabetes that may be easily implemented in the clinical setting in this high risk population.
NEW CONTRIBUTION TO THE LITERATURE
Low vitamin D status has been significantly associated with diabetes in other populations, mainly Caucasians; however, there is limited information in Hispanics, a group with a high prevalence of both diabetes and low vitamin D status. The present study confirms this association in a group of Hispanic adults in PR and adds to the available evidence for routinely screening this population for vitamin D deficiency.
ACKNOWLEDGMENT
This study was supported in part by Award Number 8G12MD007600 from the National Institute on Minority Health and Health Disparities. The content is solely the responsibility of the authors and does not necessarily represent the official views of the National Institutes of Health. We are grateful to Dr. Juan J. Maldonado-Rivera for his cooperation in the access to the medical records of his clinic.


