INTRODUCTION
In order to stay at todays’ healthy and successful competition, if we are not better than any of our global competitors, we should at least be as well as them. Lean thinking, as the antithesis of Muda, provides some techniques in which the value creation activities can run in required time and prevent additional activities. Basically, lean thinking is called Lean because of providing ways in which the lowest rate of (manpower, equipment, time and space) will be used and the most will be accomplished.1 In fact, lean production was one of the new viewpoints proposed after mass production. Lean Manufacturing is a philosophy and approach that seeks to remove and eliminate any additional process of preparation of raw materials to manufacturing and ultimately selling that does not create extra value. In this regard, one of the most important tools is known as value stream mapping. Discussions of lean and other methods of manufacturing are knot up with automotive industry. In Indeed, with attention to comprehensive concepts of lean production and its goals and flexibility, it can be certainly concluded that this method is by no means unique to a particular organization, so it can be run on all systems.2,3
For implementation of lean manufacturing, many tools are highly proposed while one of the most important ones is the value stream mapping. The value stream map includes two maps of the current situation and the future situation. Current situation map provides an image of the entire production process (including the activities of creating and not-creating value) for managers and executives and the future situation map develops a clear path for implementing lean system on intended system, to be able to apply lean concepts for running the program, continuously and consistently rather than doing lean operation in an irregular and unplanned process.4 According to learning lean production techniques abilities in manufacturing sectors which are rarely applied in service sectors, in the present paper, the value stream map technique is utilized for 227 patients in the Public and Emergency Departments. Using ARENA simulation software for testing differences in the comparison, every process including patients arrival to the clinic and getting out of will be examined. Following that, a map will be drawn according to the current situation and enhanced value stream map will be drawn regarding to suggestions for improvement. At the final step, results of both the maps will be statistically compared.
Muda is a Japanese word means waste. It is any human activity that consumes resources but creates no value. There are many types of wastes, commonly known as septet wastes. In fact, Muda is everywhere, but fortunately there is an effective antidote for that and that is Lean or better to say Lean thinking. This method is called Lean in brief because of the lowest resources (i.e. less manpower, less equipment, less time and less space) is used or consumed for doing the most and at the same time with appropriate supply of consumers. Lean manufacturing uses tools to resolve the wastes in which the value stream map is one of the most practical ones. The value stream is a set of all necessary actions to provide a certain product (such as a product, a service or a combination of both). Identifying the value stream, which helps to Muda recognition, is an important step that a lot of organizations rarely have to take the above action.5 In a large integrated manufacturing industry,6 Abdulmalek et al used the value stream map tool to identify potential dynamic gains from implementing lean production concepts. Considering ways to eliminate waste and using ARENA simulation software, they had chance to improve flow maps over the industry.
Vinodh et al7reviewed the practical implementation of value stream maps to solve problems in gear production line in India in which the desired product family was firstly produced and the current situation map was designed. Following that, waste for recovery was identified and future map was designed and ultimately practical inference was done. A significant reduction in cycle time and working during processing were consequently observed while simulation method is also utilized to check the improvement of production performance.
In order to detect defects and waste and non-valuable activities, Satish Tyagi8 developed his value stream map and added steps in the current situation maps gas turbine to eliminate wastes in walking process, questions to determine the root causes of problems was asked from experts and future plan was prepared after providing the wastes. At the same time, DT Matte9 used a 12-stage framework for drawing the current map and identifying weaknesses and drew the future map using the proposed guidelines. Results indicated that there was no complete inventory in units and there were significant differences in cycle time and overall time which the system provides a lean production expectation.
In the field of software engineering at Sweden Sony Ericsson Company, Numan Bin Ali et al10 evaluated the simulation by value stream map for software development. That was a very useful way to overcome significant limitations on the use of simulation especially insightful discussion.
Rajeev Chadha et al11 made a study to prepare a model for the integration of queuing and lean methods to improve dynamic performance, the Indian SD hospitals, emergency health care system evaluates a dynamic system models and re-designs the process by value stream mapping to eliminate non-valuable activities to achieve timely service. Robert James Carfolio et al12 investigated the removal of useless parts of a process in lung hospital lobotomy operation. At the beginning of their research, they divided all patients into groups of 300 lobotomy patients. After drawing and analyzing the current map, many unnecessaries removed from operation and arrival time to the operating room and mortality rate has been improved. In another study which focuses on hospital outpatient departments, Richard Miller et al13 had a survey collecting relevant data through observation and questionnaire for applying the lean tools for some unique health issues in developing countries. Analyzing the lack of planning and what was found following five-whys resulted to clarify the current plan for the main driver of losses in patient flow system. Applying the proposed corrections revealed that the average waiting time for patients and the labor productivity have been improved.
Emily Lee et al14 provided a learning structure on how to make a value stream map in a hospital magnetic resonance imaging (MRI). Drawing value stream map and proposing solutions, which were following a general understanding of the needs and expectations, showed a clear improvement over different periods.
Dickson et al15 evaluated the implementation of lean principles in the Emergency Department and published results in their research work. They run the lean implementation with the purpose of promoting employees and customers’ satisfaction by required tools such as Kaizen and also value stream mapping. Results showed that the organized lean is appropriate to the environment which made some desired improvements. According to the articles mentioned and various studies that were raised in the spheres of production and services, it is obvious that the use of value stream map in services sphere, is mostly in the health section. This may be on because of this increased risk-taking and interconnected relation with the health and lives of human beings. In the present research, the main aim is to use value stream map tools in order to identify and eliminate waste in a medical ward and provide ways for being better.
METHODOLOGY
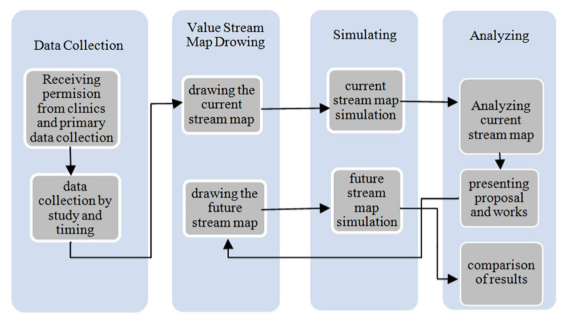
In this section, the proposed procedure is defined including four steps of data collection, drawing value stream map, simulation process and analyzing as shown in Figure 1. For each step, the transactions with the other steps are also defined using more detailed process followed and following to the others. The relationships between the proposed steps are also illustrated by arrows. In brief, more detailed information is provided by observation and time measuring following data collection. The stream map in the current situation is drawn for using in simulation step. In this step, the current map is simulated and analyzed. In the next step, weaknesses are identified and suggestions are given for improvements. The future map will be drawn according to solutions derived by analyzing the current problems. This map is consequently analyzed in simulation step followed by investigating outputs and comparing the results of both current and future value stream maps.
Figure 1: The proposed procedure to improve hospital care system.
One of the most important steps must be conducted in such kinds of this research work is data gathering. Since, the improving techniques should also been compared by waiting time, observation and interview methods of data gathering have been applied to collect data. In order to use data by simulation software, the common software of EASYFIT has been utilized to determine data distributions. Collected data for each process analyzed by the above software and the most appropriate distribution function targeting the highest ranking for the intended data has been selected. Then the current map has also been drawn according to observation and personal interview following the use of simulation software of ARENA. Simulation results analyzed in terms of strengths and weaknesses points of the process and showed that there are some recommended notes for improving the process. In order to compare results and validate the proposed improving hints, the future stream map has also been drawn and the simulation results statistically analyzed.
Current Situation Value Stream Map
The procedure and improving notes have been applied in a case study of hospital in the Northern Iranian city of Rasht. This is located on the Namjoo Street of Rasht City, the capital of Gilan Province. All medical activities are operated under the official contracts with health insurance companies but non-insurance patients are also visited paying more money. The selected clinic includes various specialized fields including general (emergency), radiology and more. In some specific buildings, there are a variety of parts separated in weekdays and work in different hourly shifts of morning and evening. The emergency part of clinics includes two sectors of nursing sector (first aid) and public medical sector. The average number of 250 to 350 patients daily refer to the public buildings Environmental Management System (EMS). Since, the value stream map tool is a try and error tool namely paper and pencil method, the current value stream map has been drawn by visiting the entry and exit track of the emergency patients as well as the procedures that each patient should spend over the process. Both spending and waiting times are also collected for each process done at the research scope. It is obvious that the drawn stream map is literally retrieved from the real situations of emergency without involvement of personal logic and advises. An overall view of the value stream map articulated by software has been drawn as below.
Analysis of the Current Situation Map
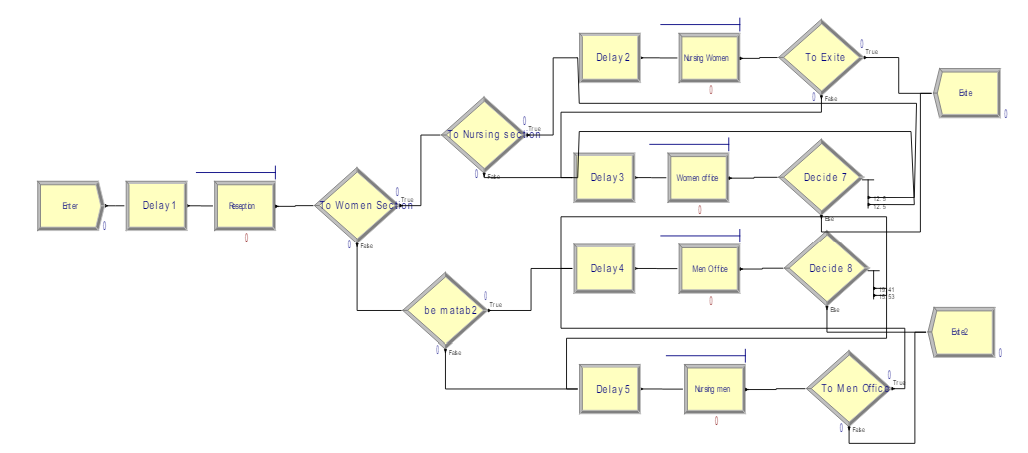
Observing the process and patient flow activities which have been summarized as current situation stream map revealed that there are many problems and different wastes over the process. Problems have been classified regarding to the defined septet wastes and tabulated in Table 1. As it can be observed, any problem in the clinic, which has been selected as case study is related to its own corresponding waste (Figure 2).
Figure 2: Current situation value stream map.
| Table 1: Identification and classification of septet wastes. |
|
Observed problems
|
Type of wastes
|
| Getting additional information from patients on admission sector
Paper work roles (patients who come just for nursing affairs, in addition to filling in the form, specify the type of insurance they receive from accepting sheet.) |
Waste of over production |
| Unnecessary trips of receptionist and nurses |
Waste of additional motions |
| Unnecessary form filling out.
Inappropriate nursing rest period.
Incorrect ordering work stations.
No board, sheet or brochure to introduce the specialties of the clinic divided day and hour separately.
The lack of a telephone answering systems and IVR. |
Waste of unnecessary inventory and lack of essentials
|
| Frequent and redundant questions from patients.
Rework in returning patients to the doctor to know the way of taking the drugs.
Back to doctor in order to eliminate duplication errors in the insurance.
The lack of a properly arranging for women nursing.
Lack of Elevator and problems for patient transport. |
Losses resulting from defective production |
| Waste time and delays due to faulty during use of some medical equipment and crash them.
Waiting time to fill out the form at the reception.
Waiting time for receiving bills and lack of POS.
Waiting time while using medical affairs and entering the patient to the clinic because of gender segregation of patient and doctor.
Waiting time in nursing.
Waiting time to show the drug to the doctor when the receptionist is busy.
Waiting time due to carelessness of receptionist the waiting time due to absence of doctor in clinic and unnecessary Attendance in the area and negligence of receptionist from notifying the doctor. |
Waste, resulting from the long waiting time. |
| Patient transmission from nursing section to the doctor’s clinic to demonstrate the drug and doctor confirm. |
Wasting time for transportation |
| A mismatch between jobs and workers (no proper use of the operator, and lack of motivation)
Irregularities in the stations
The lack of patient’s accurate awareness of the number of waiting patients and in some cases , facing with high volume of patients
Lack of sufficient attention to the prioritization of patients to determine the severity of sickness |
Waste resulting from the addition operation |
Proposed Improvements Solutions
After identifying all wastes over the various clinical processes, some solutions for waste elimination and improving notes for current situations can be proposed at this stage. They should be proposed according to lean production principles followed as below:
*Reduction on waiting times at reception and nursing is required and possible.
According to the maximum waiting time that is taken place at the reception section, particularly in the early hours of the morning and when around 68 percent of patients enter with armed forces insurance, a special e-card for treatments of armed forced employees and members can be considered to prevent high expectation time in reception.
* Reduction on waiting time for the female and male patient entrance to the clinic is also recommended.
Due to existence of the strategy of gender separation of patients and doctors waiting time is currently created. According to waiting time for male and female patient separation, using a systematical Kaizen will improve waiting time if the above strategy is abolished. This is a very potential way to improve waiting time in particular when there is no same gender doctor available at the time.
* Other fixes in waiting time are also proposed.
A payment object system (POS) can improve operators’ accuracy at the desk where receptionists involve for payment activities.
* Getting less information from patients is useful for improving waiting time.
All forms include many parts of required data collection. Review proposed forms and remove unnecessary items are highly recommended.
* Paper work can be omitted from the process.
Remove unnecessary references from the reception to the nursing section. Some of papers can be substituted by electronic procedures.
* Lack of proper workstation setup.
According to the concepts of 5S which are usually mixed with value stream map technique, improving suggestions are to determine the right workstation and using a guidance tableau in front of the entrance part of patient admission located at emergency room.
* Lack of a proper accountability system and IVR telephone
Establishing an answering machine system and IVR to respond and fix problems caused by the lack of basic information would be useful for decreasing waiting time.
* Omitting dual referring to doctors for showing drugs and receiving instructions.
About 50% of the patients, return to the doctor just for showing drugs and receive prescription. If they justify at the pharmacy when taking the drugs, there is no need to return to doctor.
* Elimination of human errors.
Using the Poka-yoke tool in each section will improve process and minimize unintentional errors.
* Transmission from nursing section to the doctors.
If nurses are much careful in relevant part, a lot of unnecessary referrals to doctors will be prevented.
* Matching more between jobs and working.
By using five-why technique, the root of some problems will be identified and operator compliance with their jobs will be decreased. In fact, when there is no motivation or energy to do things errors increase and accuracy reduces over the procedures.
* Getting exact information about the number of patients.
Installing an electronic sign at the emergency room can improve the aware of waiting patients for the doctor and nursing affairs and provide an approximate plan for the admission to the emergency.
* More attention to prioritize patients according to the severity.
Lack of time, the bustle of reception and lack of the necessary commitment are generally included over the procedures. In order to eliminate them and patient severity recognition, installing health care electronic cards and job-workers matching system are recommended.
Improved Value Stream Map
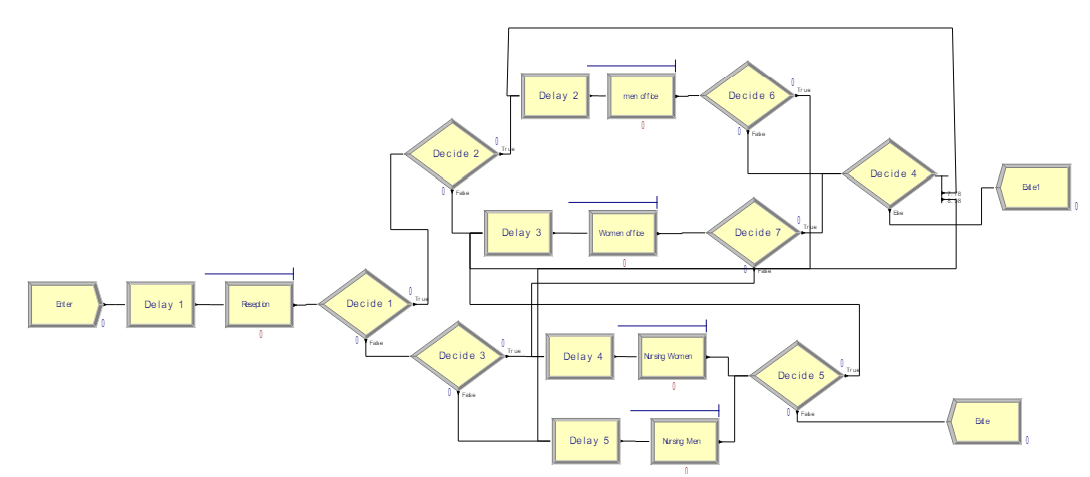
According to the proposed solutions and apply some important solutions, the current value stream map can be redesigned and its results can be compared. The improved value stream map has been redesigned shown in Figure 3.
Figure 3: Proposed (Future) value stream map.
METHODOLOGY VALIDATION
Since, it is necessary to validate the proposed methodology; simulation technique is utilized to compare the current and future stream maps indexes followed by statistical test.
Simulation
Both value stream maps including the current and future have been simulated for 30 days using the software of ARENA according to the sample of 227 patients and results are tabulated in Table 2. According to other results derived from simulation, it can be concluded that the maximum waiting time and maximum queue length are strongly related to the reception section. It seems that there is a bottleneck in the above mentioned section. Comparing selected criteria revealed that the average occupation time at the reception is the maximum amount of 36.588 minutes.
| Table 2: Simulation results for current and future value stream maps. |
|
Future Value Stream Map
|
Current Value Stream Map |
|
| Maximum |
Minimum |
Average |
Maximum |
Minimum |
Average |
Criterion
|
|
60.984
|
0.00 |
6.96 |
52.308 |
0.6294 |
8.256 |
Processing time per person (VA Time) (min) |
| 106.380 |
0.00 |
6.504 |
112.548 |
0.00 |
12.840 |
Waiting time (min)
|
|
135.834
|
0.00 |
13.488 |
128.136 |
1.8876 |
21.096 |
Total time (Total Time) (min) |
| —— |
—— |
11214 |
—— |
—— |
11356 |
Number of patients entered to system
|
|
——
|
—— |
11211 |
—— |
—— |
11346 |
Number of patients exited from system |
| 16 |
0 |
3.500 |
28 |
0 |
5.547 |
The number of patients at any given moment (WIP)
|
Comparing the results of improved stream map simulation with ones of current stream value map revealed that the maximum waiting time is related to the nursing section with a median of about 6.426 minutes and the maximum length of the queue, the queues in medical offices with an average of 15.42 minutes. To understand the improvement of the value stream map simulation more accurately, more comparing results are also tabulated in Table 3.
As shown in Table 3, the average waiting time has been improved as much as 6.336 minutes. This improvement is very significant because it recognizes the right suggestions. In fact, by reducing the processing time and zero waiting time for about 60 percent of patients, waiting time for a large part of the remaining patients is reduced and in most cases comes to zero.
| Table 3: Value stream map improvement. |
|
Maximum
|
Minimum |
Average |
Variable |
| 8.676 |
0.6294 |
1.296 |
The improvement in processing time per person (VA Time) (min)
|
|
6.168
|
0.00 |
6.336 |
The improvement in Waiting time (Wait Time) (min) |
| 7.697 |
1.8876 |
7.608 |
The improvement in Total time (Total Time) (min)
|
|
12
|
0 |
2.047 |
The improvement in The number of patients at any given moment (WIP)
|
Statistical Data Analysis
In order to make a statistical test to compare the average waiting and processing times, the well-known test of standard normal test (Z-test) is used due to the large number of samples.16 In this case, comparison is made for two different samples with different variations. So, hypothesis test for waiting time is done as below in which µ1 and µ2 are average waiting times of the current and future stream maps, respectively.
H0: µ1=µ2=0
H1: µ1-µ2>0
Sample size is n1=n2=227 and the null hypothesis is that the waiting times for both current and future stream maps are equal while the competitive one is that the average waiting time for the future map is smaller than the current map. Confidence interval (CI) is considered as 95% and computation results show that the average and standard deviations for waiting time are calculated as below:
x̅1=6.678414, x̅2=2.123348, S1=6.631757, S2=5.983956,
α=95%, Zα=Z0.95=1.645
So, the statistical measure is now calculated as below:
Since, the statistical measure is more than critical value (Zα=Z0.95=1.645), the null hypothesis is rejected and it is concluded that waiting times for the current and future maps are significantly different as well as the future stream map will reduce the average waiting time.
The above test can be also utilized for processing time. Hypothesis test for processing time is as below in which µ1 and µ2 are average processing times of the current and future stream maps, respectively.
H0: µ1=µ2=0
H1: µ1-µ2>0
Considering confidence interval of 95%, computation results for processing time, while the sample size is n1=n2=227, are as below:
x̅1=6.678414, x̅2=2.123348, S1=6.631757, S2=5.983956,
α=95%, Zα=Z0.95=1.645
So, the statistical measure is now calculated as below:
Since, the statistical measure is more than critical value (Zα=Z0.95=1.645), the null hypothesis is rejected and it is concluded that the processing times for the current and future maps are significantly different as well as the future stream map will reduce the average processing time.
DISCUSSION
Because of the importance of paying more attention to the healthy services, the concepts of lean manufacturing principles have been applied to reduce waste and improve the overall look in a polyclinic. For this purpose, some specific examples of patients and all relevant processes from patients entering and out-going from a clinic in Iran have been investigated using the well-known technique of value stream map. For individual processes through observation and timing, the necessary data were collected and the current value stream map was drawn. In many sectors, weaknesses appeared and wastes identified from the procedures. Some improving notes have been proposed to eliminate waste and anticipated problems. At the next step, the improved value stream map was drawn and both the stream maps using ARENA software were simulated. In the emergency room, results showed that the suggested solutions made improvements of 6.336 and 1.296 minutes in waiting time and processing time, respectively. Statistical analysis utilizing standard normal test also shows that there is a significant difference between waiting time and processing time for the current and future stream maps.
CONCLUSION
In brief, results showed that the existing strategies and suggestions are capable to improve health care system in emergency room. So, the value stream map can be used as an efficient tool in service sections as well as manufacturing systems. Since, the proposed solutions may not be applied in different hospitals or situations, future researches are recommended to focus on prioritizing the solutions using ranking techniques such as analytical hierarchy procedure.
CONFLICTS OF INTEREST
No funding or financial support from fellowship, scholarship or any sponsors have been gained by author. Therefore, authors declare that there are no conflicts of interest regarding the publication of this article.


