INTRODUCTION
Background
Oral and maxillofacial (OMF) region includes nasal cavity, sinuses, the lips, oral cavity, maxilla, mandible and the major and minor salivary glands with the overlying skin and soft tissues.1 This area is common site for different lesions, including the inflammatory and neoplastic lesions.2 Neoplastic tumors, in the area, account 5% of all human Neoplasia. Due to the anatomic complexity of the area, inflammatory masses and tumors affecting oral and perioral tissues often present a diagnostic challenge to the pathologist and the surgeon.3
There are many benign masses on this site including cysts, polyps and inflammatory lesions. The malignant masses usually found in this region include sarcomas of soft tissue and bone, carcinomas and lymphomas rarely melanomas. Some of these cancers however are metastatic from distant sites such as the breast, lungs, abdominal organs or even the prostate gland. The age at diagnosis of these masses is between 9-months to 80-years with 90% of the patients being over the age of 40-years.4
Tumors in the OMF region are unique due to the obvious cosmetic defect and functional impairment of the anatomically related aero-digestive tract. Orofacial tumors are known to exhibit geographic variations in prevalence and pattern due to cultural, social, occupational or climatic factors.5
In Ethiopian researches that focus on histopathologic patterns of OMF masses with respect to factors such as anatomic sites, age, sex and histologic type are few. Especially on the south western part, no research is available on the topic. Lack of studies on the above associated factors have created huge gap on the understanding of the tumor burden and distribution in the study area resulting difficulty of understanding the distribution, early detection, diagnosis, interventions and management of the problem.
The aim of this study is to determine the histologic types, prevalence and socio-demographic distribution of OMF masses in south western Ethiopia.6
Objectives of the Research
To assess the histopathologic patterns of OMF masses with respect to age, sex and anatomic site in southwestern Ethiopia from September 11, 2016 to September 10, 2021.
MATERIALS AND METHODS
It is a retrospective study in which, among a total of 7,224 biopsies received from September 11, 2016 to September 10, 2021, conveniently, 385 histopathology reports of OMF specimens were retrieved from the pathology department data archive and 377 reports that fulfilled the inclusion criteria were manually selected and then grouped by year which was important to see the trend of OMF biopsies in each year clearly. Non-probability convenience sampling method was used and all cases from September 11, 2016 to September 10, 2021 fulfilling the inclusion criteria are included in the study.
Study Design
Retrospective cross-sectional study was undertaken in Jimma University Medical Center (JUMC) on biopsies submitted from September 11, 2016 to September 10, 2021.
Inclusion Criteria
All patient’s biopsy that come to histopathology department with OMF masses from September 11, 2016 to September 10, 2021.
Exclusion Criteria
Records of biopsy which misses histopathologic diagnosis or two of the following variables: age, sex, anatomic site. There were 6 cases with no age and anatomic sites and 2 cases with no diagnosis (signed out with description) which are excluded from the research.
Data Collection Procedures
Data was collected using structured check lists that fulfill the objective of the study and recorded on the prepared checklists retrospectively by reviewing a histopathology report record of patients during the specified period. All OMF masses biopsy fulfilling the inclusion criteria in the study period are included to make a descriptive study inclusive of the whole OMF mass samples sent to JUMC, Pathology Department. A total of 377 biopsies records were obtained from September 11, 2016 to September 10, 2021 fulfilling the criteria.
Operational Definition
Oral and maxillofacial region ——– consists of oral cavity and peri-oral soft tissues, mandible, maxilla, salivary glands, and zygomatic area boney and soft tissues.
Oral and maxillofacial mass ——— includes benign and malignant lesions including inflammation and cysts.
Histopathology technique ——- a gold standard technique used to diagnose based on microscopic structure of a tissue.
Fibro-epithelial polyps ——- includes fibrous epulis, fibroma and inflammatory polyps.
Data Analysis
Immediately after the data collection is completed, the completeness and consistency of the data was checked then data was coded, edited and entered into computer software of Epi-data version 3.1 and then transported to Statistical Package for the Social Sciences (SPSS) version 22 for analysis. Descriptive analysis was done to describe number and percentages of the variables in the study. Data was cleaned, edited, compiled and described. Analysis was done using SPSS 22 version applied and result was presented using ration, frequency tables, graphs, pie-chart and chi-square test was done for each variable.
RESULTS
Distribution of Oral and Maxillofacial Masses in Year
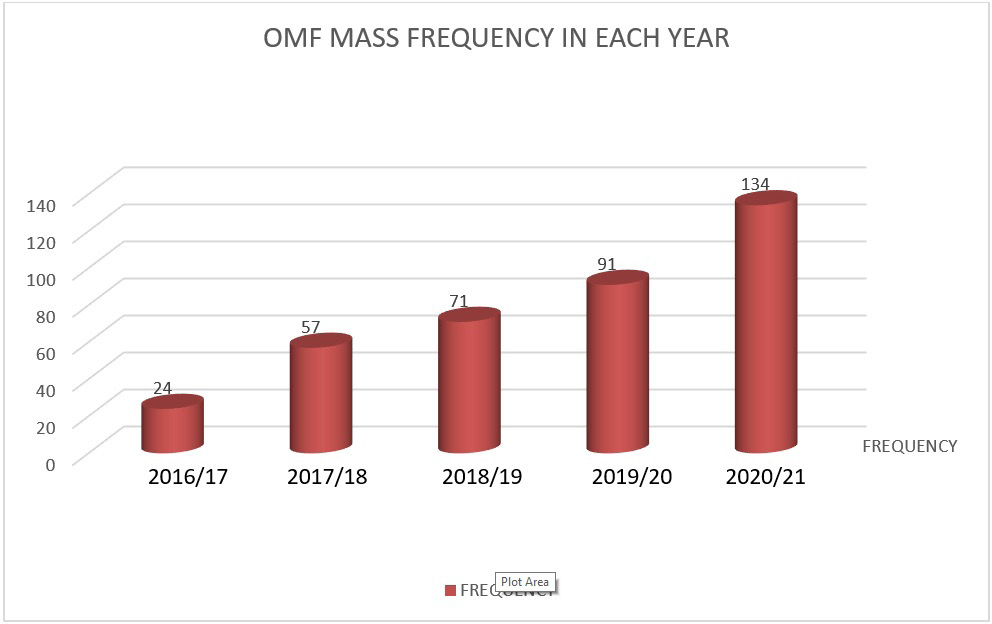
About 377 cases were identified to be diagnosed with OMF mass in the 5-years study period fulfilling the inclusion criteria. The minimum OMF biopsy record is in 2016/17, 24(6.4%) and the maximum OMF biopsy record was in 2020/21, 134(35.5) biopsies. Average OMF biopsy done on the five-years period was 75 biopsies per year (Figure 1).
Figure 1. Frequency of OMF Mass in each Year in JUMC from 2016 to 2021
Oral and Maxillofacial Mass Histopathology with Respect to Age
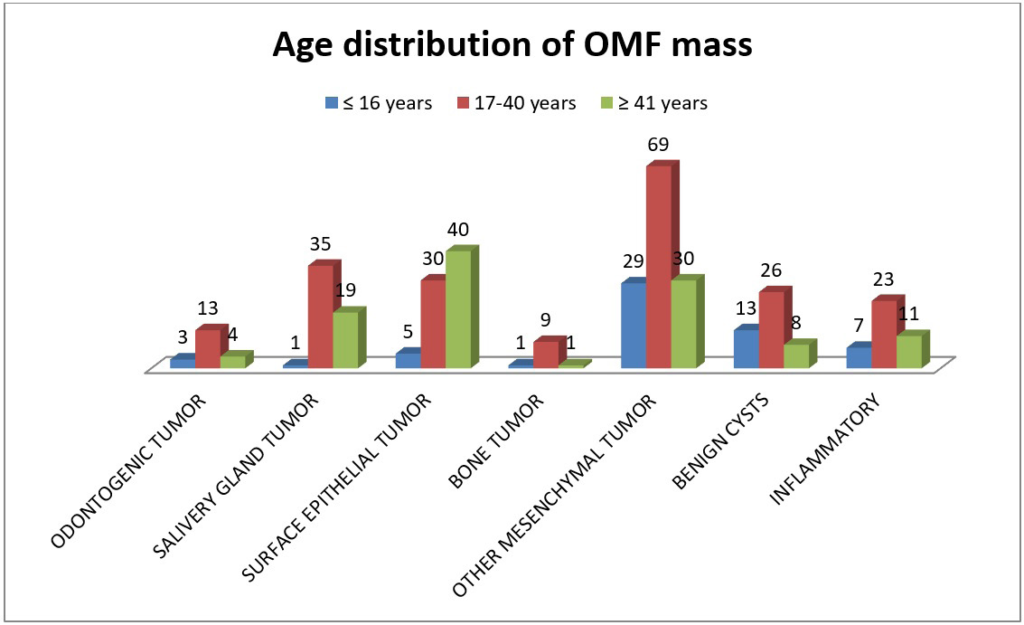
Out of 377 patient’s records, 194 (51.5%) of them were males and 183 (48.5) were females with a ratio of M:F=1:0.94 showing male dominance. The age distributions have minimum value of 1-year and maximum value of 85-years with median age of 30 and the mode was 30. The maximum age distribution of OMF mass was in 17-40-years age range accounting 205 (54.4%) biopsies followed by age≥41-years with 113 (30%) biopsies and ≤16-years with 59(15.6%) biopsies. Both inflammatory and benign masses were common in the 17-40-years period but the malignant tumors were more common in older age, ≥41-years, 49 cases. Dysplastic changes and inflammatory masses were seen more in age 17-40 and age greater than 40. Except surface epithelial tumors, which were common after the age 40-years, all other OMF masses were common on age 17-40-years. The commonest masses in ≤16-years were Mesenchymal tumors 30(50.8%) followed by benign cysts 13(22%) and inflammatory masses 7(11.9%). In age≥40 the commonest tumors were surface epithelial tumors 40(35.4%) followed by Mesenchymal tumors 30(26.5) and salivary gland tumors 19(16.8%). The association of OMF mass with age of patient have a p value=0.01 and this shows that there was a strong association between age and OMF mass showing increased frequency as the age increases (Figure 2 and Table 1).
Figure 2. OMF Mass Category Distributions with Age Group of the Patients in JUMC from 2016 to 2021
| Table 1. Age Distribution of OMF Mass in JUMC from 2016 to 2021 |
|
Age Category
|
Frequency |
Percent (%)
|
|
≤16
|
59 |
15.6 |
| 17-40 |
205 |
54.4
|
|
≥ 41
|
13 |
30.0 |
| Total |
377 |
100.0
|
Oral and Maxillofacial Mass Histopathology with Respect to Sex
Mesenchymal tumors, surface epithelial tumors, salivary gland tumors and inflammatory masses are more common in male than females but benign cysts were more common in females than males and odontogenic tumors have equal magnitude in both sexes. In general, OMF masses were more common in male than female. The association of sex with OMF mass have a p value=0.48 showing weak association (Table 2).
| Table 2. OMF Mass Distribution with Sex of the Patients in JUMC from 2016 to 2021 |
|
Histopathologic Category
|
Male |
Female |
Total |
Percentage |
| Odontogenic tumor |
10 |
10 |
20 |
5.3%
|
|
Salivary gland tumor
|
33 |
22 |
55 |
14.5% |
| Surface epithelial tumors |
43 |
32 |
75 |
19.9%
|
|
Benign cystic mass
|
23 |
24 |
47 |
12.5% |
| Inflammatory mass |
24 |
17 |
41 |
10.9%
|
|
Bone tumor
|
6 |
5 |
11 |
2.9% |
| Other Mesenchymal tumors |
55 |
73 |
128 |
34%
|
|
Total
|
194 |
183 |
377 |
100% |
| Percentage |
51.5% |
48.5% |
100% |
|
Distribution of Oral and Maxillofacial Masses with Respect to Anatomic Site
OMF mass distribution with the anatomic site in JUMC from 2016 to 2021 (Table 3). Distribution of Oral and Maxillofacial Mass with Histopathologic Type (Figures 3 and 4 and Table 4).
| Table 3. OMF Mass Distribution with the Anatomic Site in JUMC from 2016 to 2021 |
|
Anatomic Sites
|
Total
|
Percent (%)
|
|
Histopathologic
Category
|
Naso-labial Areas |
Buccal Mucosa |
Tongue |
Palate |
Lips |
Maxillary Area |
Mandibular Area |
Parotid Gland |
Submandibular Gland |
Other Salivary Gland Tumors
|
|
Odontogenic tumors
|
0 |
0 |
0 |
0 |
0 |
7 |
13 |
0 |
0 |
0 |
20 |
5.3
|
|
Salivary gland tumors
|
2 |
2 |
|
9 |
|
3 |
2 |
22 |
10 |
5 |
55 |
14.5 |
| Surface epithelial tumors |
7 |
19 |
23 |
2 |
10 |
9 |
5 |
0 |
0 |
0 |
75 |
19.9
|
|
Bone tumor
|
0 |
0 |
0 |
0 |
0 |
7 |
4 |
0 |
0 |
0 |
11 |
12.5 |
| Other Mesenchymal tumors |
15 |
23 |
7 |
6 |
11 |
33 |
32 |
0 |
0 |
0 |
128 |
10.9
|
|
Inflammatory masses
|
0 |
5 |
2 |
1 |
7 |
3 |
6 |
3 |
11 |
3 |
41 |
2.9 |
| Benign cysts |
5 |
1 |
1 |
2 |
2 |
17 |
15 |
1 |
1 |
2 |
47 |
34
|
|
Total
|
29 |
50 |
33 |
20 |
30 |
19 |
77 |
26 |
22 |
10 |
377 |
100 |
| Percent (%) |
7.7 |
13.2 |
8.8 |
5.3 |
8 |
21.2 |
20.4 |
6.9 |
5.8 |
2.7 |
100 |
|
Figure 3. Frequency of MOF Mass in each Year in JUMC from 2016 to 2021
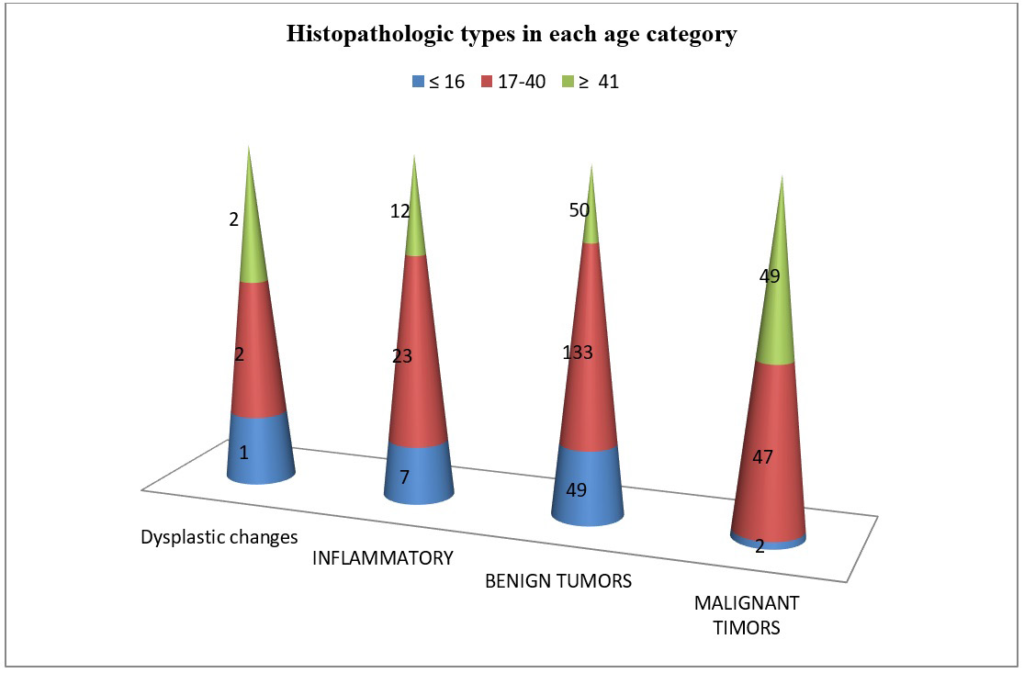
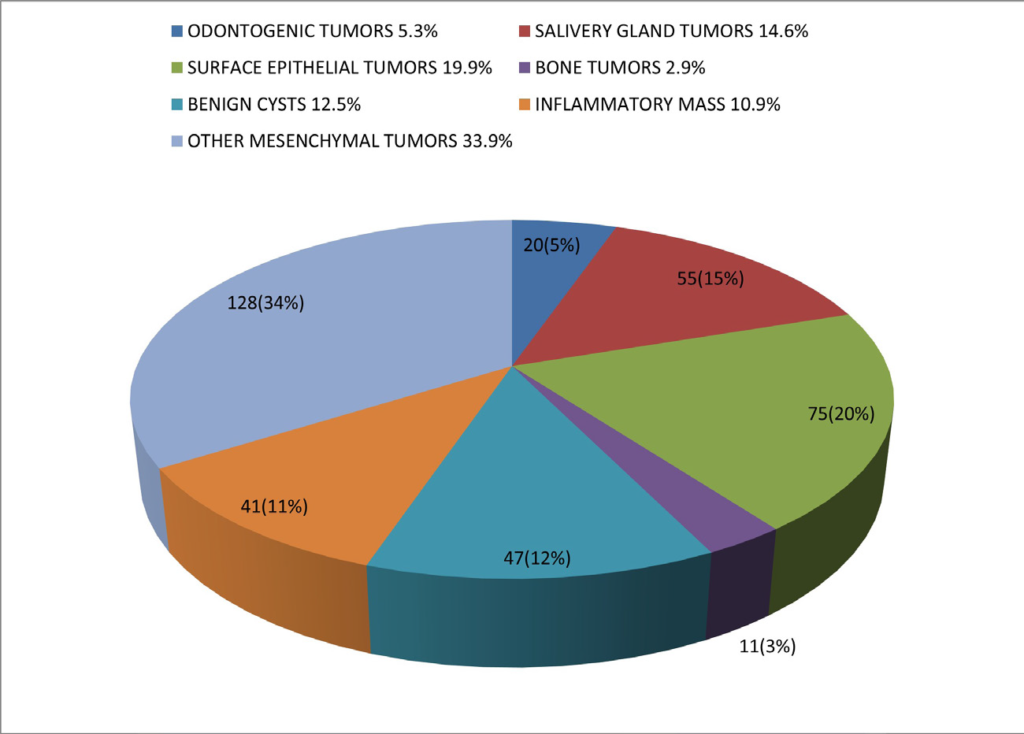
Figure 4. Frequency of OMF Mass Category Distribution in JUMC from 2016 to 2021
| Table 4. OMF Mass Histopathologic Category with Respect to the Anatomic Site in JUMC from 2016 to 2021 |
|
Site of the Mass
|
Total
|
Percent (%)
|
|
Histopathologic
Category
|
Nasal Area |
Buccal Mucosa |
Tongue |
Palate |
Lips |
Maxillary Area |
Mandibular Area |
Parotid Gland |
Submandibular Gland |
Other Salivary Gland Tumors
|
|
Dysplastic Change
|
1 |
1 |
3 |
0 |
0 |
0 |
0 |
0 |
0 |
0 |
5 |
1.4 |
| Inflammatory |
0 |
5 |
2 |
1 |
7 |
3 |
6 |
3 |
11 |
4 |
42 |
11.1
|
|
Benign Tumors
|
21 |
22 |
11 |
15 |
16 |
56 |
63 |
15 |
8 |
5 |
232 |
61.5 |
| Malignant Timors |
7 |
22 |
17 |
5 |
7 |
20 |
8 |
8 |
3 |
1 |
98 |
26
|
|
Total
|
29 |
50 |
33 |
21 |
30 |
79 |
77 |
26 |
22 |
10 |
377 |
100 |
| Percent (%) |
7.7 |
13.3 |
8.7 |
5.5 |
8 |
21 |
20.4 |
7 |
5.7 |
2.7 |
100 |
|
DISCUSSION
The five years study period result shows that there was an increased in the number of OMF masses throughout the consequent years continuously. This might be because of increasing service number and quality implementation in pathology department of JUMC and maxillofacial surgery service of dentistry additionally; increasing health seeking condition of the society has major role.
With regards to sex distribution, out of 377 patient’s record 194 (51.5%) were male and 183 (48.5) were female with a ratio of M:F=1.06:1 showing increased male dominance. Similar dominance in number of males was seen in A retrospective analysis, done in Bangladesh teaching hospital7 and A retrospective research done in Nigeria on 2014.8
The age distributions have minimum value of 1-year and maximum value of 85-years with median of 30-years. The Maximum distribution was seen in 17-40-years age range 205 (54.4%) followed by age≥41-years, 113(30%) and ≤16-years 59(15.6%). Similar result was seen on a retrospective study of OMF pathology in Jeddah with slight difference on the minimum age of the patient and the median which is 5-month and 35 respectively9 and in research done in St. Paul’s Hospital also shows similar second and third decades of age as common presentation period.10
On the site of OMF mass, this research shows the commonest area to be the maxillary areas 79(21%) followed by mandible area 77(20.4%) and Buccal mucosa 50(13.3%) and similar finding is seen on a retrospective study in Nigeria.11 But in Ethiopia, the one done in St. Paule Hospital, shows different pictures and the commonest site to be mandible followed by maxilla and buccal mucosa.10
But Odontogenic tumors were common on mandible area 13(65%) followed by maxillary area 7(35%) and Ameloblastoma17(85%) is the commonest odontogenic tumor which has a similar finding with the Tanzania, Muhimbili national hospital, research,12 and on the St. Paul’s Hospital research Odontogenic tumors in Ethiopia: eight-year retrospective study.13
Salivary gland tumors were the second most OMF mass and constitutes 14.6% and similar finding is seen in Iraq 42.6% were salivary gland tumors following to Odontogenic tumors and mesenchymal tumors14 and in Nigerian research 37.7% following to mesenchymal tumors and surface epithelial tumors.11,15 But this finding differs with the result of Brazilian southwestern population research result which the commonest tumor of OMF and constitutes 37.1%.14,16
Commonest area of salivary gland tumors was on parotid gland 22(40%) and the research done in St. Paule Hospital also showed parotid gland pleomorphic adenoma (11.88%) as the commonest salivary gland tumor similar results are seen in Tanzania12 10% and in Nigeria 1.4%.8
Surface epithelial tumors were the second commonest OMF mass, accounting 75(19.9%) of total OMF and squamous cell carcinoma 56(74.7%) was the first in the category, conceding with South-Western Saudi Arabia research result on which oral squamous cell carcinoma was the most common surface epithelial tumor, contributing to 36.1%17 and similar result seen on Tanzania (62.2%),13 Taiwanese patient’s18 but in St. Paul’s Hospital study it is the third tumor having (11.60%).10
Bone tumors have 11(2.9%) magnitude with the commonest one of it was Osteosarcoma8(72.8%) and mandibular bone was commonly involved than the maxilla. Similar find was seen in Nigeria with osteosarcoma having 9(11.7%) and the commonest bone tumor11 in Nigeria8 5(3.5%) and in Tanzania 11(2.8%)13 and in Ethiopia, St. Paul’s Hospital 4(1.10%).10
From benign cysts accounting 47(12.5%), the most common was dentigerous cyst 7(14.9%) and similarly it was common in Iraq 5.5%19 and in Tanzania 37(6.3%) but in Australia it was the second most common 4.1% following to radicular cyst 9.5%.20
Mesenchymal tumors, other than bone tumor, was the most common OMF masses 128(33.9%), and of it, fibro-epithelial tumors 53 (41.4%) was the first in magnitude. This is also true for Australia with 965(15.2%)20 and in Brazil (5.6%).14
From 42(11%) cases of inflammatory masses, the commonest was chronic non-specific inflammation 21(51.2%) followed by chronic sialoadenitis 17(41.5%) which was similar with Taiwanese patient’s.18 But in Brazilian chronic sialoadenitis 13(1.5%) is the commonest inflammatory OMF lesion.21
On this research, the commonest OMF masses diagnostic category was benign tumors 232(61.6%) followed by malignant tumors 98(26%) then inflammatory masses 42(11%) and dysplastic changes 5(1.4%). In Nigerian research shows similar finding with benign tumors the most common accounting 86.3% and malignant tumors 13.7%.8 But the finding of Saudi Arabia research differs with predominance of the non-neoplastic lesions accounting (50.3%) and a neoplastic (49.7%)17 and in Taiwanese patient’s, most of the lesions were in the inflammatory/infective group, followed by tumour/tumour-like reactive lesions.18,22
From the benign tumors fibroepithelial tumor 53(22.8%) was the commonest followed by pleomorphic adenoma 31(13.4%), Pyogenic granuloma 19(8.2%) and ossifying fibroma 18(7.8%). But in the East African research it showed Ameloblastoma (9.23%),23 fibroma (7.3%) and pleomorphic adenoma (4.95%)20 and St. Paul’s Hospital, Addis Ababa, Ethiopia, the most frequent OMF lesions were Ameloblastoma (16.02%), pleomorphic adenoma (11.88%).10 This difference can be because of socio-demographic variable nature of the OMF mass even in the same country but different areas.
From the malignant tumors and from carcinoma squamous cell carcinoma 56(57.1%), is the leading followed by adenoid cystic carcinoma 9(9.2%), mucoepidermoid carcinoma 8(8.2%) and Acinic cell carcinoma 4(4.1%) and in Dares Salaam, Tanzania research shows a similar predominance by Squamous cell carcinoma (62.2%) followed by Kaposi’s sarcoma (13.1%) and adenoid cystic carcinoma (7.4%)24 and in Ghana shows squamous cell carcinoma 62%, was the commonest,25 In Nigeria squamous cell carcinoma 36.3% was the most common malignant tumor.8 In Nigeria at academic medical hospital shows 37.8% diagnosed as malignancies, and Squamous cell carcinoma 35.1% was the most common malignancy.11 In St. Paul’s Hospital research shows, from the carcinomas, squamous cell carcinoma (11.60%) as the most common carcinoma.10
From sarcomas, Osteosarcoma 8(8.2%) was the commonest one followed by Fibrosarcoma 3(3.1%) and Rhabdomyosarcoma 3(3.1%) similarly in Nigeria Osteogenic sarcoma 11.7% was the most commonly diagnosed sarcoma.11 but, in an East African population research shows Kaposi’s sarcoma (21.98%), as the commonest followed by Burkitts lymphoma (20.45%), and squamous cell carcinoma (15.22%)20 and in St. Paul’s Hospital research shows, from the sarcomas, Kaposi’s sarcoma (3.31%) was the leading followed by Osteosarcoma (1.1%).10 Similar explanation can be possible; this difference can be because of socio-demographic variable nature of the OMF mass even in the same country but different areas.
CONCLUSION
The result of this research shows the distribution of OMF tumors varies with the age, sex and anatomic site of the mass. OMF mass is common on the early adult age period and the risk of malignant tumors increases in those with age≥41-years and the commonest malignant tumor is squamous cell carcinoma but in children and adolescent’s benign tumors specially fibroepithelial polyps are the commonest. In children less than 16-years inflammatory conditions are common followed by odontogenic tumors. The commonest site of OMF is maxillary area but for odontogenic tumors, mandible is the commonest one and males have more preponderance for OMF than females.
ETHICAL CONSIDERATION
Ethical clearance was obtained from Institutional Review Board (IRB) of JUMC. Support letter request for Permission to conduct study was also submitted to pathology department by the investigator. During data extraction all records were retrieved by unique identification rather than the patient’s name to keep confidentiality.


