INTRODUCTION
Diet therapy remains the foundation of any diabetes treatment program. Carbohydrate counting is a meal planning approach to help diabetic patients adequately count and control their carbohydrate intake, in order to achieve and maintain glycemic control.1 In addition to the amount of carbohydrate, the type or source of carbohydrate is recognized to affect postprandial glucose levels. From this point of view, glycemic indexes of foods were developed in an attempt to systematically classify different carbohydrate-containing foods according tothe incremental area under the curve for blood glucose responses relative to that of a reference food (glucose, white bread, or rice).2,3,4,5 Postprandial hyperglycemia has been suggested to affect oxidative stress and inflammatory responses leading to diabetic complications.6,7,8,9,10,11,12Clinical usefulness of glycemic index has been reported in studies on people with diabetes and coronary heart disease.13,14,15,16 However, it is said that it can be difficult for diabetic patients to use glycemic index for glycemic control, because it usually evaluates one food at a time, not the combination of foods in a meal. In addition, individual variations of the effect of glycemic index do not seem to be well taken into account. In this study, we evaluated glycemic variations after the ingestion of different carbohydrate-containing foods by continuous glucose monitoring in healthy and diabetic individuals in daily life, to better guide diabetic patients by diet therapy with carbohydrate counting.
SUBJECTS AND METHODS
Study design
The present study was approved by the Ethical Review Board of National Hospital Organization Matsumoto Medical Center. Seven healthy persons (3 males, 4 females; age, 40 ± 12 (mean ± SD) years; Body Mass Index (BMI), 23.7 ± 4.7) (Table 1) and eight patients (4 males, 4 females; age, 40 ± 9 years; BMI, 22.7 ± 2.5) with type 1 and type 2 diabetes mellitus (T1DM and T2DM, four patients each) (Table 2) were studied with their written consent to the study. T1DM or T2DM was diagnosed by a physician in consideration of patient’s clinical course, insulin secretion capacity and serum test for glutamic acid decarboxylase auto antibodies. T2DM 1 was treated with 20 mg gliclazide, and 250 mg metformin twice; T2DM 2 was treated with 20 mg gliclazide; T2DM 3 was treated with 50 mg sitagliptin, and 250 mg metformin twice; and T2DM 4 was treated with 40 mg gliclazide twice, 50 mg sitagliptin twice, and 250 mg metformin twice. T1DM 1 was treated with 12 U insulin lispro for bolus insulin and 12 U insulin glargine for basal insulin by Multiple Daily Insulin (MDI) injection; similarly, T1DM 2 was treated with 33 U insulin aspart and 24 U insulin glargine; T1DM 3 was treated with 30 U insulin aspart and 22 U insulin glargine; and T1DM 4 was treated with 30 U for bolus insulin and 23 U for basal insulin (lispro) by Continuous Subcutaneous Insulin Infusion (CSII).
|
Age (years)
|
M/F
|
Height (cm)
|
BMI
|
Figure 1
|
| Case 1 |
27
|
M
|
170
|
27.7
|
A
|
| Case 2 |
29
|
F
|
158
|
18.0
|
B
|
| Case 3 |
33
|
F
|
147
|
28.7
|
C
|
| Case 4 |
54
|
F
|
148
|
21.7
|
D
|
| Case 5 |
44
|
F
|
151
|
20.2
|
E
|
| Case 6 |
37
|
M
|
172
|
29.1
|
F
|
| Case 7 |
57
|
M
|
170
|
20.4
|
G
|
BMI: Body Mass Index
Table 1: Characteristics of healthy persons.
|
Age (yrs)
|
M/F
|
Height (cm)
|
BMI |
HbAic (%)
|
Therapy
|
Figure 2
|
| T2DM 1 |
29
|
M
|
180
|
23.1
|
7.1
|
BG, SU
|
A
|
| T2DM 2 |
49
|
F
|
152
|
22.1
|
7.3
|
SU
|
B
|
| T2DM 3 |
53
|
F
|
149
|
23.6
|
7.1
|
DPP4i, BG
|
C
|
| T2DM 4 |
49
|
M
|
182
|
21.7
|
8.8
|
DPP4i, BG, SU
|
D
|
| T2DM 1 |
38
|
F
|
164
|
20.8
|
6.3
|
MDI
|
E
|
| T2DM 2 |
38
|
M
|
172
|
22.0
|
7.1
|
MDI
|
F
|
| T2DM 3 |
28
|
F
|
159
|
28.1
|
8.9
|
MDI
|
G
|
| T2DM 4 |
39
|
M
|
178
|
19.9
|
9.8
|
CSII
|
H
|
T2DM: Type 2 diabetes mellitus; T1DM: Type 1 diabetes mellitus; BMI: Body Mass Index; DPP4i:
Dipeptidyl peptidase-4 inhibitor; SU: Sulfonylurea; BG: Biguanide; MDI: Multiple Daily Insulin injection; CSII: Continuous Subcutaneous Insulin Infusion
Table 2: Clinical characteristics of diabetic patients.
After an overnight fast, subjects were instructed to eat 40 g carbohydrate-containing meals for breakfast within 10 minutes after the measurement of their blood glucose levels. The meals, chosen from starchy foods, fruits and dairy foods, were 100 g cooked rice with Japanese green tea seasoning (183 kcal), 300 g apple (162 kcal), and 35 g cereal (corn flakes) with 180 ml of milk (253 kcal), eaten in this order for three consecutive days. Only T1DM 4 ate yogurt (fermented milk) instead of milk (almost the same amount of carbohydrate and energy). T2DM patients took prescribed oral hypoglycemic agents excluding sulfonylurea (SU) after breakfast to avoid hypoglycemia, and the excluded SU was taken after lunch during the study. Similarly, to avoid hypoglycemia T1DM patients reduced their bolus insulin doses for breakfast to 40-50% of usual doses, according to the amount of carbohydrates diminished than usual. The subjects were instructed to pass three hours after the breakfast similarly during three days of the study in daily life. However, T1DM 2 explained that he had a hard labor for one hour due to the heavy snow, starting 30 minutes after the cereal+milk ingestion on the 3rd day of the study, and felt symptoms of hypoglycemia without snacks before lunch.
Measurements
Blood glucose levels were assessed by using a continuous glucose monitoring system (iPro2®, Medtronic Inc., Tokyo, Japan), which was attached to the subjects’ abdominal region on the day before the first day of the study, and was removed on the last day of the study. The continuous glucose monitoring system was used according to the manufacture’s instruction. The system monitored glucose levels in subcutaneous fluids every 5 minutes, and blood glucose levels for calibration were measured 3 times or more a day by self-monitoring of blood glucose with a glucometer (Medisafe Fit®, Terumo Corp., Tokyo, Japan) at home. The iPro2® device stored the sensor signal information, and was retrospectively calibrated.17
Statistical analysis
The data are expressed as the mean ± SD. Statisticalanalysis was performed using repeated measures ANOVA with Bonferroni correction.
RESULTS
Figure 1 shows individual glycemic profiles after the ingestion of three different kinds of, but the same amount (40 g) of carbohydrate-containing foods (rice, apple and cereal+milk) for breakfast in 7 healthy individuals (A to G) as in Table 1. The glycemic profiles were assessed every 5 minutes over 3 hours by a continuous glucose monitoring system at home. Similarly, Figure 2 shows those in four T2DM patients (A to D) and those in four T1DM patients (E to H). The patients A to D consistently took 50 mg sitagliptin, nothing, 50 mg sitagliptin + 250 mg metformin, and 50 mg sitagliptin + 250 mg metformin, respectively, after the breakfast meal intake. The patients E to H injected bolus insulin before the meal intake, doses of which were reduced and fixed at 2U, 5U, 5U and 3U, respectively. The respective profiles of blood glucose responses to three different meals for breakfast varied largely among individuals, especially in diabetic patients. However, as expected, a rise in blood glucose levels was, on the whole, higher after the rice ingestion than after ingestion of the other two meals (apple and cereal+milk).
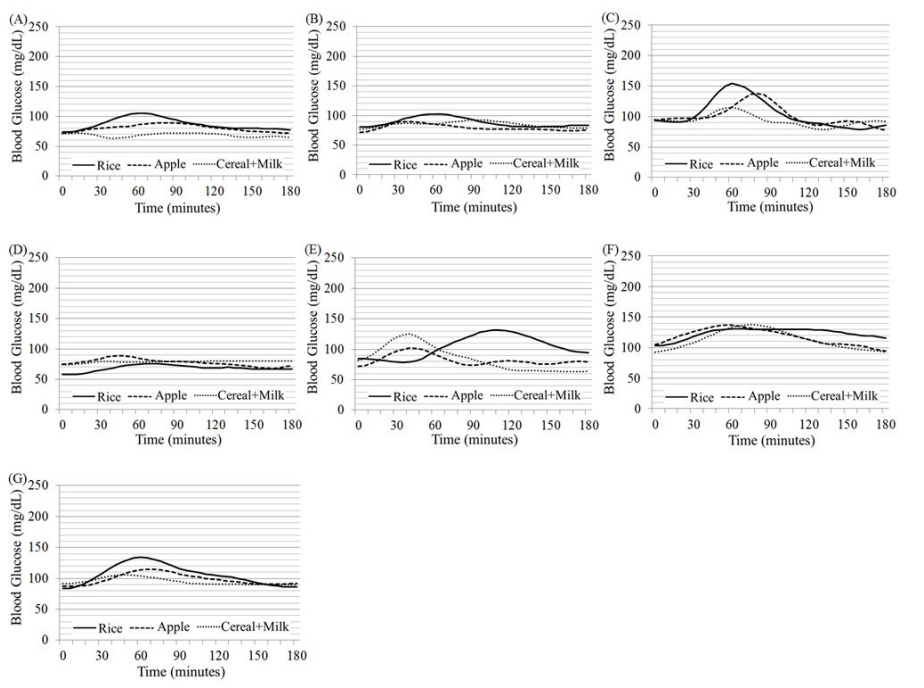
Figure 1: Glycemic profiles after the ingestion of three different kind of, but the same amount (40 g) of carbohydrate-containing foods (rice, apple and cereal+milk) for breakfast in 7 healthy individuals (A to G) as in Table 1. The glucose levels were measured every 5 minutes over 3 hours by a continuous glucose monitoring system for three consecutive days at home.
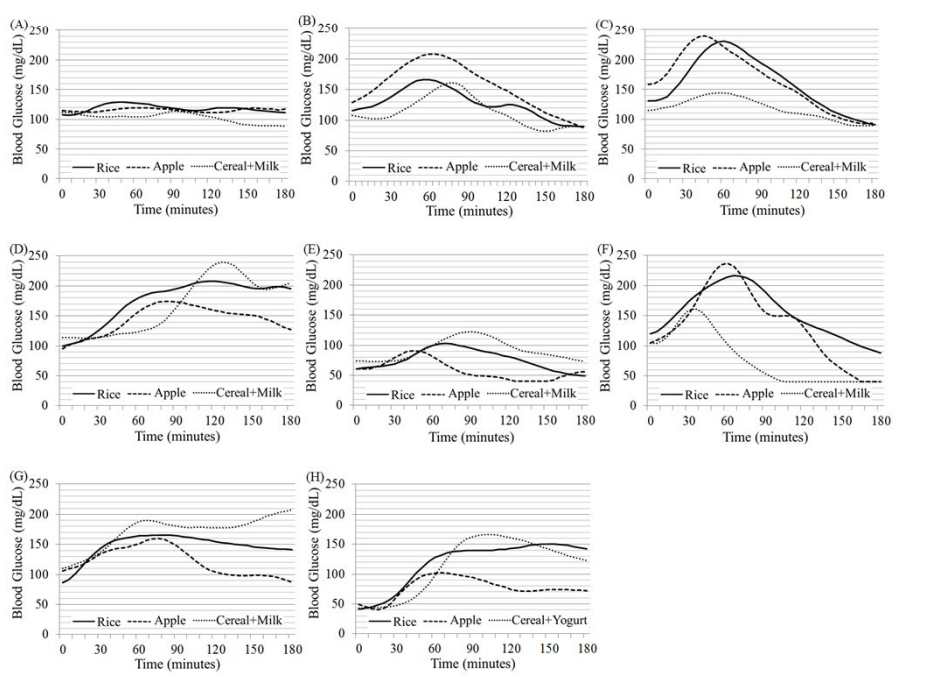
Figure 2: Glycemic profiles after the ingestion of three different kind of, but the same amount (40 g) of carbohydrate-containing foods (rice, apple and cereal+milk) for breakfast in 8 diabetic individuals (A to H) as in Table 2. The glucose levels were measured every 5 minutes over 3 hours by a continuous glucose monitoring system for three consecutive days at home. Four type 2 diabetic patients (A to D) consistently took 50 mg sitagliptin, nothing, 50 mg sitagliptin + 250 mg metformin and 50 mg sitagliptin + 250 mg metformin after breakfast, respectively, without taking sulfonylurea prescribed (A, C, D). Four type 1 diabetic patients (E to H) took bolus insulin before breakfast, doses of which were reduced and fixed at 2 U, 5 U, 5 U and 3 U, respectively.
Incremental area of postprandial glucose levels after the ingestion of three different meals shown in Figures 1 and 2 is depicted as a mean+ or –SD of sums of every 5-minute blood glucose level minus baseline level at time 0 in 7 healthy persons (Figure 3A) and in 8 diabetic patients (Figure 3B). At the time interval of 0 to 180 minutes, the sums for the rice, apple and cereal+milk in healthy persons were 543 ± 209, 322 ± 123 and 181 ± 275 mg/dl, respectively. In diabetic patients, those were 1442 ± 1025, 528 ± 471 and 766 ± 1374 mg/dl, respectively. Similarly, those at the time interval of 0 to 60 minutes were 154 ± 108, 148 ± 69 and 121 ± 122 mg/dl in healthy persons, and 420 ± 197, 360 ± 264 and 184 ± 196 mg/dl in diabetic patients; those at the time interval of 60 to 120 were 286 ± 108, 163 ± 92 and 92 ± 155 mg/dl in healthy persons, and 680 ± 390, 363 ± 306 and 442 ± 645 mg/dl in diabetic patients; those at 120 to 180 were 104 ± 132, 11 ± 59 and -31 ± 105 mg/dl in healthy persons, and 342 ± 612, -193 ± 275 and 141 ± 675 mg/dl in diabetic patients, respectively.
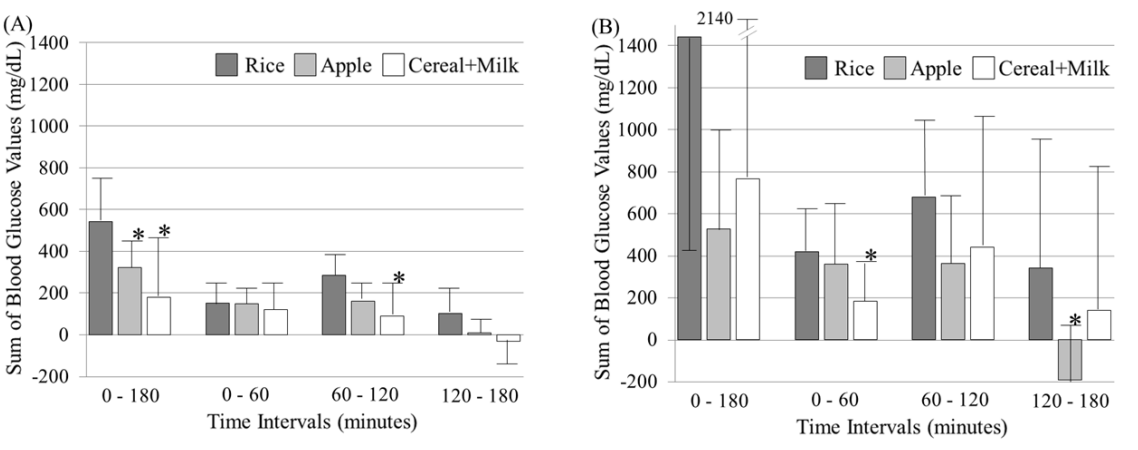
Figure 3: Incremental area of postprandial glucose levels after the ingestion of three different kind of, but the same amount (40 g) of carbohydrate-containing foods (rice, apple and cereal+milk) for breakfast shown in Figures 1 and 2 is depicted as a mean+ or –SD of sums of every 5-minute blood glucose value minus the baseline value (time 0) at the time interval indicated in 7 healthy persons (Figure 3A) and in 8 diabetic patients (Figure 3B). The glycemic increments after the apple and cereal+milk ingestion were significantly smaller than those after the rice ingestion.*p<0.05 vs rice at the same time interval (repeated measures ANOVA with Bonferroni correction).
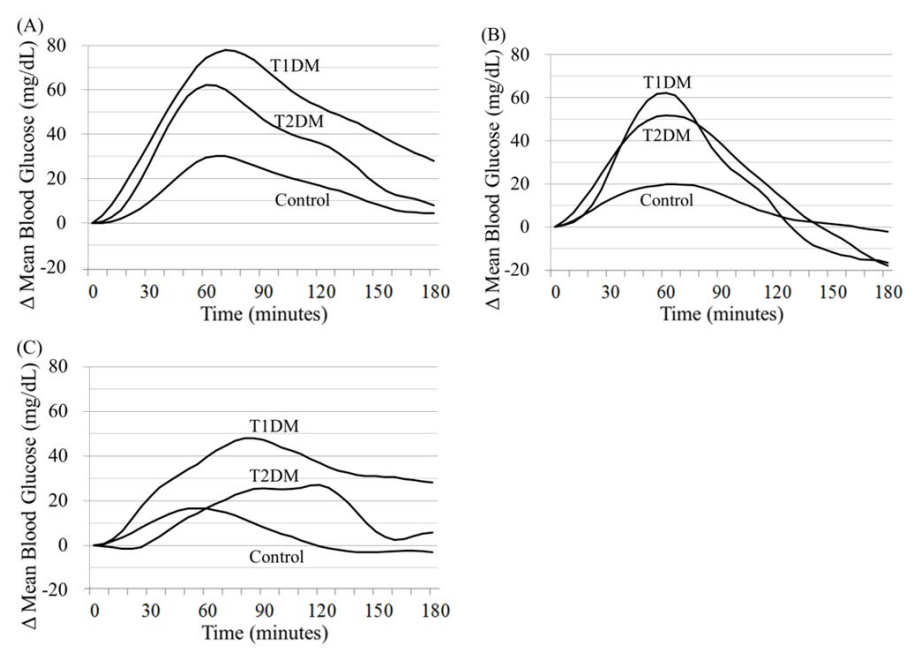 Figure 4: Mean values of incremental blood glucose levels (Δ Mean Blood Glucose) after the ingestion of three different foods (rice (A), apple (B) and cereal+milk (C)) in healthy persons (Control, n=7), type 2 (T2DM, n=4) and type 1 (T1DM, n=4) diabetic patients.
In healthy persons, glycemic increments were significantly (p<0.05) smaller after the ingestion of apple and cereal+milk than after the rice ingestion at the time interval of 0 to 180 minutes. At the time interval of 60 to 120, the increments after the cereal+milk ingestion were significantly (p<0.05) smaller than those after the rice ingestion. In diabetic patients, the increments after the cereal+milk ingestion at the time interval of 0 to 60 minutes and after the apple ingestion at the time interval of 120 to 180 minutes were smaller than those after the rice ingestion at the respective time intervals. The mean value of the sums after the cereal+milk ingestion in healthy persons and that after the apple ingestion in diabetic patients at the time interval of 120 to 180 minutes were below the baseline.
When glycemic indexes were calculated with rice as a reference (100) using the mean values at the time interval of 0 to 180 minutes in this study, those of apple and cereal+milk were 59 and 33 in healthy persons, and 37 and 53 in diabetic patients. Using the mean values at the time interval of 0 to 120 minutes, those were 71 and 48 in healthy persons, and 66 and 57 in diabetic patients.
When diabetic patients were divided into two groups (T1DM and T2DM, n=4 each), mean values of incremental blood glucose levels (Δ Mean Blood Glucose) after the ingestion of three different meals (rice (A), apple (B) and cereal+milk (C)) in three groups of T1DM, T2DM and Control (7 healthy persons) are depicted in Figure 4. The mean value in A was the highest in T1DM, intermediate in T2DM, and the lowest in Control at every 5-minute time point. Compared with this, the mean value in B was higher in T1DM and T2DM than in Control during a shorter period of time. The mean value of postprandial glucose levels was suppressed in C, compared with those in A and B. The elevated mean value of T1DM in C tended to persist, in spite of hypoglycemia that happened in one of four T1DM patients.
DISCUSSION
In the present study, we assessed glycemic variations after the ingestion of three different kind of, but the same amount of carbohydrate-containing meals, chosen from starchy foods, fruits and dairy foods, by using continuous glucose monitoring in healthy and diabetic individuals in daily life. The rice meal contained protein, and the cereal+milk meal contained protein and fat as a combination of foods. Individual variations of glycemic responses to these meals were considerably large, especially in diabetic patients, although less accuracy of continuous glucose monitoring at home should be taken into account.18However, the average glycemic excursions appeared to be more or less similar to those in previous reports2,3,4,5 in view of glycemic index. In both the groups, it was indicated that glycemic indexes of apple and cereal+milk were approximately 35 to 70.
Fruits generally belong to low glycemic index foods, as they are rich in dietary fiber and contain fructose and glucose moieties. It has been demonstrated that glycemic indexes of several kinds of fruits were approximately the same between healthy persons and type 2 diabetic patients.19 According to International Tables of Glycemic Index, 2008,4 glycemic indexes of fructose, sucrose and apples are 15, 65 and 36, respectively. In our study, postprandial glucose levels after the apple ingestion were lower than those after the rice ingestion, and returned to or often decreased below the baseline, as had been shown in the other reports.5,19 Such a pattern of postprandial glucose levels is suggested to be linked to increased appetite and weight gain,20 which seems to be one of hints on nutrition education. However, the restriction of fruit intake had no effects on HbA1c level or weight loss in type 2 diabetic patients.21The consumption of fruit juice seems to have no overall effects on fasting blood glucose and insulin levels.22
Glycemic indexes of milk and yogurt are 39 and 41, respectively, in the International Tables.4 In addition to lactose providing fewer glucose moieties than the same amount of maltose or starch,
dairy protein, especially the whey protein, can stimulate glucagon-like peptide 1 and insulin secretion,23,24,25,26 and dairy fat and organic acids can delay gastric emptying.3,27,28,29,30,31 Along with these observations, the present study showed sums of glycemic increments after the ingestion of common breakfast cereal (corn flakes) of a high glycemic index together with milk (or yogurt in T1DM 4) were significantly lower than those after the rice ingestion. Interestingly, persistent elevated glucose levels were seen in type 1 diabetic patients, excluding one who had hypoglycemia after the cereal+milk ingestion due to an accidental hard labor. Oestman et al.27 previously presumed that milk may produce a higher glycemic index when tested in individuals with diminished or absent β cell function than in healthy subjects capable of responding to the insulinotropic components in milk. Our finding seems to be consistent with this presumption.
Thus, it was clearly demonstrated that inter-individual variations of postprandial glucose levels after the ingestion of different carbohydrate-containing foods were large in healthy and, especially, in diabetic individuals in daily life. Nevertheless, the average profiles of the glucose levels approximately accorded with those previously reported. The glucose levels slowly rose after dairy meals, and the elevated levels persisted in type 1 diabetes. Medical staff should be aware of controlling carbohydrate intake with glycemic index, keeping in mind large individual variations of glycemic responses to the same amount of carbohydrate, due to the impact on glycemia of dietary components and non-dietary factors.1 It may be wise that diabetic patients are advised to develop their own personal glycemic indexes in their respective situations.
CONFLICTS OF INTEREST
The authors declare that they have no conflicts of interest.
ACKNOWLEDGEMENTS
This study was in part supported by a research grant from Policy-Based Medical Service Foundation, Japan.


