BACKGROUND
Dietary consumption can have an impact on long-term health around the world.1,2,3 Diet is a modifiable risk factor in a number of chronic diseases: for example, type II diabetes, coronary heart disease, cardiovascular disease, hypertension and obesity.3
Diet is a complex phenomenon. A single food is not eaten in isolation, but in combination with others. Interaction between foods can affect how they are absorbed and processed by the body which may subsequently affect health. Analysis of common dietary patterns is therefore particularly relevant to explore links between diet and health. The contents of a dietary pattern can vary widely from the differentiation between two main types of diet; omnivores and vegetarians4 to patterns such as a Mediterranean diet5,6 and data driven patterns specific to a particular population, assigned by a cluster analysis.7
Influences on dietary patterns span a broad spectrum entwining social, economic, demographic, environmental and individual factors.8,9,10,11,12 Using geographical units is one way which some of these can be incorporated into health research. An ecological model framework to investigate how individuals and their environments interact is well documented.13,14,15 However, unpicking such complex relationships is challenging. The use of a geodemographic classification goes some way towards accounting for social (compositional) and environmental (context) interactions by grouping people with similar demographic and neighbourhood characteristics residing in small geographical units together. Applying a geodemographic classification to existing cohort data unlocks the potential for addressing new and important research questions. The geographical location (in this study GOR) can only account for environment context as there are no demographic characteristics included.
The UK Women’s Cohort Study (UKWCS) is a large cohort established to investigate associations between diet and health in the UK.16 Data is available at the post code level (a small spatial unit) which can be aggregated to a number of larger geographical units. The cohort targeted only women as at the time of cohort inception women were not well represented in large UK cohort studies. With rich diet and health outcome data in the UKWCS it is possible to describe dietary patterns at various spatial scales and provide important information about the type of people, living in types of neighbourhoods, consuming different dietary patterns which could be linked to spatial variations in future health outcomes; and because a standard classification is used would be generalisable to women in the UK population.
The aim of this paper is to explore variations in dietary patterns in women across the UK in two ways: at the large scale GOR level and using a geodemographic classification for a smaller scale picture. Results at the two spatial scales will be compared and contrasted with regards to their application and usefulness in a health setting. If a better understanding of dietary habits in specific groups of people can be developed then there is the potential to provide dietary interventions which could benefit many in terms of health and wellbeing in addition to prevention of chronic diseases.
METHODS
Study Design and Sample
At baseline, between 1995 and 1998, 35,372 women were recruited into the UKWCS on a volunteer basis from a World Cancer Research Fund (WCRF) mailing list. The response rate was 58%, from 61,000 invitations to take part. These women all completed at baseline first contact, a 217 item validated,17 Food Frequency Questionnaire (FFQ), aiming to assess usual diet over the past 12 months, along with a more general questionnaire. It was not possible to assign a dietary pattern to all women due to some providing incomplete FFQs and therefore 1902 women were excluded from the sample. Individuals consuming <500 and >6000 kcal/day were excluded from the analysis as these were considered to be outliers (n=70). A valid postcode was not available for all these women, so following data cleaning these 1128 women were excluded. Finally, 62 women living in Northern Ireland were also excluded due to insufficient numbers in this area for meaningful analysis. This left a sample of 32,205 for cross-sectional dietary pattern analysis.
Ethics
Ethical approval was obtained from 174 National Health Service (NHS) local research ethics committees during 1994 and 1995.18
Dietary patterns
The dietary patterns in the UKWCS were identified in a previous study by Greenwood et al.7 Seven dietary patterns were identified from FFQ data using a k-means cluster analysis. The patterns were named to reflect the types and quantities of food consumed in each pattern. The patterns are as follows: “Monotonous Low Quantity Omnivore” – a diet high in white bread, sugar and milk; “Health Conscious” – a diet high in fruit and vegetables and wholegrains; “Traditional Meat Chips and Pudding Eater” – typified by a white bread, meat, chips and high fat, creamy foods; “Conservative Omnivore” – a diet lacking high quantities of any food, but with moderate quantities of most foods, especially potatoes, meat, fish, eggs, fruit and vegetables; “Higher Diversity Traditional Omnivore” – a diet similar to the Traditional Meat Chips and Pudding eater but with higher diversity; “Low Diversity Vegetarian” – a meat free diet high in wholemeal bread, soya, pulses, fruit and vegetables; and “High Diversity Vegetarian” – a meat free diet with lots of variety including wholemeal bread, cereals, wholemeal pasta and rice, soya, spreads, nuts, pulses, fruit, vegetables and more (see Appendix A – Summary of dietary patterns for more details of the dietary patterns). The “Health Conscious” dietary pattern is the healthiest pattern and the “Monotonous Low Quantity Omnivore” the least healthy. The healthiness of the dietary patterns was determined by scoring each pattern against the UK dietary recommendations ‘The Eatwell Plate’.19
Spatial scale
This study first reports diet according to the nine GORs of England. Scotland and Wales are included as entire countries (without further regional breakdown). Northern Ireland has not been included (as described above). Therefore 11 regions are presented. The OAC20 is used for the geodemographic analysis. This classification has been created using the geographical unit Output Area – which consists of a minimum of 40 households and contains an average of 250 people – combined with 41 variables reported in the 2001 census. This was the census closest in time to the majority of the UKWCS data collection. OAC is a three tier classification. The first tier are named ‘Supergroups’ of which there are seven. The second tier ‘Groups’ of which there are 21 and the third tier ‘Subgroups’ of which there are 52. The OAC categories were generated using an adapted k-means clustering procedure.20 Results at Supergroup level are presented in this paper. The seven OAC Supergroups are as follows: ‘Blue Collar Communities’ – typified by living in terraced accommodation, presence of young children and routine or semi-routine employments along with those working in manual labour type roles; ‘City Living’ – typically including high proportions of adults aged 25-44, large numbers of individuals born outside of the UK, single person rented houses or flats and many in or holding higher education qualifications; ‘Countryside’ – this groups contains high proportions of adults aged over 45 years old, living in detached housing with two or more cars in the household. Many work from home, provide unpaid care or work in agriculture; ‘Prospering Suburbs’ – many aged 45-64 living as two adults and no children reside in these areas. There are non-dependent children living in these areas in mostly detached housing with two or more cars per household; ‘Constrained by circumstance’ – this Supergroup is typified by individuals living in care homes, or public provided accommodation, as such there are many divorced or separated, single pensioners, or lone parent households and those who are unemployed or with limiting long-term illness; ‘Typical Traits’ – this groups contains those with most average characteristics; and ‘Multicultural’ – this group has high proportions of those born outside the UK with a range of different ethnicities. Many will use public transport or be unemployed (see Appendix B – Summary of OAC Supergroups for more information).
GOR and OAC were assigned via the postcode unit for each woman in the cohort, using the geoconvert tool.21
Covariates
Metabolic Equivalent of Tasks (METs) were used as a measure of physical activity, calculated by assigning a value from the Compendium of Physical Activities22 to the results of questions asked at baseline where the women reported hours per typical week spent in various common activities. Smoking is reported as a binary value which indicates if the woman was a current smoker at baseline. Total calorie intake, including calories from alcohol, is derived from the FFQ. Age, social class and education were collected in the UKWCS baseline lifestyle questionnaire.
Statistical analysis
STATA IC 12.1 statistical software has been used for the analysis.23 Chi squared statistics are used to detect differences across categories for tabulated data.
Multinomial logit regression was carried out for the categorical data. The regression analysis looked at the likelihood of consuming a particular dietary pattern compared to the “Traditional Meat Chips and Pudding Eater” pattern (the most commonly consumed in the UKWCS) accounting for place of residence. In the regional analysis the region of residence was compared to living in the South East, (where the majority of the UKWCS women reside). The geodemographic analysis compared the Supergroup which the women live in with women living in the Typical Traits Supergroup (named since those residing in such areas are average with respect to the demographic variables used to create the classification). Results are presented as Relative Risk Ratios (RRRs) with 95% confidence intervals and p values.
Regression models are adjusted to account for potential confounders which were identified using a causal diagram. The adjusted regression model includes physical activity, smoking and total calorie intake including alcohol, age, social class and education. The composition characteristics – age, social class and education – were not adjusted for in the analysis with OAC (Table 2) as this would have over adjusted these characteristics as they are included in the OAC already.
RESULTS
Summary statistics
The UKWCS mean age was 52.2 years (SD 9.3) with means ranging between 51.4 to 53.0 years by region and 50.1 to 53.4 years by OAC Supergroup. Physical activity, measured using METS calculated from a physical activity questions for a 24 hour period had a mean value of 16.0 METS (SD 11.7); mean regional range 16.4 to 17.8; OAC Supergroup range 15.0 to 18.2. Sixty-five percent of the cohort had a professional/managerial occupation with a regional range of 58-67% and OAC Supergroup range of 53-73%, with highest numbers in the City Living Supergroup and lowest in the Blue Collar Communities. Fifty-two percent of the cohort were educated to A-level (school year 13) or above with a regional range of 46-65% and OAC Supergroup range 37-70% with lowest values in the ‘Constrained by Circumstance’ and ‘Blue Collar Communities’ and highest again in ‘City Living’.
A wider variation in the mean characteristics of the women is evident when grouped by OAC Supergroup compared to grouping by region. This supports the expectation that incorporating demographic variables into a geographical classification enhances understanding of specific populations, rather than seeing averaged out characteristics of a much larger geographical region.
Regional analysis
The distribution of the UKWCS as a percentage of the total UK population of women, by region, ranges from 0.08% for the North East, North West and Scotland and 0.17% for the South East and South West (with other regions falling in-between). So whilst the lowest number of cohort women reside in the North East, this is also the region which has the lowest population in the whole UK. The dietary pattern consumption vary significantly across regions (p=0.002), with the exception of the Health Conscious dietary pattern (Figure 1), however, differences are small.
Figure 1: Percentage of UKWCS consuming each dietary pattern by GOR
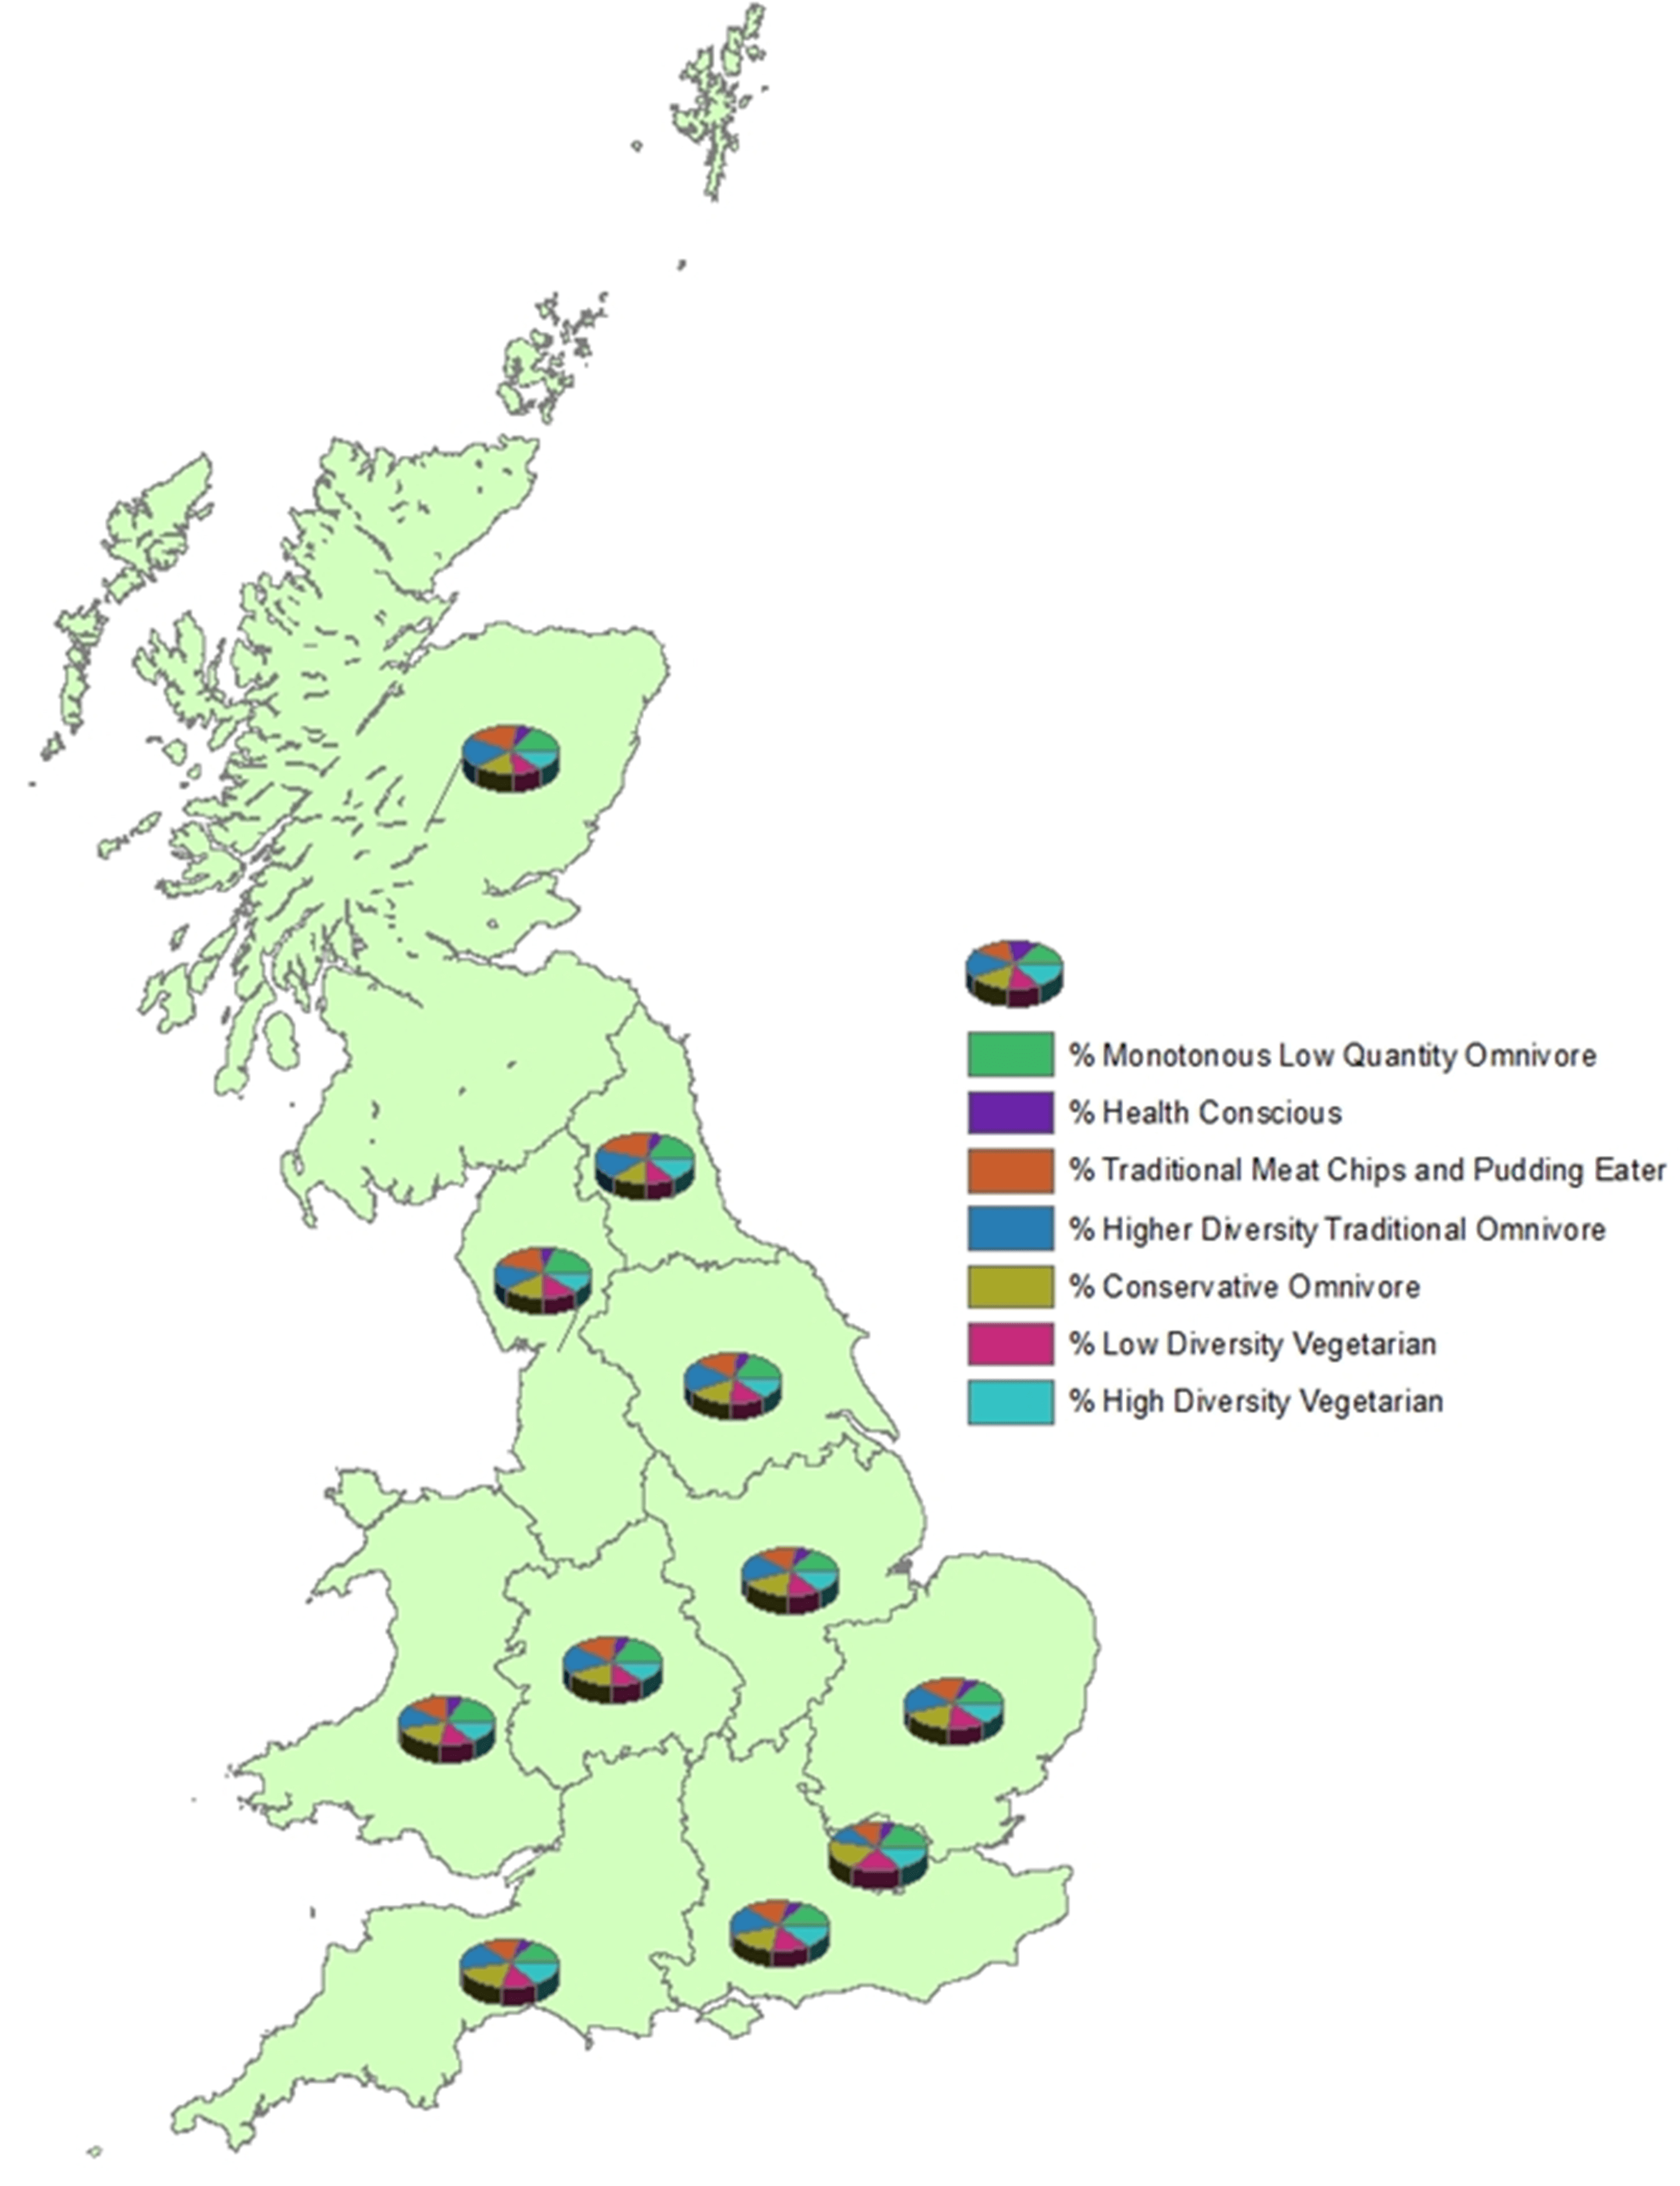
Results from a multinomial regression analysis (Table 1), for dietary pattern consumption by region, identify that some regions are more likely to consume certain dietary patterns over others. However, the regression results show that no region has overall better dietary habits than another. Greater London highlights how one region can exhibit statistical significance in relative risk ratio (RRR) of being more likely to consume “Health Conscious” (most healthy) and also more likely to consume a “Monotonous Low Quantity Omnivore” (least healthy)19 diet compared to the “Traditional Meat, Chips and Pudding Eater” pattern, which was the reference group, showing that both extremes of dietary patterns reside in the same region. While some regions show a significant increased likelihood of consuming a poor “Monotonous Low Quantity Omnivore” dietary pattern; for example, Wales, Yorkshire and the Humber, North West; these regions are, however, not significantly less likely to consume a “Health Conscious” dietary pattern which would make it difficult to know where to precisely target healthy dietary pattern promoting interventions.
| Table 1: Regression models investigating whether Government Office Region predicts dietary patterns displaying Relative Risk Ratio (95% Confidence Interval) and p value. |
|
|
Monotonous Low Quantity Omnivore |
Health
Conscious |
Traditional Meat Chips and Pudding Eater |
Higher Diversity Traditional
Omnivore |
Conservative Omnivore |
Low Diversity Vegetarian |
High Diversity Vegetarian |
|
RRR (95% CI)
p value |
RRR (95% CI)
p value |
Ref. |
RRR (95% CI)
p value |
RRR (95% CI)
p value |
RRR (95% CI)
p value |
RRR (95% CI)
p value |
| Unadjusted model (pseudo R2=0.003) |
| North East |
0.87(0.70 to 1.08) p=0.211 |
0.82(0.61 to 1.12) p=0.218 |
1.00 |
0.79(0.63 to 0.99) p=0.043 |
0.62(0.49 to 0.77) p<0.001 |
0.64(0.51 to 0.81) p<0.001 |
0.84(0.67 to 1.06) p=0.149 |
| North West |
1.20(1.04 to 1.38) p=0.013 |
0.91(0.75 to 1.12) p=0.368 |
1.00 |
0.81(0.69 to 0.94) p=0.006 |
0.85(0.73 to 0.98) p=0.023 |
0.84(0.73 to 0.98) p=0.025 |
0.83(0.71 to 0.98) p=0.024 |
| Yorkshire and the Humber |
1.11(0.95 to 1.30) p=0.179 |
0.97(0.78 to 1.20) p=0.776 |
1.00 |
1.07(0.92 to 1.25) p=0.392 |
0.96(0.83 to 1.12) p=0.646 |
0.90(0.77 1.06) p=0.199 |
0.99(0.84 to 1.17) p=0.873 |
| East Midlands |
1.01(0.85 to 1.18) p=0.944 |
1.15(0.93 to 1.42) p=0.209 |
1.00 |
1.07(0.91 to 1.25) p=0.444 |
1.13(0.97 to 1.32) p=0.123 |
0.92(0.78 to 1.09) p=0.340 |
1.00(0.84 to 1.19) p=0.997 |
| West Midlands |
1.07(0.92 to 1.25) p=0.384 |
1.05(0.85 to 1.30) p=0.652 |
1.00 |
0.88(0.75 to 1.04) p=0.135 |
1.03(0.89 to 1.19) p=0.713 |
0.82(0.70 to 0.97) p=0.019 |
0.96(0.81 to 1.13) p=0.610 |
East of
England |
0.89(0.76 to 1.03) p=0.115 |
0.92(0.75 to 1.12) p=0.407 |
1.00 |
0.94(0.81 to 1.09) p=0.400 |
0.98(0.85 to 1.12) p=0.736 |
0.89(0.77 to 1.03) p=0.124 |
0.89(0.76 to 1.05) p=0.169 |
| Greater London |
1.42(1.23 to 1.64) p<0.001 |
1.38(1.14 to 1.67) p=0.001 |
1.00 |
0.89(0.76 to 1.05) p=0.165 |
1.28(1.12 to 1.48) p<0.001 |
1.77(1.54 to 2.04) p<0.001 |
1.64(1.41 to 1.90) p<0.001 |
| South East |
1.00 |
1.00 |
1.00 |
1.00 |
1.00 |
1.00 |
1.00 |
| South West |
1.01(0.89 to 1.16) p=0.837 |
1.15(0.96 to 1.38) p=0.120 |
1.00 |
1.11(0.97 to 1.27) p=0.142 |
1.04(0.92 to 1.19) p=0.528 |
0.99(0.86 to 1.13) p=0.847 |
1.20(1.04 to 1.38) p=0.011 |
| Scotland |
0.84(0.71 to 0.99) p=0.039 |
1.11(0.90 to 1.37) p=0.329 |
1.00 |
0.97(0.82 to 1.14) p=0.688 |
0.77(0.65 to 0.90) p=0.001 |
0.66(0.56 to 0.78) p<0.001 |
0.84(0.70 to 1.00) p=0.046 |
| Wales |
1.25(1.03 to 1.51) p=0.027 |
1.19(0.92 to 1.55) p=0.187 |
1.00 |
0.89(0.72 to 1.10) p=0.300 |
1.08(0.89 to 1.31) p=0.417 |
0.98(0.80 to 1.20) p=0.817 |
1.11(0.90 to 1.37) p=0.327 |
| Adjusted model (adjusting for smoking, total calorie intake including alcohol, typical daily physical activity (METs), age, social class, education) (pseudo R2= 0.12) |
| North East |
1.14(0.89 to 1.47) p=0.303 |
0.77(0.56 to 1.06) p=0.107 |
1.00 |
0.71(0.56 to 91) p=0.006 |
0.71(0.55 to 0.91) p=0.007 |
0.67(0.53 to 0.86) p=0.002 |
0.74(0.58 to 0.95) p=0.019 |
| North West |
1.48(1.25 to 1.74) p<0.001 |
0.91(0.73 to 1.12) p=0.368 |
1.00 |
0.76(0.64 to 0.90) p=0.001 |
0.95(0.81 to 1.11) p=0.525 |
0.90(0.77 to 1.06) p=0.206 |
0.81(0.68 to 0.96) p=0.016 |
| Yorkshire and the Humber |
1.27(1.06 to 1.53) p=0.009 |
0.95(0.75 to 1.20) p=0.676 |
1.00 |
1.03(0.87 to 1.23) p=0.712 |
1.05(0.89 to 1.25) p=0.571 |
0.92(0.77 to 1.09) p=0.323 |
0.96(0.80 to 1.15) p=0.636 |
| East Midlands |
1.09(0.90 to 1.32) p=0.363 |
1.10(0.87 to 1.38) p=0.429 |
1.00 |
1.07(0.90 to 1.28) p=0.433 |
1.19(1.00 to 1.41) p=0.046 |
0.95(0.80 to 1.14) p=0.590 |
0.96(0.80 to 1.15) p=0.658 |
| West Midlands |
1.16(0.97 to 1.38) p=0.105 |
1.02(0.81 to 1.27) p=0.879 |
1.00 |
0.86(0.72 to 1.03) p=0.094 |
1.01(0.85 to 1.19) p=0.949 |
0.79(0.66 to 0.94) p=0.008 |
0.91(0.76 to 1.09) p=0.316 |
East of
England |
0.90(0.76 to 1.07) p=0.229 |
0.96(0.77 to 1.20) p=0.721 |
1.00 |
1.00(0.85 to 1.17) p=0.987 |
0.98(0.84 to 1.14) p=0.764 |
0.84(0.07 to 0.99) p=0.038 |
0.91(0.77 to 1.08) p=0.270 |
| Greater London |
1.23(1.04 to 1.45) p=0.015 |
1.37(1.11 to 1.68) p=0.003 |
1.00 |
0.89(0.75 to 1.05) p=0.178 |
1.14(0.97 to 1.33) p=0.107 |
1.46(1.26 to 1.70) p<0.001 |
1.45(1.23 to 1.70) p<0.001 |
| South East |
1.00 |
1.00 |
1.00 |
1.00 |
1.00 |
1.00 |
1.00 |
| South West |
1.07(0.92 to 1.25) p=0.392 |
1.09(0.90 to 1.32) p=0.381 |
1.00 |
1.11(0.96 to 1.29) p=0.157 |
1.01(0.87 to 1.17) p=0.909 |
0.99(0.85 to 1.14) p=0.860 |
1.18(1.01 to 1.37) p=0.032 |
| Scotland |
1.06(0.88 to 1.28) p=0.550 |
0.89(0.71 to 1.11) p=0.305 |
1.00 |
0.80(0.67 to 0.96) p=0.014 |
0.83(0.70 to 0.99) p=0.044 |
0.63(0.53 to 0.76) p<0.001 |
0.68(0.56 to 0.81) p<0.001 |
| Wales |
1.49(1.31 to 1.69) p=0.002 |
1.06(0.80 to 1.41) p=0.670 |
1.00 |
0.77(0.61 to 0.97) p=0.026 |
1.15(0.93 to 1.43) p=0.194 |
1.00(0.81 to 1.25) p=0.988 |
0.97(0.78 to 1.22) p=0.823 |
These observations remain true when the model is adjusted for physical activity and energy intake and smoking and for demographic characteristics; age, social class and education and show much the same results, in some cases slightly accentuated. The pseudo R2 value shows that the adjusted model explains 12% of variation in dietary pattern, compared to less than 1% in the unadjusted model. Most of this variation is explained by the energy intake adjustment.
Geodemographic analysis
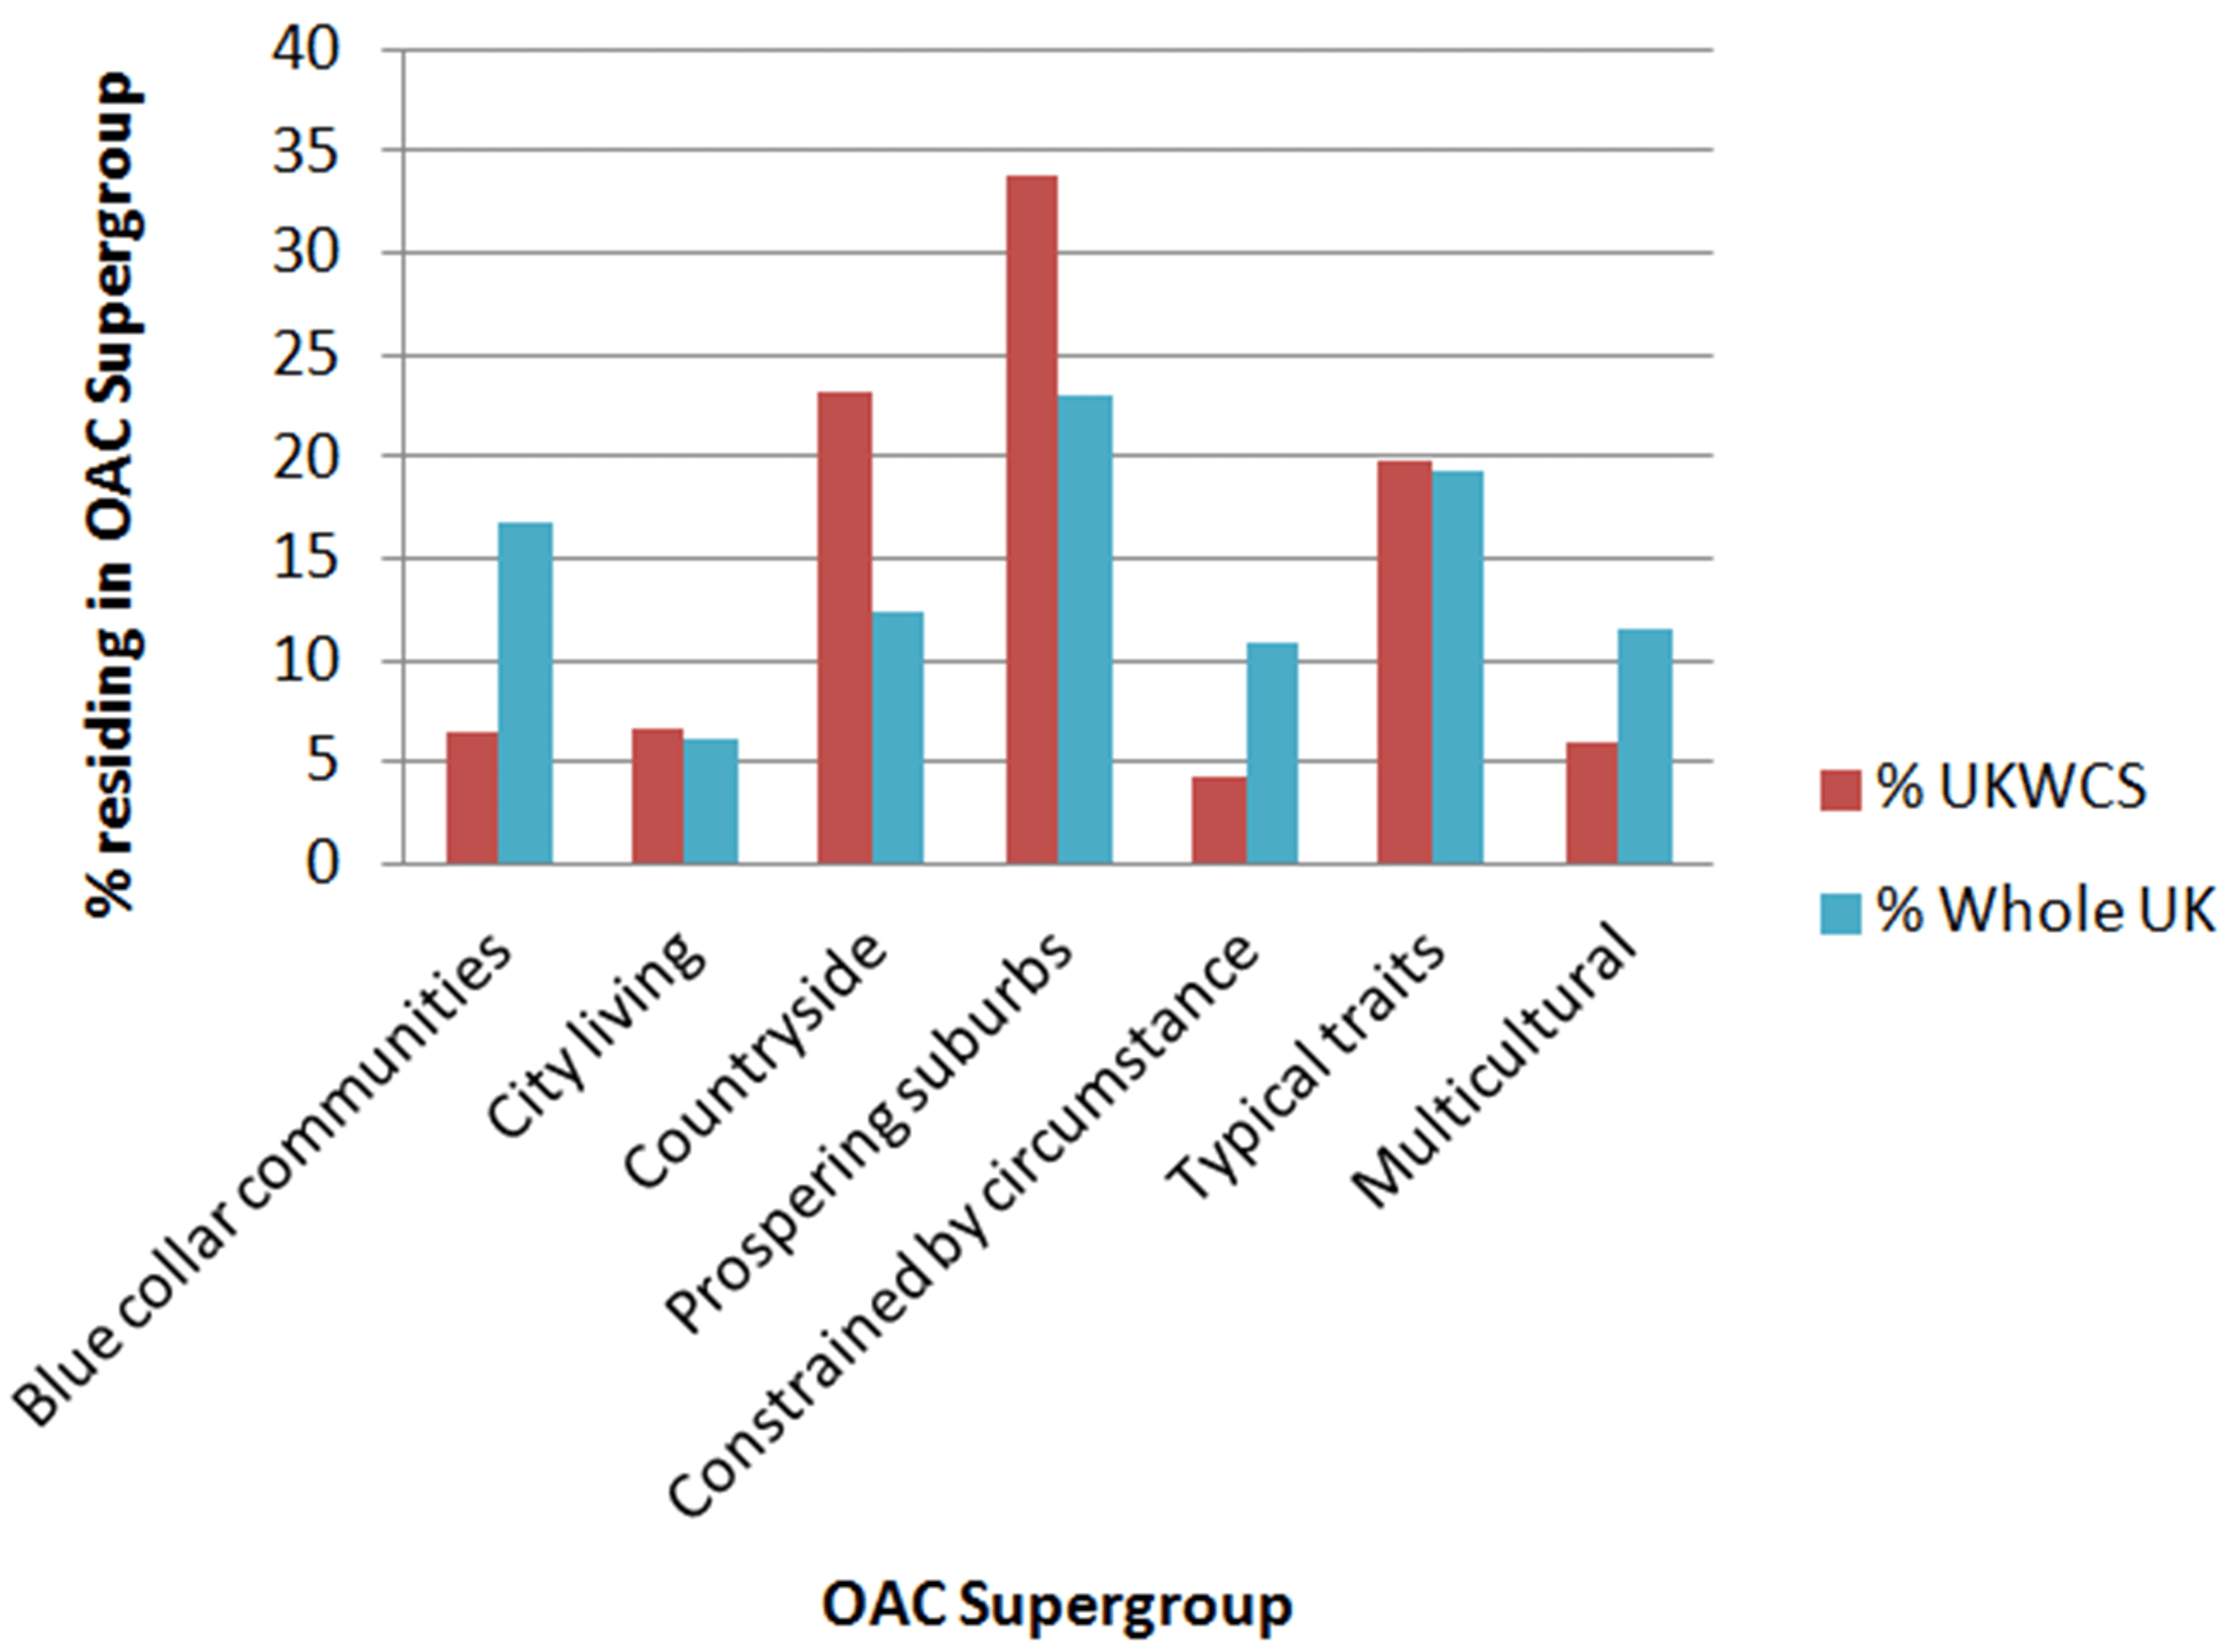
The UKWCS comprises women from each of the seven OAC Supergroups, with some over-representation in the ‘Prospering Suburbs’ and ‘Countryside’ and under-representation in the ‘Constrained by Circumstance’, ‘Blue Collar Communities’ and ‘Multicultural’ Supergroups (Figure 2). This is as expected in a predominantly middle class cohort of women. That said, there are still large numbers in each of the Supergroups.
Figure 2: UKWCS compared to the UK population, by OAC Supergroup
Significant variation for consumption of all dietary patterns by OAC Supergroup is observed (Figure 3). In general, variation is wider when considering differences by geodemographic Supergroup compared to by region, suggesting that the inclusion of demographic variables with geography could tell us something more interesting about dietary patterns.
Figure 3: Percentage of UKWCS women consuming each dietary pattern by OAC Supergroup
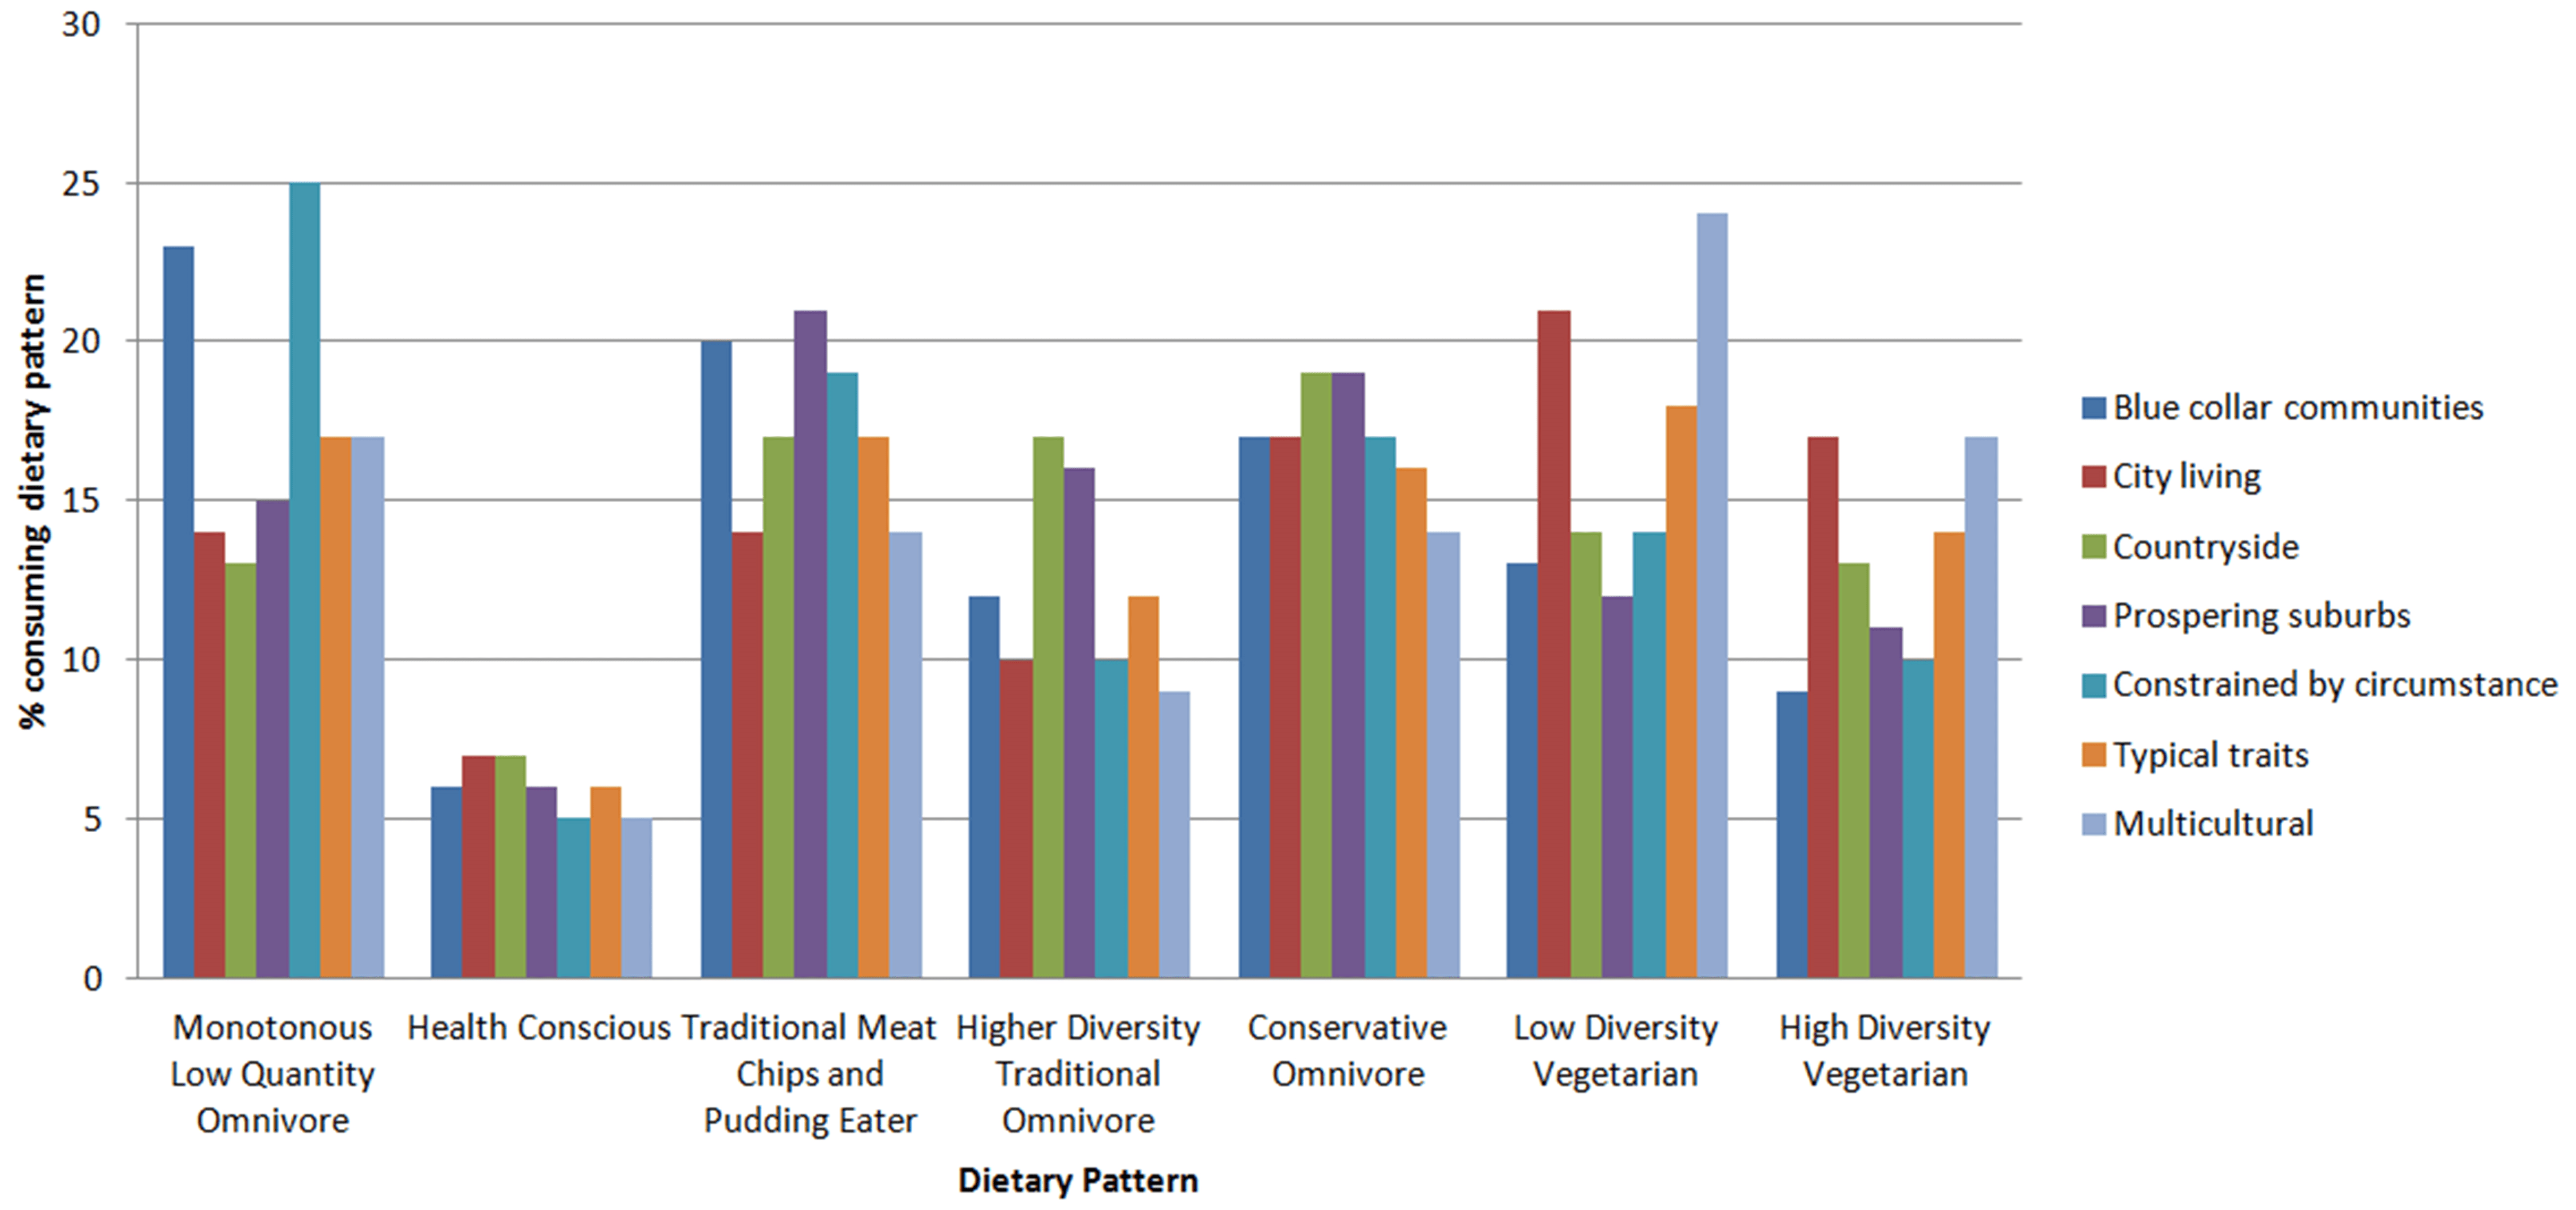
The multinomial regression model (Table 2) shows that OAC Supergroup has a significant relationship with dietary pattern consumption. The unadjusted model shows that the ‘Constrained by Circumstance’ group have a significantly elevated RRR of 1.33 (95% CI 0.11 to 1.59) for consuming the least healthy, “Monotonous Low Quantity Omnivore” dietary pattern whilst also having a significantly lower RRR for consuming the two most healthy dietary patterns, the “Health Conscious” (RRR=0.69 95% CI 0.51 to 0.93) and the “Higher Diversity Traditional Omnivore” (RRR=0.74 95% CI 0.59 to 0.92). The opposite is observed for the ‘Countryside’ Supergroups who have an increased likelihood of consuming the healthy patterns (“Health Conscious” RRR=1.33 95% CI 1.14 to 1.55 and “High Diversity Traditional Omnivore” RRR=1.37 95% CI 1.21 to 1.54) and decreased likelihood of consuming the unhealthiest, “Monotonous Low Quantity Omnivore” pattern (RRR=0.76 95% CI 0.68 to 0.86).
| Table 2: Regression models investigating whether OAC Supergroup predicts dietary patterns displaying Relative Risk Ratio (95% Confidence Interval) and p value |
|
|
Monotonous Low Quantity
Omnivore |
Health Conscious |
Traditional Meat Chips and
Pudding Eater |
Higher Diversity Traditional
Omnivore |
Conservative
Omnivore |
Low Diversity Vegetarian |
High Diversity
Vegetarian |
|
RRR (95% CI)
p value |
RRR (95% CI)
p value |
Ref. |
RRR (95% CI)
p value |
RRR (95% CI)
p value |
RRR (95% CI)
p value |
RRR (95% CI
p value |
| Unadjusted model (pseudo R2=0.007) |
| Blue Collar Communities |
1.16(1.00 to 1.36) p=0.054 |
0.87(0.69 to 1.10) p=0.206 |
1.00 |
0.81(0.68 to 0.97) p=0.022 |
0.87(0.74 to 1.02) p=0.095 |
0.65(0.55 to 0.78) p<0.001 |
0.57(0.47 to 0.69) p<0.001 |
| City Living |
1.05(0.88 to 1.26) p=0.587 |
1.55(1.23 to 1.95) p<0.001 |
1.00 |
1.05(0.87 to 1.28) p=0.611 |
1.36(1.14 to 1.61) p=0.001 |
1.56(1.32 to 1.84) p<0.001 |
1.59(1.33 to 1.89) p<0.001 |
| Countryside |
0.76(0.68 to 0.86) p<0.001 |
1.33(1.14 to 1.55) p<0.001 |
1.00 |
1.37(1.21 to 1.54) p<0.001 |
1.15(1.03 to 1.29) p=0.016 |
0.79(0.71 to 0.89) p<0.001 |
0.97(0.86 to 1.09) p=0.582 |
| Prospering Suburbs |
0.76(0.69 to 0.84) p<0.001 |
0.90(0.78 to 1.04) p=0.144 |
1.00 |
1.10(0.99 to 1.23) p=0.083 |
0.96(0.87 to 1.06) p=0.444 |
0.59(0.53 to 0.65) p<0.001 |
0.66(0.59 to 0.73) p<0.001 |
Constrained by
Circumstance |
1.33(0.11 to 1.59) p=0.002 |
0.69(0.51 to 0.93) p=0.015 |
1.00 |
0.74(0.59 to 0.92) p=0.008 |
0.91(0.75 to 1.10) p=0.330 |
0.71(0.58 to 0.86) p=0.001 |
0.67(0.54 to 0.83) p<0.001 |
| Typical Traits |
1.00 |
1.00 |
1.00 |
1.00 |
1.00 |
1.00 |
1.00 |
| Multicultural |
1.23(1.02 to 1.47) p=0.027 |
1.16(0.90 to 1.49) p=0.260 |
1.00 |
0.93(0.76 to 1.15) p=0.524 |
1.09(0.91 to 1.32) p=0.360 |
1.70(1.43 to 2.01) p<0.001 |
1.55(1.29 to 1.86) p<0.001 |
| Adjusted model (adjusting for smoking, total calorie intake including alcohol and typical daily physical activity (METs) (pseudo R2=0.10) |
| Blue Collar Communities |
1.25(1.06 to 1.48) p=0.009 |
0.79(0.62 to 1.00) p=0.050 |
1.00 |
0.72(0.60 to 0.87) p=0.001 |
0.95(0.80 to 1.12) p=0.526 |
0.70(0.59 to 0.83) p<0.001 |
0.55(0.05) p<0.001 |
| City Living |
0.88(0.73 to 1.07) p=0.208 |
1.66(1.32 to 2.10) p<0.001 |
1.00 |
1.10(0.90 to 1.34) p=0.349 |
1.24(1.04 to 1.48) p=0.019 |
1.48(1.25 to 1.75) p<0.001 |
1.64(0.15) p<0.001 |
| Countryside |
0.79(0.69 to 0.89) p<0.001 |
1.3(1.12 to 1.53) p=0.001 |
1.00 |
1.35(1.20 to 1.53) p<0.001 |
1.14(1.01 to 1.28) p=0.029 |
0.79(0.70 to 0.89) p<0.001 |
0.95(0.06) p=0.386 |
| Prospering Suburbs |
0.77(0.69 to 0.86) p<0.001 |
0.91(0.79 to 1.06) p=0.215 |
1.00 |
1.11(1.00 to 1.25) p=0.052 |
0.94(0.85 to 1.05) p=0.259 |
0.58(0.52 to 0.64) p<0.001 |
0.65(0.04) p<0.001 |
Constrained by
Circumstance |
1.40(1.16 to 1.71) p=0.001 |
0.66(0.49 to 0.90) p=0.008 |
1.00 |
0.69(0.55 to 0.86) p=0.001 |
0.98(0.80 to 1.20) p=0.859 |
0.75(0.61 to 0.92) p=0.005 |
0.66(0.08) p<0.001 |
| Typical Traits |
1.00 |
1.00 |
1.00 |
1.00 |
1.00 |
1.00 |
1.00 |
| Multicultural |
0.99(0.82 to 1.21) p=0.951 |
1.24(0.96 to 1.60) p=0.107 |
1.00 |
0.98(0.79 to 1.21) p=0.839 |
0.99(0.82 to 1.20) p=0.938 |
1.62(1.36 to 1.92) p<0.001 |
1.65(0.15) p<0.001 |
The adjusted model accounts for total energy intake and physical activity in order that observed effects can be assumed to be dietary pattern related and not due to the volume of energy intake or expenditure. Other variables, such as age, education and social class, which could be considered as confounders have not been adjusted for, as these variables are included in assignment of the OAC.
In the adjusted model, the relationships observed in the unadjusted models are unaffected when additionally adjusting for smoking, total calorie intake including alcohol, typical daily physical activity (METs), age, social class, education. They are in fact accentuated for the “Constrained by Circumstance” group (in comparison to the reference group “Traditional Meat, Chips and Pudding Eaters”: “Monotonous Low Quantity Omnivore” diet RRR=1.40 95% CI 1.16 to 1.71, “Health Conscious” RRR=0.66 95% CI 0.49 to 0.90, “Higher Diversity Traditional Omnivore” RRR=0.69 95% CI 0.55 to 0.86). The ‘Blue Collar Communities’ also show the same convincing pattern (in comparison to the reference group “Traditional Meat, Chips and Pudding Eaters”: “Monotonous Low Quantity Omnivore” diet RRR=1.25 95% CI 1.06 to 1.48, “Health Conscious” RRR=0.79 95% CI 0.62 to 1.0, “Higher Diversity Traditional Omnivore” RRR=0.72 95% CI 0.60 to 0.87).
Interestingly, in both the unadjusted and adjusted models, the ‘City Living’ and ‘Multicultural’ Supergroups are approximately 50% more likely to consume a vegetarian diet, with other Supergroups less likely, compared to the reference ‘Typical Traits’ Supergroup.
The pseudo R2 value indicates 10% of variation in dietary pattern is explained by the model. This is similar to that shown in the adjusted model using GOR.
DISCUSSION
Variations in dietary pattern consumption are observed both regionally and according to the geodemographic Supergroup in which the women live. These variations occur both within a dietary pattern across the Regions and Supergroups and also between dietary patterns within a Region or Supergroup. Analysis using a geodemographic classification provides more insight into spatial variations in dietary pattern in the UKWCS than analysis using GOR whilst controlling for certain demographic characteristics.
Results suggest an association between a healthy diet – illustrated by the “Health Conscious” dietary pattern and dietary diversity, illustrated by the “Higher Diversity Traditional Omnivore” – and being a member of the more affluent OAC groups. This is supportive of other research suggesting that a healthy diet is more expensive and therefore restricted by financial ability.24 The Family Spending report from the Living Costs and Food Survey25 indicates that the OAC Supergroups ‘Countryside’ and ‘Prospering Suburbs’ spend the most on food per week, which is also in line with our findings based on the assumption that a healthier diet is a more expensive one.
Unlike earlier studies using fruit and vegetable intake as a proxy measure of a healthy diet,12 in this study the “Health Conscious” dietary pattern incorporates more dietary components than just fruit and vegetable intake to represent dietary healthiness. A full spectrum of dietary diversity is also represented by the dietary patterns (as indicated by the pattern names). High dietary diversity appears to be associated with living in more affluent OAC Groups, and conversely dietary monotony correlates with the poorer areas. A conservative dietary pattern and the traditional dietary pattern have slightly higher concentrations in the deprived areas.
Summary characteristics for the UKWCS vary little by region from the mean values for the cohort as a whole. However, when the same characteristics are presented by OAC Supergroup variation is greater. The OAC uses variables such as age, occupation and education, as collected in the census. No information relating to diet is included in the census or the OAC, yet increased variation in dietary patterns by OAC rather than GOR is observed supporting evidence that socio-demographic characteristics influence diet,26 but also that small area geography – the immediate local environment – influences diet.27 Using the small geographic unit of Output Area (containing approximately 250 individuals) compared to the large geographical unit of a GOR (containing millions of individuals) produces results which will be much more relevant at a local area level.
STRENGTHS AND LIMITATIONS
The UKWCS, specifically designed to investigate the effect of dietary patterns on health outcomes, provides quality dietary data for analysis. Vegetarians were deliberately over sampled and as such make up a higher proportion in this cohort than in the general population. This means that this study is powered sufficiently to detect differences between different types of diet which is a strength of the design. Measurement of diet is subject to a range of potential bias including under or over reporting. Collecting information from a sample which is large enough to be generalisable to a given population is also challenging due to temporal and financial constraints, making this study a valuable resource.
Geographic location of participants was not a design factor for the UKWCS, so despite large numbers in each of the nine GORs of the England and Scotland and Wales these regions are not equally represented across the cohort. The lowest numbers (n=957) were observed residing in the North East. However, when considering this in the context of other dietary survey information, this is a large number of women on which to base robust analysis. The National Diet and Nutrition Survey (NDNS), for example, whilst it was designed to be geographically representative, only includes 3073 individuals in total (from the three year rollout) of which only about one quarter are women. The UKWCS sample is approximately 40 times the size of that national sample of women.
Recruitment of the UKWCS was on a volunteer basis from a WCRF mailing list of previous questionnaire participants so it may be expected that there is some volunteer bias. The women are predominantly middle age, middle class and white. This may account for the over representation observed when comparing the UKWCS to the whole UK population, in the ‘Countryside’ and ‘Prospering Suburbs’ Supergroups which are characterised by middle age, more middle class, white individuals with larger detached houses. Under representation is observed in ‘Blue Collar Communities’, ‘Constrained by Circumstance’ and ‘Multicultural’ Supergroups. Despite this there are large numbers of women in each of the seven OAC Supergroups, sufficient to provide confidence in the associations observed in this study.
The dietary patterns used, whilst data driven, are not necessarily comparable to dietary patterns used in other surveys. That said, they provide a comprehensive illustration of dietary patterns consumed in the UK. Comparing these to another data driven but not international classification, such as the OAC could be considered subjective, but this paper illustrates how different spatial measures can be useful in public health and specifically dietary research, rather than critique dietary patterns or geodemographic classifications.
For some geodemographic classifications, created by market research companies, the methods used to generate the classification are not transparent as these are the intellectual property of the company. This can be a limitation for use in research as it can make adjustment for confounding a guessing game. However, the methods used to generate the OAC are reported in full, allowing for researchers to have clear insight into the classification data they are using.
The OAC groups include all of the UK population who completed the Census questionnaire, so incorporate men and children in addition to women. Whilst the NDNS reports statistical differences between the food consumed by men and women (stratified both by region and whether or not the individuals are in receipt of benefits)28 it has not specifically reported whether there was a difference in the diets of men and women within the same household in the UK. With this in mind, the results of this study can only reliably be applied to women.
The dietary data used in this study were collected in the late 1990s. It is feasible that dietary habits could have changed since this time. However it is rare that dietary information of this quality is collected in such a large sample in the UK. Prospective dietary data collection is essential when considering influence on diseases with a latent development period, such as cancer. Collection dietary records for cancer cases can impact on subject recall of their diet.2 Therefore the application of these results with respect to the effect of diet on health is relevant, despite possible dietary change since the data was collected.
This study uses the UK as a case study. However, the methods are transferable elsewhere and it would be possible to carry out the same sort of analysis for other countries for which geodemographic classifications have been generated. An example, Callcredit group have generated geodemographic classifications for 40 countries worldwide.29
POLICY IMPLICATIONS
Dietary pattern variation between regions, with the exception of the “Health Conscious” dietary pattern (p=0.186), is statistically significant (p<0.01). Such variation at a large geographical scale is suggestive that there are regional influences on eating habits, not just that of the local surrounding area. Further investigation could be carried out into this regional variation; however, it may be erroneous to ascribe specific factors to a particular region, if certain areas within that region have a dominating influence on the dietary pattern. The regression analysis using region, including demographic variables, shows that some regions have significant RRRs of consuming a particular dietary pattern. For example Greater London has significantly increased risk, compared to those living in the South East, of consuming both the “Health Conscious” (most healthy) and the “Monotonous Low Quantity Omnivore” (least healthy) diet (compared to consuming the traditional diet). Observations like this mean that implementing a cost effective nutritional intervention at the regional level would be extremely difficult.
However, when we consider dietary pattern variation by geodemographic Supergroup the results present a clearer picture. Those living in a ‘Blue Collar Community’, for example have significantly increased risk of consuming the “Monotonous Low Quantity Omnivore” (least healthy) dietary pattern and a significantly reduced risk of consuming the “Health Conscious” and “High Diversity Traditional Omnivore” (two most healthy) dietary patterns, suggesting that it would be worthwhile implementing a healthy diet promotion in these types of areas. The regional regression model, controlling for age and education does not produce such clear results and the regression models using geodemographic Supergroups, indicating that the small scale geography combined with a number of demographic variables is a powerful tool. Combination of both the regional and Supergroup results could help to target interventions to certain types of areas within the region most at risk of consuming a poor dietary pattern.
Being able to estimate dietary patterns at a small area level using a classification such as OAC, allows for smarter targeting of public health interventions, to improve diet and subsequent health. For example, to provide a specific intervention to individuals to living in ‘Constrained by Circumstances’Supergroup (who consume the highest percentage of “Monotonous Low Quantity Omnivore” diets) which would encourage them to introduce more variety into their diets with the best addition being fruit and vegetables. This could be done through social services interventions in specific communities, or at a GP practice level in local communities.
FURTHER WORK
Future studies could investigate how consuming each of these dietary patterns could influence long term health, which would strengthen the relevance of this research to public health interventions. Another step would be to incorporate the cost of these dietary patterns in order to assess the economic influence of food price, compared to usage by geodemographic type. It would be key to profile the dietary patterns of this cohort for cities in the UK using a geodemographic classification and investigate patterns observed. Additional case studies from other countries would allow for international comparisons to be made.
CONCLUSION
Dietary pattern consumption is associated with where individuals reside. The type of area, using a small scale geographical unit, combined with demographic characteristics provides richer prediction of dietary consumption than the large regional unit. Healthy or diverse dietary patterns are more common in geodemographic groups in the ‘Countryside’ or ‘Prospering Suburbs’ with less healthy patterns in areas such as ‘Constrained by Circumstance’ and ‘Blue Collar Communities’. With this in mind it may be beneficial to use such classifications in the application of dietary advice to encourage healthy eating in order to promote long term health. Geodemographic classifications are a useful tool to better understand spatial variations in diet in the UK.
DATA SHARING STATEMENT
Further information on the UK Women’s Cohort Study Data is available at www.ukwcs.leeds.ac.uk
ACKNOWLEDGEMENTS
The main author was funded through and ESRC/MRC PhD studentship. The UKWCS was initially established using funding from the World Cancer Research Fund. Thanks to Dr. Lorna Fraser for advice with the regression analysis.
CONFLICTS OF INTEREST
None.
CONSENT STATEMENT
The study in the article has 35,000 participants who consented at the time of recruitment to the cohort in the 1990s, as described in the methods. In line with this consent, no personally identified information is included in this article.


