Advances in Food Technology and Nutritional Sciences

Open journal

ISSN 2377-8350

Fatty Acid Escape Hypothesis: The Pathway to Type-2 Diabetes

AbdulRahman Hamid Musleh Ali, Wesam Al-Kassas and Khawaja Husnain Haider*

Received: January 15th, 2019; Revised: February 2nd, 2019; Accepted: February 3rd, 2019; Published: February 5th, 2019

INTRODUCTION

The recent updates from world health organization (WHO) indicate that the number of patients with diabetes in the world has quadrupled to an estimated 422 million since the publication of first report by WHO in 1980.1 Likewise, obesity has doubled globally during the same time-period with more than 1.9 billion overweight and over 600 million obese adults worldwide.2 Given the clinical manifestations, Type-2 diabetes mellitus (T2DM) has always been considered as glucose-centric pathology, characterized by the legendary Hippocratic three “Ps”, i.e., polyuria, polydipsia and polyphagia.3 The underlying cause of T2DM is the loss of glucose homeostasis, a condition which is also shared by Type1 diabetes mellitus (T1DM). In terms of metabolic derangement, T1DM and T2DM are on the opposing ends of the disease spectrum: the former is depicted by hypoinsulinemia whereas the latter is characterized by hyperinsulinemia that emanates from body’s adaptive response to the tissue insulin resistance.4 Experimental animal studies have provided genetic evidence supporting the novel dogma that fatty acid (FA)-induced hyperinsulinemia is a driving factor for diet-induced obesity rather than directly inducing obesity on its own.5 Hyperinsulinemia has also been associated with obesity both in animal models and humans where excessive insulin is considered as a predictor of obesity.6,7 The tetrad of insulinemia, insulin resistance, hyperglycemia and diabetes are closely related with each other in a way that most T2DM patients will show all these features. In the light of this interplay of the tetrad, we redefine the state of T2DM which biochemically is considered as blinding of body tissues to the level of both glucose and insulin circulating in the blood that leads to a constant influx of high energy substrates like free fatty acids (FFAs) and glucose into the circulation. Based on review of literature, we attempt to define a commonality between T1DM and T2DM in terms of body’s shift to use lipids as fuel for energy when insulin sensitivity of the tissues or availability of insulin is low in the light of second-wave hypothesis of adipocytes.

INTERACTION BETWEEN FFAS AND INSULIN

FFAs are classified as short-chain (SCFAs; 1-6), medium-chain (MCFAs; 6-12) and long-chain (>12 carbon atoms; LCFAs) fatty acids with a significant role as energy substrates in the body.8 One of the mechanism by which FFAs contribute to glycolysis, gluconeogenesis and lipogenesis is via regulation of insulin secretion from the pancreatic β-cells.9 While short-term exposure of the β-cells to FFAs enhances insulin secretion, long-term exposure may cause significantly reduced insulin secretion due to lipotoxicity of the β-cells.10 Rodent and human islets of Langerhans showed increased secretion of insulin when challenged with FFAs in a glucose-dependent manner.11 More interestingly, the LCFAs, especially with higher saturation degree, were more effective than medium- and short-chain FFAs. At molecular level, they (especially the LCFAs) interact with G-protein coupled receptors-40 (GPCR40) in the pancreas to regulate insulin secretion and negatively influence insulin-mediated glucose uptake by the body tissues.9,12 Mechanistically, this is attributed to reduced glycogen synthesis and reduction in carbohydrate metabolism via early interruption of insulin signaling by FAs. It is speculated that increased lipid oxidation might be the underlying cause of diabetes and obesity associated insulin resistance. The postulated mechanism is that increased FFA oxidation cause elevation of the intra-mitochondrial acetyl-CoA/ CoA and nicotinamide adenine dinucleotide (NADH/NAD) ratios with subsequent inactivation of pyruvate dehydrogenase.13,14 This in turn causes the citrate concentration to raise that leads to inhibition phosphofructokinase and subsequent accumulation of glucose-6-phosphate (G-6-P) that inhibits hexokinase-II thus resulting in lower glucose uptake. However, subsequent studies have revealed decrease in the cellular G-6-P instead of elevated level needed to inhibit hexokinase-II.15

FFAs also have a direct effect on insulin-mediated glucose uptake and phosphorylation by amending the responsiveness of insulin receptors.16 Saturated FFAs have been generally implied in the development of insulin resistance whereas unsaturated FAs have protective effect on the metabolism. This distinction is based on their respective inflammatory and anti-inflammatory properties to disrupt insulin signaling in the cells.17 More recent studies have implied differential effects of FFAs on insulin signaling and glucose uptake relevant to their structure and saturation level.18 Treatment of human skeletal myotubes with palmitate (saturated FA) and oleic acid (unsaturated FA) and their combination significantly impaired 3H-labeld 2-deoxy-D-glucose uptake. However, at molecular level, assessment of the myotubes showed impaired insulinstimulated activation of Akt-serine473, AS-160 (Aktsubstrate of 160k Da protein), Glycogen synthase kinase 3 beta (GSk3B) phosphorylation and induction of stress-signaling phospho-Extracellular signal-regulated kinases (ERK) and c-Jun N-terminal kinases (JNK) (54k Da isoform) by palmitate treatment while these molecular changes were inhibited by combined treatment with oleic acid.18 These data explain a differential role of FFAs by which they interfere with insulin signaling but really fail to translate this affect into insulin-independent glucose uptake by the cells thus pointing to the interference and influence of other concomitantly working signaling mechanisms.

Despite sufficient evidence in the published data that FFAs cause insulin resistance, some contriving reports in this regard from early investigators attribute their effect to the duration FFAs in the blood.19 Assessment during acute phase (within 90 minutes) of FFAs infusion showed no effect in terms of insulin resistance while chronic exposure to FFAs increased insulin resistance irrespective of the rate of infusion.20 A common feature of these studies is the time duration of only 2 hours of FFAs infusion to impart their effect which is insufficient for the FFAs to modulate the insulin receptor activity. This information is critical and explains that the rapid postprandial rise in the plasma level of triacylglycerides (TAG) does not cause insulin resistance; rather chronically high plasma level TAG in most T2DM patients would play a major role in insulin resistance in these patients.21 In summary, the saturation status of FFAs and duration of exposure to FFAs are important determinants of tissue insulin resistance.

EFFECT OF GLUCOSE ON ADIPOSE TISSUE (SECOND-WAVE ADIPOCYTE HYPOTHESIS

Insulin promotes euglycemia via tissue uptake of glucose while blood glucose homeostasis is swayed towards hyperglycemia due to tissue insulin resistance.22 Akin to any other body cell, adipocytes are sensitive to glucose changes in their microenvironment. With better understanding of their role in energy balance, they are being considered as critical integrators of glucose homeostasis.23 Studies with 3T3-L1 adipocytes showed that the cells cultured in 5 mM glucose grew with normal phenotype and were responsive to insulin mediated glucose uptake and inhibition of lipolysis pathways as compared to the 3T3-L1 cells cultured in 25 mM glucose.24 More importantly, high glucose culture conditions significantly influenced the insulin-induced 3T3-L1 adipose cell differentiation besides influencing differentiation-directed insulin signaling pathways in glucose concentration-dependent fashion. Long-term exposure to high glucose concentration during adipogenesis and short-term exposure of mature adipocytes to glucose promote TAG accumulation in the 3T3-L1 cells.25 These molecular changes have been attributed to the impaired metabolic functions in the adipocytes upon exposure to high glucose concentration. A direct comparison of 3T3-L1 adipocytes cultured in 4 mM and 25 mM glucose also showed that the cells cultured in high glucose culture conditions developed insulin resistance. Similar observations were made in the adipocytes from rats with Streptozococin (STZ)-induced diabetes.26

Molecular studies in vitro as well as in vivo using adipocytes isolated from STZ-treated hyperglycemic rats have also shown elevated levels of ROS with simultaneous low level secretion of pro-inflammatory interleukin-6.26 ROS levels in the 3T3-L1 adipocytes can be reduced either by pharmacological treatment of the cells with the drugs which reduce mitochondrial membrane potential or by the over expression of uncoupling protein-1 (UCP1) (27), which is essential role for optimal mitochondrial function.27 Transduction of adipocytes with adenovirus encoding for UCP-1 showed that phosphorylated Akt levels were not affected by insulin despite significant reduction of review of systems (or symptoms) (ROS) in UCP1 expressing adipocyte. Moreover, insulin receptor substrate-1 (IRS-1) significantly increased in the insulin-induced phosphorylation of serine307 and serine636 under hyperglycemic conditions, both of which have been implicated in the reduced insulin-sensitive state.28,29 Phosphorylation of tyrosine608 that is important for interaction between IRS-1, phosphatidylinositol 2-kinase and PTP2C was significantly increased under normoglycemic conditions. These data support the idea that adipose tissue adopts insulin-resistant phenotype when exposed to hyperglycemia. It is pertinent to mention that induction of adipogenic phenotype using high glucose concentration (25 mM) has little clinical relevance. This high glucose-induced adipose tissue in the biological system functions in a limited range of biological activity. For example, adipose tissue maintains a relatively steady flux of TAGs into the blood during fasting. On the other hand, the time for the adipose tissue to buffer the blood FFAs is prolonged after dietary ingestion of high caloric diet due to inherent insensitivity.30 Such deleterious activity of the adipose tissue during hyperglycemia deteriorates glucose homeostasis even further.

14C-integration analysis in genomic DNA has shown 50% adipose tissue renewal in the body in 9-years, with 10% fat cell renewal/year without any change in the total number of adipocytes at all adult ages.31,32 These data has led to the hypothesis of a second-wave of adipocytes that show genetic changes as an adaptive response against glucotoxicity. The second-wave adipocytes which achieve adaptive genetic priming not only show insulin resistance but are also slow to restore their insulin sensitivity. If this hypothesis holds good, it explains the chronicity of T2DM and stress the significance of developing early screening program for patients that would alter the treatment outcome.33

ADIPOCYTE MITOCHONDRIAL RESPONSE TO ELEVATED SUBTRATE LEVELS

The mitochondria has significant role in lipolysis and lipogenesis such that obesity is associated with mitochondrial dysfunction.34 The mitochondria in the adipocytes contain several proteins, i.e., decarboxylase carrier (DIC) and phosphoenolpyruvate carboxykinase (PEPCK) that facilitate the exchange of metabolites across its membrane. While DIC is involved in the transport of citrate, PEPCK-2 (the mitochondrial isozyme PEPCK-M encoded by PCK2 gene) catalyzes the GTP-stimulated conversion of oxaloacetate to phosphoenolpyruvate for glyceroneogenesis that allows the synthesis of glycerol backbone for FA re-esterification.35 Transgenic overexpression of PEPCK increased glycerogenesis, re-esterification of FFAs, adipose mass and body weight in mice.36 Contrarily, gene deletion of cytosolic PEPCK caused severe hypoglycemia by day 2 after birth in a mice model besides 2-3 fold higher liver triglyceride contents as compared to the normal control littermates.37 At molecular level, it involves co-operative action of citrate, dicarboxylate and phosphate carriers. Whereas citratecarrier mediates efflux of citrate from mitochondrial matrix into the cytoplasm in exchange for malate, DIC mediates the exchange of malate with phosphate, and phosphate-carrier then mediates the exchange of phosphate with hydroxyl ion, resulting in a net transport of citrate to the cytoplasm (Figure 1). DIC as a mitochondrial membrane protein has a pivotal role in FA metabolism and its expression is regulated by the substrates and by insulin;

Figure 1. Transport of Citrate Across the Mitochondrial Membrane into the Cytosol

The mitochondrial transporters cooperate for citrate flux into the cytosol where it is converted into oxaloacetate before phosphoenolpyruvate carboxykinase (PEPCK) enzyme converts it into enolpyruvate for further use in glyceroneogenesis. Glycerol thus synthesized is esterified with free fatty acids for the formation of triacylglycerides(TAG). 

DROJ-5-140Fig1


MOLECULAR PATHWAY OF INSULIN RESISTANCE IN ADIPOCYTES (FATTY ACID ESCAPE HYPOTHESIS PART-I

Loss of glucose and lipid homeostasis is linked to many bioactive molecules released from the visceral adipocytes, i.e., tumor-necrosis factor-α (TNF-α), resistin, leptin, and adiponectin besides.40 Lipid-overloaded hypertrophied adipocytes are resistant to insulin without the involvement of adipocytes inflammatory status as a contributory factor.41 From amongst the FFAs, monounsaturated FFAs cause hypertrophy whereas saturated FFAs cause pro-inflammatory response in the adipocytes. The hypertrophied adipocytes, characterized by the presence of uni-locular lipid droplets, show impaired insulin-dependent glucose uptake which was accompanied by defective Glucose transporter type 4 (GLUT4) trafficking.

A dysregulated FFA metabolism is one of the primary causes of insulin resistance due to preferential oxidation of FFAs over glucose in T2DM thus supporting FFAs as a novel target to treat insulin resistance in T2DM.18,42 Signals from apparently unrelated pathways can inhibit insulin signaling by heterologous desensitization. Studies have focused on Ser/Thr phosphorylation of internal revenue service (IRS) proteins as a key feedback control mechanism to abrogate signal transduction in response to insulin.43,44 TNFα, FFAs and cellular stress play a significant role in activation of Ser/Thr kinases to phosphorylate the IRS proteins and inhibit their function via their uncoupling from their upstream and downstream effectors in response to insulin to promote insulin resistance.45,46

Insulin binding to its receptor (IR) autophosphorylates its tyrosine residues followed by downstream activation of Akt, Protein Kinase Cζ (PKCζ), mammalian target of rapamycin (mTOR) and IKKβ (I-kappa B kinase β). The excessive presence of FFAs and TNFα effects insulin signaling in the tissues by activation of the downstream signals i.e., PKC, IKKβ, through different pathways that allow them to phosphorylate and inhibit IRS even before insulin binds to its receptor. As the level of inhibitors rise as part of the disease process, IRS fails to activate Akt thus abrogating translocation of GLUT-4 transporter from the cytoplasm to the cell membrane thus leading to much reduced glucose uptake (Figures 2A, 2B).47

Figure 2A. Insulin Signaling Pathway and the “Insulin Sensitive State”

Insulin binding with its receptor (IR) activates the insulin receptor substrate-1 (IRS-1) which is the major substrate of the insulin receptor. Downstream to the activation of IRS-1, activity of phosphoinositol triphosphate kinase (PI3K) which is an integral part this signaling complex, generates phosphoinositol 3,4-biphosphate and phosphoinositol 1,3,4-triphosphate that lead to the activation of Protein Kinase B (Akt2). The activation of Akt thus causes membrane trafficking of GLUT4 transporter to permit glucose uptake from the circulation.

DROJ-5-140Fig2A


Figure 2B. The State of Insulin Resistance “TNF-α Signaling Pathway”

The binding of (TNF-α) with its receptor leads to activation of NFkβ-IKKβ pathway that causes failure of insulin receptor and insulin receptor substrate-1 (IRS-1) activation in response to insulin binding with its receptor on the cell surface. These molecular events impairs the activation of Protein Kinase B (Akt) thus resulting in failure of membrane trafficking of Glut-4 transporter and development of resistance to glucose uptake in response to insulin binding with its receptor.

DROJ-5-140Fig2B


THE FATTY ACID ESCAPES HYPOTHESIS PART-2: ADIPOCYTES RESPONSE TO ENERGY FLOOD

Excessive energy intake provokes the adipose tissue to undergo dynamic remodeling characterized by adipocyte hypertrophy and hyperplasia. Whereas these two modes of remodeling diverge in many aspects including adipocyte size and number, recruitment of inflammatory cells, release of adiponectin and pro-inflammatory cytokines, hypoxia and fibrosis (all increasing in case of hypertrophy), they have a common feature in terms of FFAs release.48 Both of these modes of remodeling are part of adipocytes’ contribution to energy homeostasis.

Adipocytes are active secretors of bioactive molecules which, besides protecting themselves, also contribute towards metabolism, immunity, inflammation, matrix remodeling, vasculogenesis and many more physiological functions.49 IKKβ-deficient mice are at a higher risk of increased adipocyte death; higher macrophage infiltration and defective adaptive adipose remodeling that also lead to increased lipolysis, higher release of FFAs and impaired insulin signaling.50 Molecular studies have shown a key role for IKKβ in adipocyte survival. Histological studies in high fat diet-fed obese mice show an increase in hypoxia induced factor-1 alpha (Hif-1α) due to large adipocyte volume and the higher oxygen demand that might not be compensated by neo-angiogenesis and hence remains instrumental in adipocyte apoptosis while knockdown of Hif-1α decreased adiposity with concomitant improvement in insulin sensitivity.51,52 These molecular changes are accompanied by gross infiltration by immune cells including M1 and M2 macrophages which participate in the remodeling process as the key players.53 These cells release a plethora of pro- and antiinflammatory adipokines, i.e., leptin, resistin, adiponectin, vistatin as well as cytokines and chemokines, i.e., IL6, TNF-α and monocyte chemo attractant protein-1 (MCP-1) which act in autocrine, paracrine and systemic manner to produce their effects.54,55

As the pro-inflammatory and anti-inflammatory molecules outbalance each other and the degree of inflammation in the adipose tissue increases beyond the level of healthy expansion, a spill-over of inflammatory cytokines into the blood causes a low grade chronic inflammatory state. These molecular changes cause loss of sensitivity to insulin with a simultaneous increase in lipolysis, which initiates FFAs escape to the circulation thus augmenting a vicious cycle that climaxes into global tissue insulin resistance. FFAs and chronic inflammation together form an ominous combination to induce insulin resistance in other tissues via ectopic fat deposition with the former and receptor signaling into cells by the latter.

ECTOPIC FAT DEPOSITION “VISCRAL FAT”

Visceral fat (VF) and subcutaneous fat (SCF) have distinct cellular and molecular characteristics and diverge in terms of anatomical distribution.56 Besides other differences, VF and its resident macrophage population release more inflammatory cytokines i.e., TNF-α and IL-6, show higher lipoprotein lipase activity and higher release of FFAs as compared to SCF.57,58 Epidemiological studies have substantiated these observations and report that in comparison with SCF, VF correlates more with insulin resistance.59 However, SCF cell volume change is more strongly correlated with insulin sensitivity rather than fat cell number which remain nearly constant.60

In view of the FFA escape hypothesis discussed earlier, SCF will be the prime site for fat disposition albeit with marked variability among individuals due to wide variety of factors not discussed here. This may result in the development of “obesity-healthy phenotype (OH-phenotype)” in healthy-obese subjects whereas in lean subjects with “insulin resistance phenotype (IR-phenotype)”. In other words, when SCF storage capacity doesn’t match with the positive energy balance then FFAs will be re-routed to deposit as VF thus leading to high circulatory FFAs. This also makes VF to positively correlate with metabolic syndrome. A direct comparison of adipocytes from different fat tissues shows that the percentage of small size adipocytes is higher in SCF and omental fat (OMF) in normoglycemic subjects as compared to the hyperglycemic patients.61 A similar but statistically insignificant trend has also been observed in the mesenteric fat derived adipocytes. VF adipocytes show higher catecholamine-induced lipolysis and reduced sensitivity to insulin-mediated lipogenesis thus maintaining a higher level of circulating FFA in the blood that would augment tissue insulin resistance.62 VF tissue shows enhanced responsiveness to the lipolytic effect of circulating catecholamine that makes VF sensitive to exercise.63

VF adipocytes also show a distinct genetic profile as compared to SCF and epigastric adipose tissue that may be an important contributory factor towards their insulin resistance and therefore, can be classified as “IR-phenotype”.64 The steady-state messenger ribonucleic acid (mRNA) levels for lipoprotein lipase (LPL) as well as LPL mass are lower in omental fat (OMF) than subcutaneous fat (SCF); however, the specific LPL activity is greater in OMF as compared with to SCF tissue.65 Insulin increases the levels of LPL mRNA and LPL activity in abdominal SCF but not in the OMF, whereas glucocorticoids increase the LPL mRNA and LPL activity more in OMF, particularly in men.66 Moreover, insulin and glucocorticoids synergistically affect the activity of LPL in both OMF and SCF; however SCF is more sensitive to glucocorticoids in the presence of insulin. The LPL activity normally is higher in OMF than SCF. Insulin not only effects LPL mRNA expression, it also regulates the LPL activity via posttranslational mechanism which is more significant in the SCF tissue as compared to OMF tissue and the latter is inherently insensitive to insulin.67 It is important to mention that LPL activity needs to be coupled with acylation stimulating protein (ASP) enzymes which will upregulate the process of re-esterification and TAG formation.68 As this mechanism is more significant in SCF tissue in comparison with OMF tissue, it renders the former more effective in TAG clearance via rapid incorporation of the formed FFA into intracellular TAG. On the contrary, OMF tissue releases more FFA in the circulation because the hydrolysis is not accompanied with TAG formation.68 When insulin resistance is developed in SCF tissue, it practically adopts OMF tissue phenotype thus losing its ability to clear the endogenous or exogenous TAG. The OMF tissue expansion thus becomes more prominent during this stage as it also competes with SCF in the storage. This derangement culminates into OMF tissue expansion with higher portal FFA level that is going to affect the liver insulin sensitivity as discussed in the next section.

ECTOPIC FAT DEPOSITION “LIVER”

Insulin from the pancreas and the VF derived FFAs pass through the liver and get partially cleared before their drainage into the systemic circulation. Hence, the level of insulin in the portal circulation is much higher as compared to systemic circulation. Similarly, liver has a significant role in the trafficking of FFAs. FFAs with greater whole body flux as compared to the lean tissue in obese than non-obese individuals undergo conversion to TAG in the liver, packaged into VLDL and poured back into systemic circulation to cause hypertriglyceridemia.69 A chronically increased flux of systemic as well as visceral FFAs overloads the liver to cause hepatic changes thus leading to decline in hepatic insulin clearance which will occur when hepatic insulin resistance develops.70 Hepatic glucose uptake is independent of insulin stimulation; however, insulin action in the liver is important to direct excess glucose to glycogenesis. When insulin action on the hepatocytes is abrogated, the metabolic pathway will revert to gluconeogenesis with efflux of glucose to the systemic circulation to cause hyperglycemia.70

ECTOPIC FAT DEPOSION IN SKELETAL MUSCLES

TAGs in the muscle tissue form intramuscular triglyceride (imTG) pool and constitute dynamic lipid storage in the cytoplasm of the skeletal muscle cells.71 The imTG pool generally gets expanded in the event of excess lipid availability and provides a source of energy substrate when required.72 It is assumed that the imTG pool is replenished by FFAs from the plasma which is transported into intramuscular cytosol prior to undergoing mitochondrial oxidation. In an interesting study, infusion of 14C-labeled oleic acid led to 14CO2 release within 30-minutes of treatment even though the steady state of FA uptake was achieved within 5-10 minutes.73 The release of 14CO2 continued for 7 days of observation which showed that the FA after infusion became part of the imTG pool before undergoing oxidation in the mitochondria. A similar study with improved methodology using Pulse-chase, dual-isotope, muscle biopsy approach has shown that imTG stores are used primarily, if not solely, as local oxidative fuel.74 FFAs from plasma get incorporated into imTG during exercise thus accounting for a stable imTG pool size after the exercise session and concomitantly contribute to obviate FFA-induced insulin resistance.75 Put together, these studies imply that fat disposition in skeletal muscles involves multi-stepα enzyme-controlled processes for TAG formation which are then hydrolyzed to FAs ordained for oxidation.

Athletes have a large imTG pool, however with preserved insulin sensitivity which is also known as athlete’s paradox.76 In other words, the imTG pool in the skeletal muscles of athletes is primed to provide substrate for energy production and is not primarily meant for TAG storage. On the contrary, obese individuals also have increased imTG pool which is destined for storage of the high circulating FFAs besides its association with insulin resistance.77 This leads to accumulation of FA metabolites, i.e., diacylglycerol (DAG) as well as increased intracellular synthesis of ceramide that mediates insulin resistance. Treatment of cultured mice myocytes with insulin and/or palmitate has shown that insulin is a potent stimulator of ceramide production while combination of palmitate and insulin show a synergistic effect in ceramide synthesis.78 It is however pertinent to mention that this is not the only insult that increases skeletal muscle insulin resistance; it combines with low grade chronic inflammatory state and the hepatic production and secretion of ceramide to interact through intracellular mechanisms culminating in the IRS inactivity and the reduction of glucose transporter translocation and decrease skeletal muscle uptake of glucose. As skeletal muscle in the body is primarily responsible for blood glucose uptake, their resistance to insulin besides the unsuppressed hepatic glucose production lead to hyperglycemia.

CONCLUSION

Increased FFA flux from adipose tissue and tissue insulin resistance together constitute major predictors of ectopic fat accumulation. While increased imTG accumulation is associated with skeletal muscle insulin resistance, cardiac steatosis is associated with left ventricular dysfunction and premature death. Similarly, deposition of fat in and around the pancreas is associated with impaired β-cell function. This aberrant fat partitioning may be explained by the FFAs escape model and the second-wave hypothesis of differentiated adipocyte population. The role of cytosolic fatty acid binding proteins which are abundantly expressed in tissue specific manner and, carnitine and their acyl esters (acylcarnitine)should be considered for their role in intracellular transport of FAs during FA catabolism. Most patients who develop “diabesity” (obesity related diabetes) would follow the sequence of derangement as depicted in Figure 3. Patients with T2DM who characteristically present with insulin resistance and “the positive energy balance” have the matching adipose tissue-relevant metabolic profile, i.e., high lipolysis and low lipogenesis, with the one observed in hormonally mediated diabetes i.e., Cushing’s syndrome. Similarly, while T1DM primarily results from β-cell failure, T1DM patients also show low lipogenesis and higher lipolysis due to activation hormone sensitive lipase in the adipose tissue in the absence of insulin. Put together, low lipogenesis with concomitant higher lipolysis remain the cardinal features to diabetes irrespective of its type and underlying etiology.

Figure 3. FFA Escapes Hypothesis

Starting from label1 when peripheral adipose tissue undergoes healthy expansion, it may culminate into Metabolic healthy obese “MHO”. However, in case that adipose tissue expansion is ineffective will be accompanied by an inflammatory response, macrophage invasion occurs. Then free fatty acids (FFAs) and TNF-α spilling over into the systemic circulation. The omental fat (OMF) expansion causes pouring of FFA into the portal circulation. Hepatic clearance of insulin gets reduced and higher level of very low density lipoprotein (VLDL) and other metabolites are produced and secreted into systemic circulation. Skeletal muscles become resistant (see picture above) and systemic insulin resistance sets in as well. Triggered by the “positive energy balance”, disturbed homeostasis mentioned above gives rise to the metabolic profile observed in “Diabesity”.

DROJ-5-140Fig3


Contriving the long-standing dogma that hyperglycemia is the main player in the pathogenesis of T2DM; our hypothesis implies that hyperglycemia is a mere consequence of body’s shift to lipid metabolism as the primary energy source. Hence, there is a need to redefine it as a disease variant characterized by hyperglycemia which in fact is a very late manifestation of the chronically disturbed body metabolism. Furthermore, this urges the use of markers other than blood glucose, either alone or in combination, i.e., serum FFAs, ceramide, and insulin levels due to their early appearance during the disease onset. Using blood sugar level as a marker is akin to leaving the diagnosis as well as treatment until too late. Similarly, our model proposes that that T2DM can be reversed until the adipose tissue remains responsive to insulin.

In conclusion, we are aiming to establish a unifying hypothesis that would contribute in defining and future development of a holistic treatment approach that could reverse the whole body metabolic abnormalities rather than managing the blood parameters alone without addressing the root cause of the problem. Our hypothesis may explain the underlying cause of the emerging concept of ‘double diabetes’ as well.

COMPLIANCE WITH ETHICAL STANDARDS

This article does not contain any studies with human participants or animals performed by any of the authors.

CONFLICT OF INTEREST

The authors declare that they have no conflicts of interest.

1. World Health Organization (WHO). Diabetes. Global report on diabetes. Website. http://www.who.int/diabetes/global-report/

2. World Health Organization (WHO). Obesity and overweight. Website. http://www.who.int/mediacentre/factsheets/fs311/en/

3. Das AK, Shah S. History of diabetes: from ants to analogs. J Assoc Phys India. 2011; 59 Suppl: 6-7.

4. Templeman NM, Skovso S, Page MM, Lim GE, Johnson JD.  A causal role for hyperinsulinemia in obesity. J Endocrinol. 2017; 232(3): R173-R183. doi: 10.1530/JOE-16-0449

5. Mehran AE, Templeman NM, Brigidi GS, et al. Hyperinsulinemia drives diet-induced obesity independently of brain insulin production. Cell Metab. 2012; 16(6): 723-733. doi: 10.1016/j.cmet.2012.10.019

6. D’souza AM, Johnson JD, Clee SM, Kieffer TJ. Suppressing hyper-insulinemia prevents obesity but causes rapid onset of diabetes in leptin-deficient Lepob/ob mice. Mol Metab. 2016; 5: 1103-1112. doi: 10.1016/j.molmet.2016.09.007

7. Odeleye OE, de Courten M, Pettitt DJ, Ravussin E. Fasting hyperinsulinemia is a predictor of increased body weight gain and obesity in Pima Indian children. Diabetes. 1997; 46(8): 1341-1345. doi: 10.2337/diabetes.46.8.1341

8. Schonfeld P, Wojtczak L. Short- and medium-chain fatty acids in  the energy metabolism – the cellular perspective. J Lipid Res. 2016; 57: 943-954. doi: 10.1194/jlr.R067629

9. Yasuaki I, Yuji K, Masataka H, et al. Free fatty acids regulate insulin secretion from pancreatic beta cells through GPR40. Nature. 2003; 422(69280): 173-176. doi: 10.1038/nature01478

10. McGarry JD, Dobbins RL. Fatty acid, lipotoxicity and insulin secretion. Diabetologia. 1999; 42: 128-138. doi: 10.1007/s001250051130

11. Gravena C, Mathias PC, Ashcroft SJH. Acute effects of fatty  acids on insulin secretion from rat and human islets of Langerhans. J Endocrinol. 2002; 173: 73-80. doi: 10.1677/joe.0.1730073

12. Boden G, Chen X, Ruiz J, White JV, Rossetti L. Mechanisms of fatty acid-induced inhibition of glucose uptake. J Clin Invest. 1994; 93(6): 2438-2446. doi: 10.1172/JCI117252

13. Randle PJ, Garland PB, Hales CN, Newsholme EA. The glucose fatty-acid cycle: Its role in insulin sensitivity and the metabolic disturbances of diabetes mellitus. Lancet. 1963; 1: 785-789. doi: 10.1016/S0140-6736(63)91500-9

14. Randle PJ, Garland PB, Newsholme EA, Hales CN. The glucose fatty acid cycle in obesity and maturity onset diabetes mellitus. Ann NY Acad Sci. 1965; 131: 324-333. doi: 10.1111/j.1749-6632.1965.tb34800.x

15. Roden M. How free fatty acids inhibit glucose utilization in human skeletal muscle. News Physiol Sci. 2004; 19: 92-96. doi: 10.1152/nips.01459.2003

16. Roden M, Price TB, Perseghin G, et al. Mechanism of free fatty acid–induced insulin resistance in humans. J Clin Invest. 1996; 97(12): 2859-2865. doi: 10.1172/JCI118742

17. Sears B, Perry M. The role of fatty acids in insulin resistance. Lipids Health Dis. 2015; 14: 121. doi: 10.1186/s12944-015-0123-1

18. Mäkinen S, Nguyen YH, Skrobuk P, Koistinen HA. Palmitate and oleate exert differential effects on insulin signaling and glucose uptake in human skeletal muscle cells. Endocrine Connections. 2017; 6: 331-339. doi: 10.1530/EC-17-0039

19. Wolfe BM, Klein S, Peters EJ, Schmidt BF, Wolfe RR. Effect of elevated free fatty acids on glucose oxidation in normal humans. Metabolism.1988; 37(4): 323-329. doi: 10.1016/0026-0495(88)90131-X

20. Kelley DE, Mokan M, Simoneau JA, Mandarino LJ. Interaction between glucose and free fatty acid metabolism in human skeletal muscle. J Clin Invest. 1993; 92: 91-98. doi: 10.1172/JCI116603

21. Lv ZH, Ma P, Luo W, et al. Association between serum free fatty acid levels and possible related factors in patients with type 2 diabetes mellitus and acute myocardial infarction. BMC Cardiovasc Disord. 2014; 14: 159. doi: 10.1186/1471-2261-14-159

22. Cefalu WT. Insulin resistance: Cellular and clinical concepts. Exp Biol Med (Maywood). 2001; 226: 13-26. doi: 10.1177/153537020122600103

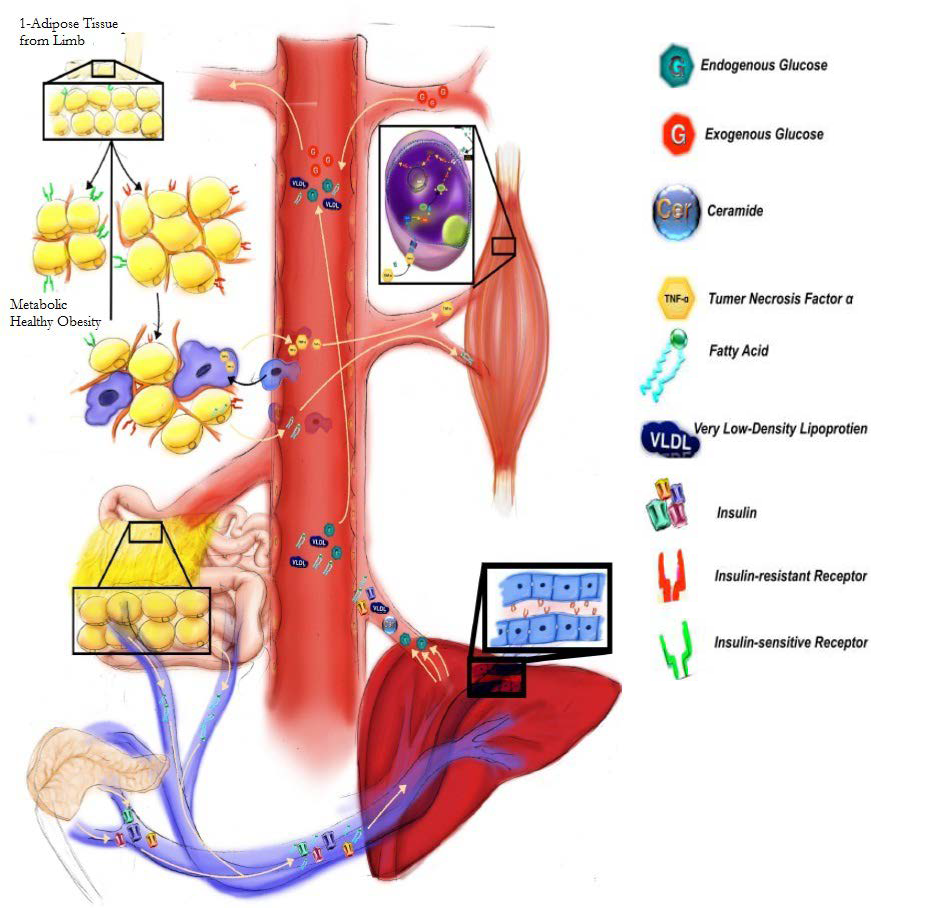
23. Rosen ED, Spiegelman BM. Adipocytes as regulators of energy balance and glucose homeostasis. Nature. 2006; 444(7121): 847-853. doi: 10.1038/nature05483

24. Gagnon A, Sorisky A. The effect of glucose concentration on insulin-induced 3T3-L1 adipose cell differentiation. Obes Res. 1998; 6(2): 157-163. doi: 10.1002/j.1550-8528.1998.tb00330.x

25. Palacios-Ortega S, Varela-Guruceaga M, Martínez JA, de Miguel C, Milagro FI. Effects of high glucose on caveolin-1 and insulin signaling in 3T3-L1 adipocytes. Adipocytes. 2016; 5(1): 65-80. doi: 10.1080/21623945.2015.1122856

26. Lin Y, Berg AH, Iyengar P, et al. The hyperglycemia-induced inflammatory response in adipocytes: The role of reactive oxygen species. J Biol Chem. 2005; 280: 4617-4626. doi: 10.1074/jbc.M411863200

27. Riley CL, Bout D, Bean C, et al. UCP1 is essential for mitochondrial structural integrity and function in brown adipose tissue. FASEB J. 2017; 31(1).

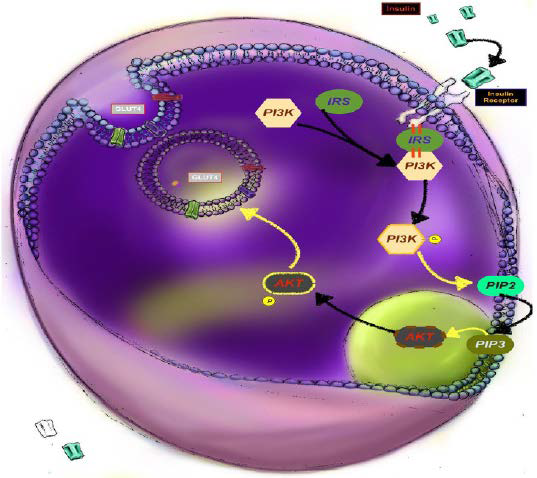
28. Rocchi S, Tartare-Deckert S, Mothe I, van Obberghen  E.Identification by mutation of the tyrosine residues in the insulin receptor substrate-1 affecting association with the tyrosine phosphatase 2C and phosphatidylinositol 3-kinase. Endocrinol. 1995; 136: 5291-5297. doi: 10.1210/endo.136.12.7588273

29. Bouzakri K, Roques M, Gual P, et al. Reduced activation of phosphatidylinositol-3 kinase and increased serine 636 phosphorylation of insulin receptor substrate-1 in primary culture of skeletal muscle cells from patients with type 2 diabetes. Diabetes. 2003; 52: 1319-1325. doi: 10.2337/diabetes.52.6.1319

30. Reaven GM, Hollenbeck C, Jeng CY, Wu MS, Chen YD. Measurement of plasma glucose, free fatty acid, lactate, and insulin for 24 h in patients with NIDDM. Diabetes. 1988; 37(8): 1020-1024. doi: 10.2337/diabetes.37.8.1020

31. Spalding KL, Bhardwaj RD, Buchholz BA, Druid H, Frisen J. Retrospective birth dating of cells in humans. Cell. 2005; 122: 133-
143. doi: 10.1016/j.cell.2005.04.028

32. Spalding KL, Arner E, Westermark PO, et al. Dynamics of fat cell turnover in humans. Nature. 2008; 453: 783-787. doi: 10.1038/nature06902

33. Olokoba AB, Obateru OA, Olokoba LB. Type 2 Diabetes mellitus: A review of current trends. Oman Med J. 2012; 27(4): 269-273. doi: 10.5001/omj.2012.68

34. Yin X, Lanza IR, Swain JM, Sarr MG, Nair SK, Jensen MD. Adipocyte mitochondrial function is reduced in human obesity independent of fat cell size. J Clin Endocrin Metab. 2014; 99: E209-E216. doi: 10.1210/jc.2013-3042

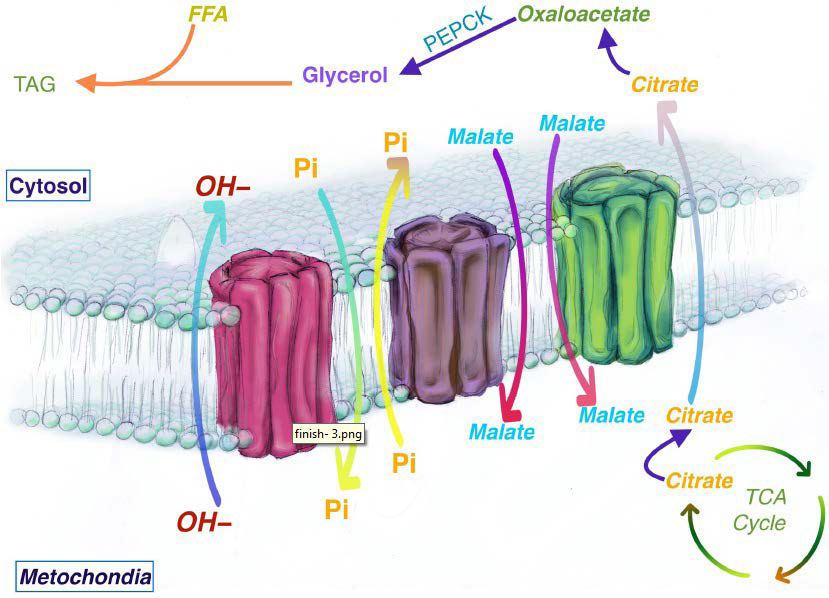
35. Hanson RW, Reshef L. Regulation of phosphoenolpyruvate carboxykinase (GTP) gene expression. Ann Rev Biochem. 1997; 66: 581-611. doi: 10.1146/annurev.biochem.66.1.581

36. Franckhauser S, Muñoz S, Pujol A, et al. Increased fatty acid re-esterification by PEPCK overexpression in adipose tissue leads to obesity without insulin resistance. Diabetes. 2002; 51(3): 624-630. doi: 10.2337/diabetes.51.3.624

37. Hakimi P, Johnson MT, Yang J, et al. Phosphoenolpyruvate carboxykinase and the critical role of cataplerosis in the control of hepatic metabolism. Nutr Metab (Lond). 2005; 2: 33. doi: 10.1186/1743-7075-2-33

38. Brun T, Scarcia P, Li N, et al. Changes in mitochondrial carriers exhibit stress-specific signatures in INS-1Eβ-Cells exposed to glucose versus fatty acids. PLoS One. 2013; 8(12): e82364. doi: 10.1371/journal.pone.0082364

39. Das K, Lewis RY, Combatsiaris TP, et al. Predominant expression of the mitochondrial dicarboxylate carrier in white adipose tissue. Biochem J. 1999; 344(2): 313-320.

40. Arner P. The adipocyte in insulin resistance: Key molecules and the impact of the thiazolidinediones. Trends Endocrinol Metab. 2003; 14(3): 137-145. doi: 10.1016/S1043-2760(03)00024-9

41. Kim JI, Huh JY, Sohna JH, et al. Lipid-overloaded enlarged adipocytes provoke insulin resistance independent of inflammation. Mol Cell Biol. 2015; 35(10): 1686-1699. doi: 10.1128/MCB.01321-14

42. Delarue J, Magnan C. Free fatty acids and insulin resistance. Curr Opin Clin Nutr Metab Care. 2007; 10(2): 142-148. doi: 10.1097/MCO.0b013e328042ba90

43. Paz K, Hemi R, LeRoith R, et al. Phosphorylation of insulin receptor substrate-1 (IRS-1) by protein kinase b positively regulates irs-1 function. J Biol Chem. 1997; 272: 29911-29918. doi: 10.1074/jbc.272.47.29911

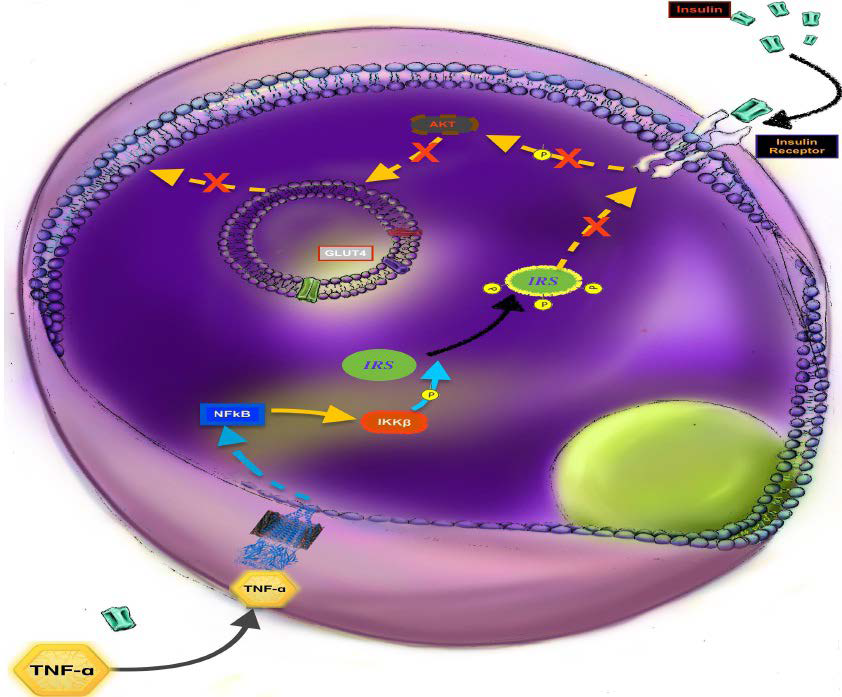
44. Liu YF, Paz K, Herschkovitz A, et al. Protein kinase c θ inhibits insulin signaling by phosphorylating irs1 at Ser1101. J Biol Chem. 2001; 276: 14459-14465. doi: 10.1074/jbc.C400186200

45. Ohmura E, Hosaka D, Yazawa M, et al. Association of free fatty acids (FFA) and tumor necrosis factor-alpha (TNF-alpha) and insulin-resistant metabolic disorder. Horm Metab Res. 2007; 39(3):
212-217. doi: 10.1055/s-2007-970421

46. Mlinar B, Marc J, Pfeifer M. Molecular mechanisms of insulin resistance, obesity and metabolic syndrome. Bio chemia Medica. 2006; 16(1): 8-24. doi: 10.11613/BM.2006.003

47. Le Roith D, Zick Y. Recent advances in our understanding of insulin action and insulin resistance. Diabetes Care. 2001; 24(3): 588-597. doi: 10.2337/diacare.24.3.588

48. Choe SS, Huh JY, Hwang IJ, Kim JI, Kim JB. Adipose tissue remodeling: its role in energy metabolism and metabolic disorders. Front Endocrinol (Lausanne). 2016; 7: 30. doi: 10.3389/fendo.2016.00030

49. Rutkowski JM, Stern JH, Scherer PE. The cell biology of fat expansion. J Cell Biol. 2015; 208(5): 501-512. doi: 10.1083/jcb.201409063

50. Park S-H, Liu Z, Sui Y, et al. IKKb is essential for adipocyte survival and adaptive adipose remodeling in obesity. Diabetes. 2016; 65: 1616-1629. doi: 10.2337/db15-1156

51. Ye J. Emerging role of adipose tissue hypoxia in obesity and insulin resistance. Int J Obes (Lond). 2009; 33(1): 54-66. doi: 10.1038/
ijo.2008.229

52. Jiang C, Qu A, Matsubara T, et al. Disruption of hypoxia-inducible factor 1 in Adipocytes improves insulin sensitivity and decreases adiposity in high-fat diet–fed mice. Diabetes. 2011; 60(10): 2484-2495. doi: 10.2337/db11-0174

53. Martinez-Santibañez G, Lumeng CN-K. Macrophages and the regulation of adipose tissue remodeling. Annu Rev Nutr. 2014; 34(1): 57-76. doi: 10.1146/annurev-nutr-071812-161113

54. Guzik TJ, Skiba DS, Touyz RM, Harrison DG. The role of infiltrating immune cells in dysfunctional adipose tissue. Cardiovasc Res. 2017; 113(9): 1009-1023. doi: 10.1093/cvr/cvx108

55. Kang YE, Kim JM, Joung KH, et al. The roles of adipokines, pro-inflammatory cytokines, and adipose tissue macrophages in obesity-associated insulin resistance in modest obesity and early metabolic dysfunction. PLoS One. 2016; 11(4): e0154003. doi: 10.1371/journal.pone.0154003

56. Ibrahim MM. Subcutaneous and visceral adipose tissue: structural and functional differences. Obes Rev. 2010; 11(1): 11-18. doi: 10.1111/j.1467-789X.2009.00623.x

57. Hamdy O, Porramatikul S, Al-Ozairi E. Metabolic obesity: The paradox between visceral and subcutaneous fat. Curr Diabetes Rev. 2006; 2(4): 367-373. doi: 10.2174/1573399810602040367

58. Lafontan M. Differences between subcutaneous and visceral adipose tissues. [In:] Bastard JP, Fève B (eds). Physiology and Physiopathology of Adipose Tissue. New York City, USA: Springer. 2013. 329-349. doi: 10.1007/978-2-8178-0343-2_23

59. Andersson DP. Changes in subcutaneous fat cell volume and insulin sensitivity after weight loss. Diabietes Care. 2014; 37(7): 1831-1836. doi: 10.2337/dc13-2395

60. Preis SR, Massaro JM, Robins SJ, et al. Abdominal subcutaneous and visceral adipose tissue and insulin resistance in the Framingham heart study. Obesity (Silver Spring). 2010; 18(11): 2191-2198. doi: 10.1038/oby.2010.59

61. Fang L, Guo F, Zhou L, Stahl R, Grams J. The cell size and distribution of adipocytes from subcutaneous and visceral fat is associated with type 2 diabetes mellitus in humans. Adipocyte. 2015;
4(4): 273-279. doi: 10.1080/21623945.2015.1034920

62. Jocken JW, Blaak EE. Catecholamine-induced lipolysis in adipose tissue and skeletal muscle in obesity. Physiol Behav. 2008; 94(2): 219-230. doi: 10.1016/j.physbeh.2008.01.002

63. Thompson D, Karpe F, Lafontan M, Frayn K. Physical activity and exercise in the regulation of human adipose tissue physiology. Physiol Rev. 2012; 92(1): 157-191. doi: 10.1152/physrev.00012.2011

64. Gerhard GS, Styer AM, Strodel WE, et al. Gene expression profiling in subcutaneous, visceral, and epigastric adipose tissues of patients with extreme obesity. Int J Obes (Lond). 2014; 38(3): 371-378. doi: 10.1038/ijo.2013.152

65. Ruge T, Sukonina V, Myrnas T, et al. Lipoprotein lipase activity/mass ratio is higher in omental than in subcutaneous adipose tissue. Eur J Clin Invest. 2006; 36: 16-21. doi: 10.1111/j.1365-2362.2006.01584.x

66. Fried SK, Russell CD, Grauso NL, Brolin RE. Lipoprotein lipase regulation by insulin and glucocorticoid in subcutaneous and omental adipose tissues of obese women and men. J Clin Invest. 1993; 92: 2191-2198. doi: 10.1172/JCI116821

67. Semenkovich CF, Wims M, Noe L, Etienne J, Chan L.  Insulin regulation of lipoprotein lipase activity in 3T3-L1 adipocytes is mediated at posttranscriptional and posttranslational levels. J Biol Chem. 1989; 264: 9030-9038. doi: 10.1016/S0021-9258(18)81898-1

68. Faraj M, Sniderman AD, Cianflone K. ASP enhances in situ lipoprotein lipase activity by increasing fatty acid trapping in adipocytes. J Lipid Res. 2004; 45: 657-666. doi: 10.1194/jlr.M300299-
JLR200

69. Mashek DG. Hepatic fatty acid trafficking: Multiple forks in  the road. Adv Nutr. 2013; 4: 697-710. doi: 10.3945/an.113.004648

70. Kotronen A, Juurinen L, Tiikkainen M, Vehkavaara S, YkiJärvinen H. Increased liver fat, impaired insulin clearance, and hepatic and adipose tissue insulin resistance in type 2 diabetes. Gastroeinterology. 2008; 135(1): 122-130. doi: 10.1053/j.gastro.2008.03.021

71. Badin P-M, Langin D, Moro C. Dynamics of skeletal muscle lipid pools. Trends Endocrinol Metab. 2013; 24(12): 589-644. doi: 10.1016/j.tem.2013.08.001

72. Shaw CS, Clark J, Wagenmakers AJ. The effect of exercise  and nutrition on intramuscular fat metabolism and insulin sensitivity. Ann Rev Nut. 2010; 30(1): 13-34. doi: 10.1146/annurev. nutr.012809.104817

73. Dagenais GR, Tancredi RG, Zierler KL. Free fatty acid oxidation by forearm muscle at rest, and evidence for an intramuscular lipid pool in the human forearm. J Clin Invest. 1976; 58: 421-431. doi: 10.1172/JCI108486

74. Guo Z, Burguera B, Jensen MD. Kinetics of intramuscular triglyceride fatty acids in exercising humans. J Appl Physiol (1985). 2000; 89: 2057-2064. doi: 10.1152/jappl.2000.89.5.2057

75. Schenk S, Horowitz JF. Acute exercise increases triglyceride synthesis in skeletal muscle and prevents fatty acid-induced insulin resistance. J Clin Invest. 2007; 117(6): 1690-1698. doi: 10.1172/JCI30566

76. Goodpaster BH, He J, Watkins S, Kelley DE. Skeletal muscle lipid content and insulin resistance: Evidence for a paradox in endurance-trained athletes. J Clin Endocrinol Metab. 2001; 86(12): 5755-5761. doi: 10.1210/jcem.86.12.8075

77. Li Y, Xu S, Zhang X, Zongchun Y, Cichello S. Skeletal intramyocellular lipid metabolism and insulin resistance. Biophys Rep. 2015; 1: 90-98. doi: 10.1007/s41048-015-0013-0

78. Hansen ME, Tippett TS. Insulin increases ceramide synthesis in skeletal muscle. J Diabetes Res. 2014; 2014: 765784. doi: 10.1155/2014/765784

LATEST ARTICLES

Use of Black Soldier Fly (Hermetia illucens) Prepupae Reared on Organic Waste

review

2024 Mar

Isayas A. Kebede*, Haben F. Gebremeskel and Gelan D. Dahesa,
Figure 11. Risk Map for the Introduction of Ruminant Diseases at Borders

Original Research, peer reviewed

2024 Mar

Yassir Lezaar*, Mehdi Boumalik, Youssef Lhor, Moha El-Ayachi, Abelilah Araba and Mohammed Bouslikhane

Commentary, End-of-Life, Family Dynamics, palliative Care, peer reviewed

2024 Mar

Neil A. Nijhawan*, Rasha Mustafa and Aqeela Sheikh

Retrospective Study

2024 Mar

Shrenik J. Shah*, Abhishek Jha, Chirag Davara, Rushi Mistry and Kapil Kachhadiya

Attention, Disaster, Mindfulness, Original Research, peer reviewed

2024 Mar

Christina Hagen*, Lars Lien, Edvard Hauff and Trond Heir

review

2024 Mar

Isayas A. Kebede* and Gelan D. Dahesa

review

2024 Feb

Bekiyad S. Daro*; Yared A. Deneke, Jiregna G. Negasa and Ishetu N. Dibaba