INTRODUCTION
Diabetes mellitus (DM) is becoming a health burden worldwide due to an increase in obesity and sedentary lifestyles.1,2,3 DM is associated with increased morbidity and mortality. DM is considered as a metabolic disorder and a risk factor for metabolic syndrome. A study from Nebeck et al4 suggested that the components of metabolic syndrome are associated with increased white blood cells (WBC) in the African population. Type 2 diabetes (T2D) and insulin-resistance are considered as chronic low-grade inflammation. Correlation between WBC, a non-specific inflammatory marker, and diabetic risk in different populations is controversial.5-8 Elevated white blood cell count has been documented with increased risk of glucose metabolic disturbance in middleaged and elderly Chinese people.9
Glycated hemoglobin A1c (HbA1c) reflects average plasma glucose over the previous eight to twelve weeks and used as an object to evaluate glycemic control.10 Long-term hyperglycemia, characterized by an enhanced level of HbA1c, causes the changes in neutrophil metabolism, activation and circulation in blood steam11 Gustavsson et al12 noted a significant association between HbA1c and WBC count, but that study was conducted in patients with stable coronary artery disease undergoing percutaneous transluminal coronary angioplasty (PTCA). However, the correlation between WBC and HbA1c in T2D is poorly understood. Although, various inflammatory marker has been investigated in different groups of T2D, it is quite difficult to characterize the low-grade systemic inflammation-based on the single inflammatory marker. Taking all these into consideration, we aimed to explore the association of WBC with HbA1c and other risk factors for diabetes.
MATERIALS AND METHODS
Study Design and Sampling
This study was carried out among T2D patients of Bangladesh to investigate the different pathological status of patients suffering from T2DM. This study was conducted in the medicine department of Women’s Medical College and Hospital, Sylhet, Bangladesh. A simple random sampling technique was used for the selection of study participants. The number of participants was 142. Among the participants, 71 (male 47, female 24) were diagnosed as T2D and the other was non-diabetes (male 32 and female 39). The study protocol was approved by Noakhali Science and Technology University, Bangladesh.
Patients Consent and Collection of Demographic Data
All the patients enrolled were informed verbally about the study and written consent was taken from each patient. To collect patient’s demographic data a face-to-face interview was conducted by the field researchers. During the interview in person, the interviewers translated the questionnaire from English to Bengali to make the questions easily understandable to the respondents. Interviewers have clarified any doubts that participants had and explained the symptoms and medical term in their familiar names and terms. The interview lasted 45-60-minutes and included a range of questions about age,gender, occupation, education, and living status of participants.
Pathological Test
Patients have prescribed required tests like Total WBC, Hemoglobin, and HbA1c. All of the tests were performed according to the procedure adopted in the hospital for routine uses.
Statistical Analysis
The experimented datawere calculated by using SPSS version 26 and represented as Mean±SEM (Standard Error of the Mean). Significance level of data was tested by Unpaired “t” tests where the differences between groups were considered significant at p<0.05, 0.01 and 0.001.
RESULTS
Demographic Data
Total cohort included 142 patients visiting the hospital, out of which 71 patients were diabetes and other 71 patients were non-diabetes. Patients of both groups having the co-morbidity of cardiovascular disease. Other demographic characteristics of the study population have been presented in Table 1. During this study, no significant differences were recorded for the age and gender of the participants while some other parameters showed their significance at some points, but those were not that kind of data that can affect the study findings.
| Table 1. Demographic Data Presentations of Diabetic and Non-Diabetic Study Subjects |
|
Variable
|
Diabetic Patient (n=71) |
Nondiabetic Patient (n=71) |
p value
|
| Mean age |
50.81±2.13
|
51.06±1.79 |
0.062NS
|
| Gender(male/female) |
47/24 (±11.5)
|
32/39 (±3.5) |
0.500 NS
|
| Occupation (percentage) |
| Business |
30 (42.25)
|
26 (36.62) |
0.045*
|
| Housewife |
24 (33.80)
|
27 (38.03) |
0.037*
|
| Service holder |
10 (14.09)
|
13 (18.31) |
0.083 NS
|
| Others |
7 (9.86)
|
5 (7.04) |
0.105 NS
|
| Living Place (percentage) |
| Urban |
34 (47.89)
|
30 (42.25) |
0.052 NS
|
| Rural |
37 (52.11)
|
41 (57.75) |
0.033*
|
| Values of age and gender are expressed by Mean±SEM while all other data are expressed in percentage; p<0.05 considered for *; NS stands for not significant at p-value>0.05. |
Mean (%) Hemoglobin (Hb) Content
Mean (%) hemoglobin content was estimated in both of the groups. There was no significant variation in %Hb between the groups. Average values (diabetes vs non-diabetes) for male were 12.61% vs 12.11 % and for female was 11.65% vs 10.10% respectively. The data for patients with DM was found statistically significant while compared to NDM group (Figure 1).
Figure 1. Mean % Hb Level of Diabetic and Non-diabetic Patient
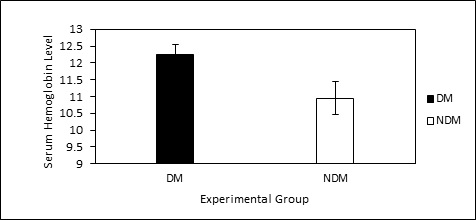
Here, DM stands for diabetic mellitus and NDM stands for non-diabetic mellitus subjects. All the values are expressed by Mean±S.E.M.
Mean (%) Glycated Hemoglobin (HbA1c)
Irrespective of the gender, statistically significant (p<0.05) variation was observed in mean % HbA1c values. Mean % HbA1c values (8.45±0.19%) were higher in diabetic patients compared to that of non-diabetic patients (6.25±0.24%) (Figure 2).
Figure 2. Comparison of % HbA1c Level of Diabetic and Nondiabetic Patients
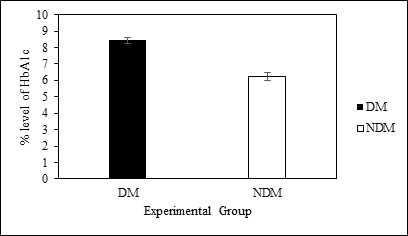
Here, DM stands for diabetic mellitus and NDM stands for non-diabetic mellitus subjects. All the values are expressed by Mean±S.E.M.
Mean White Blood Cell Counts
Diabetic patients suffering from cardiovascular disease have statistically significant (p<0.01) higher WBC than non-diabetic patients with cardiovascular disease (Table 2).
| Table 2. Blood Cell Count Comparison between Diabetic and Non-Diabetic Study Group |
|
Blood Cell Count
|
Diabetic Mellitus Group |
Non-Diabetic Mellitus Group
|
| White blood cell |
13172.36±1.5**
|
12876.32±0.3
|
| All the values are expressed by Mean±SEM. p<0.01 considered for ** |
DISCUSSION
Different biochemical parameters have studied to address their status in diabetic patients. Diabetes is considered a low-grade inflammation. In this study, we attempted to assess the relationship between the white blood cell counts, a non-specific marker for inflammation, with glycated hemoglobin. Supporting the notion of the inflammatory condition in diabetes, we found elevated WBC in diabetes compared with non-diabetes. Elevated WBC considered as the distressing insulin sensitivity and as a predictor for the development of T2D.13
During our current study, in even non-diabetic patients, an elevated WBC than normal range was observed, which could be due to co-morbidity of CVS in non-diabetic patients. This is common with previous studies in White,9 Pima,13 Asian,14 and Japanese.15 In a study on the African population,4 WBC counts were found to be widespread with increasing numbers of components of metabolic syndrome in each woman and male, although statistical significance was no longer achieved. These consequences suggest that expanded WBC count number is an independent danger thing for IGR and T2DM. Although the mechanism underlying this upper rate of the WBC counts in T2DM sufferers remains unclear, insulin resistance is probably partly responsible.13,16 Defects in insulin action on the tissues such as., adipose tissue, muscle, and liver, resulting in a continual, low-grade inflammatory condition. The secretion of proinflammatory cytokines that promote the differentiation and maturation of leukocytes can be triggered by both intra-arterial and extravascular infections. Irrespective of the triggering retailers and the initial events, the connection is bidirectional: any system linked to chronic inflammation will reduce insulin action, and insulin resistance will promote irritation in the vicious cycle.17
HbA1c is generally used for the assessment of long-term blood glucose control of the diabetic patient. It formed by irreversible, non-enzymatic glycation of the hemoglobin, the rate of which is directly proportional to the ambient glucose concentration.16 It has been shown in a population-based study that both low and high HbA1c values are associated with T2DM. In adults diagnosed with diabetes, the odds of all-motive mortality associated with excessive HbA1c levels increased by 60% and the odds of all-motive mortality associated with low HbA1c levels increased by 40%.18 One study shows that more than two-thirds of the study population had low-levels of stable HbA1c, and one-fifth had stable levels of HbA1c, but moderately high-levels. Compared to those with a higher-level of HbA1c, participants with low stable HbA1c had a significantly shorter diabetes duration,19,20 the level of glycemic control may well be adequate for these patients, and does not appear to confer additional risk for adverse outcomes.
During this study, irrespective of the gender, statistically significant (p<0.01) variation was observed in mean % HbA1c values. Mean % HbA1c values were higher in diabetic patients compared to that of non-diabetic patients. The diabetic male is likely to have a higher Hb level than diabetic female. The non-diabetic male also tends to have high Hb level than nondiabetic female, and it was remarkable than that in case of a diabetic group. Some studies found similar findings that mean % HbA1c values of diabetic subjects are greater than that of nondiabetic subjects. It indicates the average level of glycolate Hb is more in the diabetic patient.19,20 This phenomenon can be expressed, as blood sugar level increases in hyperglycemic patients, so increased glycogen become added to the hemoglobin’s, as a result, glycolate Hb level raises in diabetic patients.21 Some other studies also supported here by their reporting that higher-level of HbA1c in diabetic patients over time is associated with higher prevalence and incidence of chronic complications over the same time22,23 as well as a higher-risk of all-cause mortality.24,25
CONCLUSION
The study reveals that blood parameters (i.e. WBC, HbA1c, Hb) were found different between diabetic and non-diabetic subjects, where diabetic patients show an increased level of HbA1c, Hb, WBC. Although more precise biochemical and genetically studies are under a warrant to correlate the status of WBC, HbA1c and Hb.
LIMITATIONS OF THE STUDY
Although present attempt might bring some significant pathological background for diabetes patientsin Bangladeshi, it had several limitations. Compared with the previous trace elements studies on diabetes patients from different countries, the sample size of our study was small; therefore, to validate these results we propose a multicenter approach with large sample size. Meanwhile, the current study subjects were selected and researched from an only hospital in Bangladesh that was another limitation of this current project. Thus further investigation with patients from different hospitals of different cities of Bangladesh is recommended to confirm the study findings and data suitability. Finally, although the socio-economic status of cases and controls is comparable, however, the possibility of various genetic characteristics associated with diabetes should not be ignored.
RECOMMENDATIONS
Elevated WBC count is independently associated with worsening of glucose metabolism and HbA1c may ameliorate the chronic low-grade inflammation such as T2D.
ACKNOWLEDGEMENTS
The authors sincerely thank pharmacy discipline, Noakhali Science and Technology University, Bangladesh for providing adequate financial support, laboratory facilities and necessary reagents to carry out the research work. We also express gratefulness to the CCU and Medicine unit of Sylhet Women’s Medical College Hospital, Sylhet, Bangladesh for their cooperation during the collection of the blood sample.
AUTHOR CONTRIBUTION
MSH and SNA conceived and designed the experiments. SNA experimented. Analysis and data interpretation were aided by SNA, MSH, and SSH. SNA and MSH contributed reagents, materials, analysis tools and data. SNA and MSH wrote the paper. SSH and MSH critically reviews the manuscript. MSH made the necessary corrections in the write-up and gave final approval for the submission of the final version. All authors read and approved the final manuscript.
CONFLICTS OF INTEREST
The authors declare that they have no conflicts of interest.


