INTRODUCTION
In the last few years numerous studies have demonstrated the important part played by the tumor microenvironment in the regulation of cancer development and progression, both in vitro and in vivo.1,2,3,4 It was shown that the microenvironment has a crucial impact on the tumorgenic potential of cultured cancer cells.5,6 Kaplan et al. (2005) demonstrated that a distant tissue-specific milieu had the capacity to initiate tumor cell migration towards pre-metastatic sites, emphasizing the role of the microenvironment in cancer progression in vivo.
A variety of factors in the microenvironment have been proposed as causatives triggering cancer progression, such as Extracellular Matrix (ECM) signals/receptors,6,7 the mechanical properties of the immediate surroundings of the tumor,8 and calcium.2,9,10,11 Calcium also influences tumor cells via calcium dependent molecules.9,12,13
Many studies highlight the importance of calcium in regulating cancer development and progression.2,9,11,12 Although calcium signaling and triggering mechanisms have not been proven to be a prerequisite for cancer formation, they are associated, either directly or indirectly, with each of the known cancer hallmarks14,15 and cancer related features.2,4,11,12,16,17
Metastases are formed when tumor cells lose their cell-cell adhesion and are free to migrate to secondary tumor sites. Cell-cell adhesion is mediated by calcium dependent transmembrane adhesion molecules of the cadherin super family. Cadherins enable interactions between different cell types in a variety of organisms through homophilic binding.18,19 Cancer cell migration to secondary tumor sites is also regulated by cadherin alterations via Epithelial-Mesenchymal Transition (EMT).18,20 The cadherin intracellular region is attached to β-catenin, which acts in convergence with the cadherin adhesion mechanism and canonical Wnt signaling pathways.21,22Decrease in cadherin levels may promote tumorgenesis not only by causing immediate cancer cells looseness and therefore enhanced migration capacity, but also by serving as a positive regulator of Wnt signaling, leaving unbound cytoplasmic β-catenin free to reach the nucleus. When it reaches the nucleus β-catenin acts as a transcriptional co-activator of the TCF/LEF family of transcription factors, triggering the transcription of target genes, one of which is the c-Myc oncogene. c-Myc has many downstream target genes that regulate cancer cell proliferation and migration, as well as many other tumorgenic capacities.21,23,24,25,26 Wnt pathway constitutive activation is commonly observed in carcinomas, and recently upregulation of the Wnt/β-catenin cascade was demonstrated in sarcomas model and correlated with sarcoma aggressive growth and metastasis.27,28,29
Although the importance of cadherin-mediated cell adhesion and Wnt signaling for malignant processes has been extensively discussed;13,18 the role of calcium in the tumor microenvironment and its correlation with the relevant signaling pathways and with cancer progression are not yet fully understood.
Bone Marrow (BM) is a calcium microenvironment located in cancellous bone, the spongy, soft inner part of long bones. The inorganic phase of BM, which consists mainly of Ca5 (PO4 )3 (OH) (hydroxylapatite), is characterized by a large surface area and high porosity.30 It is highly vascularized and comprises many cell types, including fibroblasts, hematopoietic cells, adipocytes, osteoblasts, osteoclasts, and Mesenchymal Stem Cells (MSCs).30,31,32
For culturing cancer cells, as earlier studies have demonstrated, 3D models are to be preferred to the traditional monolayers.33 Their 3D architecture offers cancer cells the possibility of arraying themselves in structures that, mimicking the in vivo environment, promote native cell-cell communications, cell-matrix interactions, and ECM secretion.34
Bone marrow attracts homing tumor cells,1,35 providing them with a calcium rich shelter.36,37In light of the proven involvement of calcium in enhanced malignancy capacity, it seems likely that BM induces changes in the tumorigenicity of Cancer Cells (CCs). To test this hypothesis, it would be necessary to study tumor related processes in an adequate 3D model with a calcium rich milieu. Although current three-dimensional models offer good mimicry of certain in vivo tumor surroundings,8,38,39,40 to date no model providing optimal 3D mimicry of the calcium rich bone marrow microenvironment has been described.1,39
To circumvent this difficulty, we have developed a novel 3D model that mimics the BM microenvironment in regard to its chemical and physical properties as well as its ability to provide calcium in a direct and indirect manner. The biolattice chosen for the present research is a skeletal derivative of a marine invertebrate, the coral Porites lutea (POR),which is composed of CaCO3 in the crystalline form of aragonite. It has already been demonstrated that, owing to the significant similarity between this biolattice and the inorganic domain of bone, POR is a suitable microenvironment for culturing MSCs and inducing their osteogenic differentiation.41,42
METHODS
EXPERIMENTAL DESIGN, SCAFFOLD AND CELLS
Experimental design
Four different cell culture combinations were used in this study. Scaffolds consisting of aragonite from the skeleton of the coral Porites lutea (POR) were designated as the 3D group. To enable comparison of the surface characteristics of the bioactive scaffold with those of an inert matrix, a second group of POR scaffolds was coated with gold; this was designated 3Dg.
To provide a two-dimensional negative control group, cells were grown on a plastic surface designated 2D. Finally, cells were grown on a plastic surface in the presence of POR matrix, which was placed in an insert above the cell culture, to provide a two-dimensional positive control group; that group was designated 2D-CM (2D conditioned medium).
Scaffolds
Scaffolds from Porites lutea (POR) were cut into blocks and polished to a thickness of approximately 0.5 mm and an area of 0.5 cm2 using a grinder (model South Bay Technology 900-8). To remove organic residues, the samples were bleached with commercial hypochlorite solution, rinsed with distilled water, and dried in air. Scaffolds were autoclaved (121ºC, 30 min). To produce the gold-covered scaffolds, polished POR samples were placed in a Veeco VE, VP-776 evaporator and coated first with a 100 Å chromium layer, then with a 300 Å gold layer under a constant chamber pressure of 10-6 Torr at a rate of 3 Å/s. The 3Dg matrices were rinsed with 70% ethanol, then with distilled water, and autoclaved (121ºC, 30 min).
Cell culturing and seeding
Mus musculus (BALB/C) fibrosarcomas were seeded on plastic dishes or on POR scaffolds in Dulbecco Modified Eagle’s Medium (DMEM) supplemented with 4.5 g/L D-glucose, 1 mM sodium pyruvate, 10% (v/v) Fetal Bovine Serum (FBS), 1% L-Glutamine, and 1% Pen-StrepNeomycin solution (all from Biological Industries, Israel). Cell cultures were incubated in a humidified atmosphere of 5% CO2 at 37°C. The medium was replaced every 2-3 days.
Murine MSCs (ATCC/CRL 12424), were differentiated towards endothelial like cells using differentiation medium (modified DMEM with 2% FBS, 50 ng/mL Vascular Endothelial Growth Factor-A (VEGF), 25 ng/mL basicFibroblast Growth Factor (bFGF) [both from PeproTech, Israel], 10 units/mL Heparin sodium salt [Sigma, Israel] for four days. Differentiated cells were seeded on POR scaffolds and 2D control monolayers in order to demonstrate the lack of acquiring tumorigenic related features of nontumorigenic cells growing in the POR microenvironment.
MICROSCOPY
Light microscopy
Cell morphology and quantity were imaged using a light inverted phase-contrast microscope (Eclipse Ti, Nikon) fitted with a digital camera (D5-Qi1Mc, Nikon).
Scanning Electron Microscopy (SEM)
A stock solution of fixative was prepared from 2% paraformaldehyde in distilled water and 2.5% glutaraldehyde in 0.1M phosphate buffer. Samples were rinsed with Phosphate Buffered Saline (PBS) (Biological Industries, Israel) and immersed in the fixative at 37ºC for 30 min. After fixation, the samples were washed three times with PBS for 10 min, then soaked in serial gradients of 50%, 75%, 90% and 95% ethanol for 10 min each and three times in 100% analytical ethanol for 10 min each. The samples were then immersed in Hexamethyldisilazane (HMDS) (Bel-Gar, Israel) and ethanol solutions in three different volume ratios (1:2, 1:1 and 2:1). Samples were dried in a hood overnight. The morphology of the samples was examined with a SEM (JEOL, JSM-5610-LV).
HISTOCHEMICAL ANALYSIS – SAFRANIN O STAINING
On day 7 of the culture period, samples were examined for glycosaminoglycan content.
Safranin O stains proteoglycans and glycosaminoglycans, known components of cartilage/ECM tissue. A stock solution of 1% Safranin O/Fast Green FCF (Sigma; 0.5 g in 100 ml of isopropanol) was prepared. Samples were rinsed three times with PBS, fixed with 12% formaldehyde for 5 min and then stained with Safranin O/Fast Green FCF stock solution for 15 min. Serial ethanol gradients (50%, 75%, 90%, 95%, and twice 100%) were used to rinse the samples. The 2D samples were photographed with a light inverted phase-contrast microscope (Eclipse Ti, Nikon) fitted with a digital camera (D5-Qi1Mc, Nikon), while the 3D groups were photographed with a stereoscope (SMZ 1500, Nikon), fitted with a digital camera (DXM1200, Nikon).
CELL PROLIFERATION ANALYSIS
Quantification of cells in relation to various treatment procedures was performed using the XTT Cell Proliferation Kit (Biology Industries, Israel). The assay is based on the ability of metabolically active cells to reduce the tetrazolium salt XTT to orange colored compounds of formazan; the dye formed can then be read at 490 nm with a spectrophotometer. Prior to the test, a calibration curve was prepared from samples with various known cell numbers. The samples were incubated with XTT reagent for 4 hours, after which the intensity of the dye formed measured with a spectrophotometer (SynergyMx, BioTek, USA). Cell number was calculated according to the calibration curve.
MIGRATION ASSAY
It was demonstrated that MSCs attract cancer cells.43,44,45 This MSCs feature was used in a migration assay, where MSCs serve as inducer and attractant for cancer cell migration.
Mesenchymal stem cells (ATCC, CRL 12424) were seeded at the bottom of 12-well plates. Inserts (Greiner BioOne ThinCert, 8 μm pore size) were placed on top of the wells, forming a migration chamber. Cancer cells belonging to all four different cell culture groups (2D, 2D-CM, 3D, 3Dg) were seeded into the inserts: monolayers for the 2D and 2D-CM groups; scaffolds with seeded cells were placed in the inserts – for the 3D and 3Dg groups. Cells were allowed to migrate for 7 days, after which they were collected from the bottom zone of the inserts and counted. Parallel to the migration assay, the cell quantity in the inner part of the insert was determined for calculation of a number of migrated cells per 1000 cells present.
QUANTITATIVE GENES EXPRESSION MEASUREMENTS
RNA extraction
Total RNA was extracted from the cells using Trizol reagent (Invitrogen), according to the manufacturer’s instructions. Intact RNA integrity was tested on 1.7% agarose gel containing 0.0025% (v/v) ethidium bromide. The concentration and purity was determined at 230 and 260 nm (NanoDrop ND-1000, USA).
Complementary DNA
cDNA was synthesized from total RNA using random hexamers with High Capacity cDNA Reverse Transcription Kit (Applied Biosystems), according to the manufacturer’s instructions. The reactions were incubated in a thermal cycler for 10 min at 25ºC, 120 min at 37ºC, 5 min at 85ºC and then held at 4ºC.
qPCR
The sources of the gene-specific primers (Table 1) and their nucleotide sequences are summarized in Table 1 together with the quantity of cDNA used for each gene analysis (determined according to a standard curve at the accepted value after 25 cycles (Ct ~ 25)).
Table 1: Primers for quantitative real time polymerase chain reaction (qPCR) analysis of gene expression
|
Gene
|
Design
|
Accession number
|
Forward and reverse primers
|
| TBP |
Primer Express® software
(V3.0, Applied Biosystems, USA) |
NM_013684.3 |
F: 5′-CCCCTATCACTCCTGCCACAC-3′
R: 5′-AAGTAGACAGACTGAAGCTGCGGTA-3′
|
| c-Myc |
Primer-BLAST (NCBI) |
NM_010849.4 |
F: 5′-AAACCCCGCAGACAGCCACG-3′
R: 5′-TCGGCGGTGGAGAAGTTGCC-3′
|
|
SOX2
|
IDT validated primer |
NM_011443.3 |
F: 5′-GTACAACTCCATGACCAGCTC-3′
R: 5′-CTTGACCACAGAGCCCAT-3′
|
| S100A4 |
IDT validated primer |
NM_011311.2 |
F: 5′-AGCTTCATCTGTCCTTTTCCC-3′
R: 5′-TGTAATTGTGTCCACCTTCCAC-3′
|
| CCL2 |
IDT validated primer |
NM_011333.3 |
F: 5′-TGATCCTCTTGTAGCTCTCCA-3′
R: 5′-CATCCACGTGTTGGCTCA-3′
|
| CCL5 |
IDT validated primer |
NM_013653.3 |
F: 5′-CCTCTATCCTAGCTCATCTCCA-3′
R: 5′-CAAGTGCTCCAATCTTGCAG-3′
|
| E-cadherin |
Primer-BLAST (NCBI) |
NM_009864.2 |
F: 5′-ACCAGTTTCCTCGTCCGCGC-3′
R: 5′- TTCAGAGGCAGGGTCGCGGT-3′
|
| N-cadherin |
Primer-BLAST (NCBI) |
NM_009733.2 |
F: 5′-GACAAAGAAACCCAGGAAAAGTGGC-3′
R: 5′-CTCTCTTCTGCCTTTGTAGAGCTCC-3′
|
| AXIN1 |
Primer Express® software
(V3.0, Applied Biosystems, USA) |
NM_009733.2 |
F: 5′-GTCCAGTGATGCTGACACGCT-3′
R: 5′- GCCCATTGACTTGGATACTCT-3′
|
| WIF1 |
Primer Express® software
(V3.0, Applied Biosystems, USA) |
NM_011915.2 |
F: 5′-CTTTGCTGGCAACAGTGCCTC-3′
R: 5′-GGTCCTAAGGATGGTGTTGCC-3′
|
| Wnt4 |
Primer Express® software
(V3.0, Applied Biosystems, USA) |
NM_009523.2 |
F: 5′-GAAGGTGGTGACACAAGGGA-3′
R: 5′-CTGCAAAGGCCACACCTG-3′
|
| CD44 |
Primer Express® software
(V3.0, Applied Biosystems, USA) |
NM_001039151.1 |
F: 5′-CCTCAGCCCCTCCTGAAGA-3′
R: 5′-CGAGTACCATCACGGTTGCAC-3′
|
For each reaction 10 μL of mixture containing 5 μL SYBR® Green PCR Master Mix (Applied Biosystems, USA), 4 μL of cDNA, primers (Table 1) and complete amount of double distilled water (treated with diethyl pyrocarbonate (DEPC) was prepared. qPCR reactions were performed using an Applied Biosystems Step One Plus qPCR. The reactions were incubated in a 96-well plate at 95ºC for 20 min followed by 40 cycles of 3 secs at 95ºC and 30 sec at 60ºC and finally 15 min at 95ºC for the melt curve. ΔΔCT with TATA-box Binding Protein (TBP) as housekeeping gene was calculated.
All analyses were performed at least in triplicate, and three independent experiments were performed.
STATISTICAL ANALYSIS
Each series of experiments included at least three or more independent biological repeats and at least three technical replicates. The results were expressed as means ± standard error. Student t-test was performed and statistical significance was determined at a value of p<0.05 for each experiment.
RESULTS
PROLIFERATION RATE
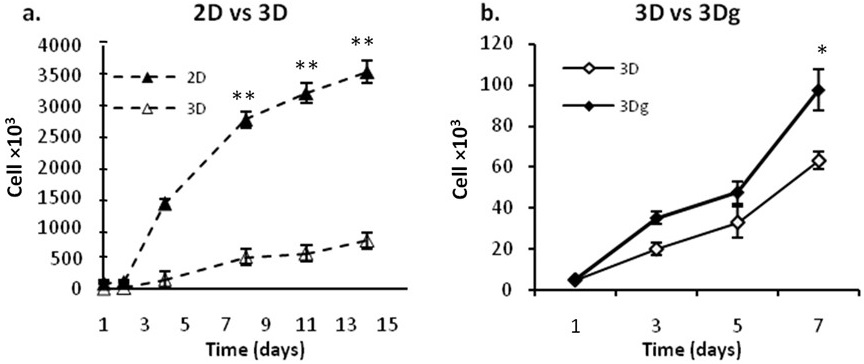
Cancer cells demonstrated a decreased proliferation rate on POR 3D scaffolds as compared with 2D scaffolds (Figure 1a). The influence of calcium on proliferation became evident when cell counts were compared for gold coated versus non-coated scaffolds – the presence of calcium caused a decrease in proliferation rate (Figure 1b). Despite the imperfect surface coverage of the 3Dg scaffolds during the gold coating process, the calcium induced decline in cell count was more pronounced in the case of the 3D platforms.
Figure 1: Fibrosarcomas proliferation rate a: 3D scaffolds vs. 2D control group. b: 3Dg vs. 3D group.Asterisks denote significant differences between treatments at the same time point; *P<0.05, **P<0.01
MIGRATION
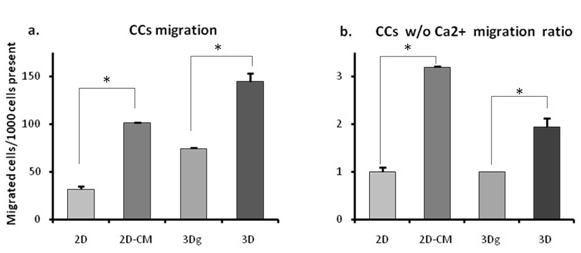
Since proliferation rate – one of the key features of cancerous cell cultures – was clearly affected by the POR microenvironment, we decided to check whether the latter also influenced the ability of the cancer cells to migrate. In light of our group’s earlier studies in which MSCs demonstrated spontaneous differentiation towards an osteoblastic fate when cultivated on the POR biolattice,41 we speculated that restrained proliferation could point to differentiation and hence restricted movement and tumorgenic functioning. However, this notion was dispelled by our further results: on both 2D surfaces and 3D POR scaffolds, cells grown in the presence of calcium displayed enhanced migration abilities (Figure 2a). Compared with the 2D control group, taken as base line, migration ability on the 2D surfaces supplemented with POR conditioned medium (2D-CM) was 3.2 times higher (Figure 2b). Among the 3D groups the differential was smaller – cell migration numbers recorded in non-coated matrices were only 1.95 times higher (Figure 2b), possibly because of incomplete sealing of the plated matrix (the thin layer of gold only coated the outer surface of the scaffolds, leaving exposed surfaces of CaCO3 inside the pores).
Figure 2: Fibrosarcomas (CCs) migration: a: Migrated cells/1000 cells present b: Migration ratio between groups with/without calcium. Asterisks denote significant differences between treatments; *P<0.05, **P ><0.01
CELL DISTRIBUTION AND TISSUE DEVELOPMENT ON POR
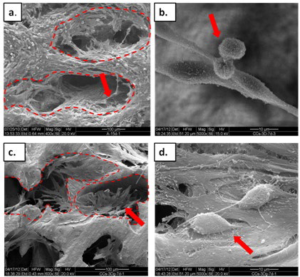
Fibrosarcoma cells were seeded on the biomatrices, coated and non-coated. The cells adhered and proliferated. After seven days of culturing cancer cells had covered the inside of the matrix pores, and after 15 days they had formed tissue-like structures inside the pores and covered other matrix areas as well (Figure 3). On the 3D biomatrices the cells looked more dense and volumetric than on 2D-CM (see Section ECM secretion). Many cell-cell and cell-scaffold interactions were detected.
On the gold coated scaffolds the cells adhered mostly to the inner surfaces of the pores (Figure 3a), which were only partially coated and thus presented exposed calcium, indicating cell preference for calcium providing sites.
Figure 3: SEM of fibrosarcomas on the POR scaffolds: a-b: 3D POR, ×400 and ×5000, respectively c-d: gold coated-3Dg POR, ×600 and ×5000, respectively. The dashed lines indicate the pore edges of the scaffolds and arrows point to cell aggregates/cells.
ECM SECRETION
Cells grown on POR matrices built an interconnected network, but also streamed down to the plate surface. In the 2D cultures near the scaffolds an altered morphology was demonstrated in areas adjoining the pieces of POR scaffold – cell aggregates could be distinguished (Figure 4). The cells in these aggregates seemed to be tightly packed and were volumetrically shaped, recalling SEM images of the POR cultures. Their appearance suggests that calcium from the matrices had affected the secretion of ECM in these cells. Safranin-O staining confirmed the presence of glycoaminoglycans (GAGs), testifying to elevated secretion by the aggregated cells in the vicinity of the POR pieces (Figure 4b).
Figure 4: Safranin-O/Fast Green staining of fibrosarcomas (a-b: light microscopy, c-d: binocular) a: 2D control. b: cell aggregates near POR scaffold, on plate surface. c: 3D POR, cells adhered to all scaffold surface d: 3Dg POR, cells adhere only to surface with exposed calcium
areas mainly found on the inner sides of the scaffold.
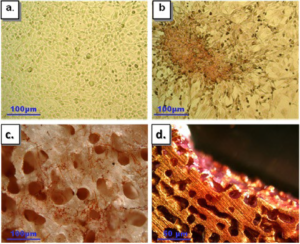
Fibrosarcoma cells on the POR scaffold demonstrated ECM secretion as well: cells were seeded on both gold coated and non-coated scaffolds, and after 7 days of culturing they were treated with Safranin O/Fast Green (Figure 4c-d). Cells on non-coated matrices were stained red, indicating ECM secretion (Figure 4c), while on gold coated matrices cells demonstrated Safranin O red staining mainly in the goldfree areas, where the CaCO3 crystals of the native POR scaffold were exposed (Figure 4d). Formed tissues are more easily distinguished along the edges of the scaffold, along with clear evidence of ECM secretion (data not shown).
TUMORIGENIC-RELATED GENES mRNA LEVELS
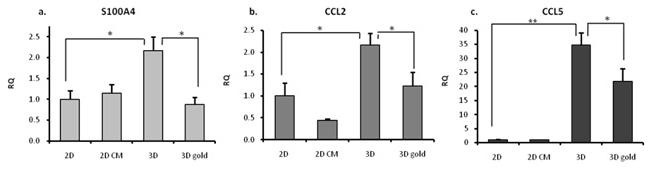
In order to shed light on the changes that occurred in the tumorgenic capacities of the fibrosarcomas cultured on our model, we evaluated the expression of several tumorgenic and metastasis related markers, namely CCL2 and CCL5, which are related to tumor progression and metastasis,46,47,48,49 and S100A4,12,13 a calcium dependent protein product associated with enhanced migration capacity and tumor aggressiveness12,13,50 (Figure 5). For all three markers the highest expression levels were recorded in the 3D group. In the case of CCL5, expression levels detected in the 3D and 3Dg groups were respectively 35 and 22 times higher than in the 2D control (Figure 5c).
Figure 5: qPCR – tumorgenic-related genes mRNA expression levels (RQ was calculated in relation to 2D control): a. S100A4 b. CCL2 c. CCL5. Asterisks denote significant differences between treatments; *P<0.05 **P ><0.01
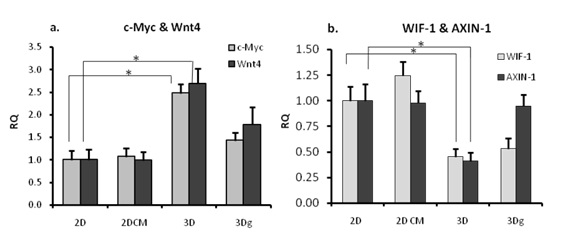
Since the Wnt pathway is known to play an important role in decision-making processes in cancer cells, we examined the expression levels of key molecules involved in this pathway. As shown in Figure 6a, elevated expression of Wnt4, one of the Frizzled ligands, was recorded in the 3Dg and especially in the 3D group, and c-Myc oncogene, a Wnt pathway target gene (Figure 6a). Expression of Wnt pathway inhibitors WIF1 and AXIN1 – the latter is a core protein in the GSK3β-β-cateninAPC destruction complex which prevents β-catenin from traveling to the nucleus by binding it to the complex – was inversely correlated to c-Myc expression in the 3D group only (Figure 6b).
Figure 6: qPCR- Wnt pathway genes mRNA expression levels. RQ was calculated in relation to 2D control: a. Wnt4, c-Myc b. AXIN-1, WIF-1. Asterisks denote significant differences between treatments; *P<0.05
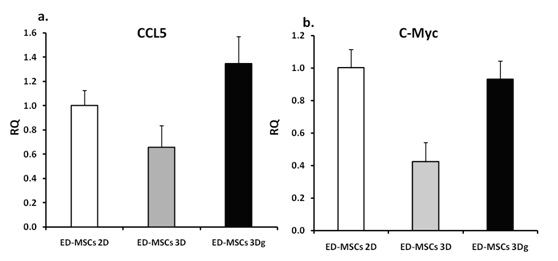
Non-tumorigenic mesenchymal stem cells differentiated towards an endothelial fate, were cultured on POR scaffold and mRNA levels of CCL5 and c-Myc were determined. Results (Figure 7) showed that these cells did not demonstrate up-regulation of the tumorigenic-related genes.
Figure 7: qPCR – endothelial differentiated cells (MSCs origin) mRNA expression levels ofa. CCL5 and b. c-Myc. Cells were cultured on 2D control, 3D and 3Dg POR and show no significant differences between the tested groups
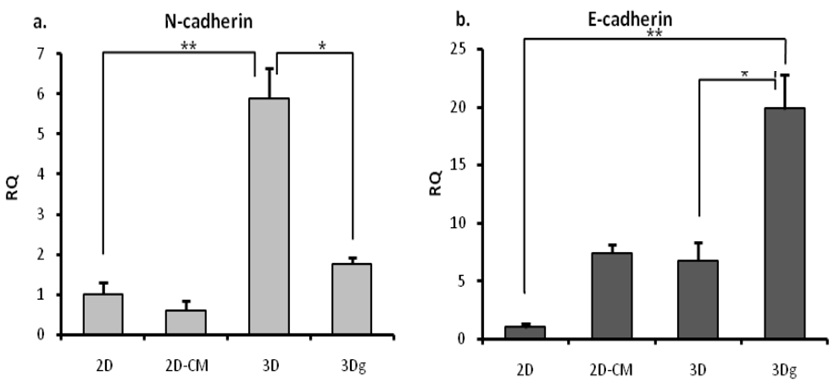
Cells in the control (2D) and experimental groups (2DCM, 3D, 3Dg) demonstrated an altered cell arrangement and distinct adhesion patterns, implying diversity in the level of expression of the adhesion molecules. E-cadherin and N-cadherin levels were checked and found to be inversely related: high Ncadherin levels were accompanied by low E cadherins level in the 3D group, and vice versa in the 3Dg group (Figure 8); Ncadherin levels in the latter group were three times lower than in the 3D group (Figure 8a).
Figure 8: qPCR – E/N cadherin mRNA expression levels: RQ was calculated in relation to 2D control: a. N-cadherin b. E-cadherin. Asterisks denote significant differences between treatments; *P<0.05, **P ><0.01
FIBROSARCOMA CELLS STEMNESS-RELATED GENES mRNA
LEVELS
Since differentiation may be a causative factor in decreased proliferation and malignancy,51 and inspired by our previous work with MSCs on POR scaffolds – where MSCs demonstrated spontaneous differentiation towards osteoblasts in the absence of added growth factors41,52 – we explored this possibility with reference to our cells. However, the fibrosarcomas did not exhibit over-expression of osteogenic-related markers such as RunX and collagen type I (data not shown).
Decreased proliferation may also result from the converse of differentiation, namely stem cell-like state and associated proliferation quiescence. Restrained proliferation rate, increased migration capacity, over-expression of tumor-related markers – taken together these appear to suggest evolution of the cancer cells in the direction of greater stemness.
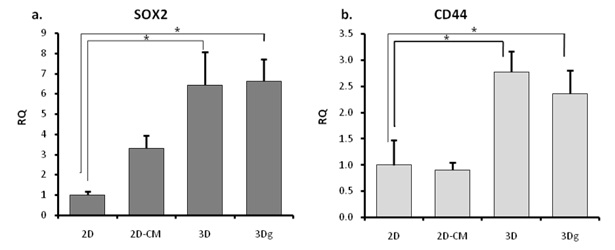
Two markers related to cancer cell stemness were tested: SOX253,54,55 and CD44, which is also associated with tumor aggressiveness.56,57,58,59 Expression of both these genes was found to be up-regulated in the 3D and 3Dg groups (Figure 9).
Figure 9: qPCR – cancer stem cells related genes expression: RQ was calculated in relation to 2D control: a. SOX2 b. CD44. Asterisks denote significant differences between treatments; *P<0.05, **P ><0.01, **P <0.01
DISCUSSION
Using the bone marrow-like calcium providing POR biolattice as a model, we were able to demonstrate that the microenvironment is capable of modifying the tumorigenic capacity of fibrosarcoma cells, and more particularly that it can affect key features – their proliferation rate. Cells grown on the 3D scaffolds proliferated at rates that were five times slower (Figure 1) than those in the 2D group. Supporting earlier findings regarding cancer cell tumorigenicity in bone marrow,36,60 cells cultured on the calcium rich POR biolattice showed elevated tumorigenic capacity, in keeping with their elevated migration potential (Figure 2) and the up-regulated mRNA levels of several genes associated with tumor progression and metastasis (CCL2, CCL5, and the calcium dependent S100A4). Furthermore, our data indicate that the calcium rich POR biolattice triggers up-regulation in CSCs-related genes mRNA level, which may indicate acquisition of characteristics associated with cancer stem cells (Figure 9).
Previously, the POR biolattice was proven to induce spontaneous MSCs differentiation towards osteblasts.41,50 However, the same microenvironment induced tumor promoting effects in the case of a fibrosarcomas, such as increased migration (Figure 2) and elevated tumor-related genes CCL5 and c-Myc (Figure 5); this phenomena were not evident in the non-tumorigenic cells (Figure 7), indicating that the tumorigenic effect of the microenvironment is limited to malignant cells.
Bone marrow has been described as a reservoir of Cancer Stem Cells (CSCs);61,62,63,64 however, it remains to be established whether cancer cells reach their bone marrow niches already equipped with upgraded tumorigenic capacities, or whether their tumorgenic potential may be regulated by this unique microenvironment. Our results suggest that a bone marrow-like microenvironment is capable of inducing changes in fibrosarcoma cells migration capacity, aside with up-regulation of genes, which are correlated to cancer increased aggressiveness and de-differentiation. CD44 and SOX2 genes have been reported to be closely linked to cancer stemness. Elevated expression of SOX2 has been shown to be dependent on cell environment, and it is followed by cell de-differentiation and the appearance of tumor-initiating stem cell phenotypes.53 Aside from being correlated with a cancerous stem cell state and extended invasiveness abilities,64 CD44 has been proven to be a pivotal factor in homing and engraftment of cancer cells in their quiescence niche in bone marrow.56,57,58,59
Cancer stem cells may remain quiescent in the BM niche for long periods,36 migrating to a future tumor site and establishing new malignancy even years after the primary tumor was eliminated.1,36,37 In our study, cancer cells cultured on 3D POR biolattice showed upgraded tumorigenic capacity, as manifested in their elevated migration potential towards MSCs, which served as a migration trigger (Figure 2). We suggest that the calcium providing milieu may induce a cancer stem cell-like state, endowing cells cultivated on POR scaffolds with greater tumorgenic potential.
In addition to these changes, we demonstrated that fibrosarcoma cells exploited the scaffolds’ unique architecture to construct tissue-like clusters. Similarly, cells in monolayer culture in the conditioned medium or in close proximity to the biolattice underwent changes in morphology and migration capacity. Our results also reveal increased ECM secretion in cells grown on and near POR scaffold (Figure 4).
Calcium signals have recently been shown to affect Epithelial-Mesenchymal Transition (EMT) induction, suggesting a possible avenue of research for the therapy of metastases.10 The fact that EMT is associated with changes in the expression of the calcium-dependent cadherins18,65 further highlights the pivotal role of calcium in neoplastic progression. The cadherin switch is thought to be correlated with both EMT and cancer cell aggressiveness and metastatic capacity.20,66
In our study just such a transition may have taken place on the non-coated POR scaffolds (Figure 8). The group with the highest tumorgenic abilities – those cells grown on POR (3D) – exhibited the highest N-cadherin mRNA expression (about three times higher than the 3Dg group), whereas their E-cadherin mRNA levels were three times lower. In the 3Dg group the architecture of the scaffolds favored multiple E-cadherin mediated cell-cell interactions, with the gold coating at least partially blocking the access to calcium. In the 3D group, on the contrary, the free availability of calcium from the 3D surface enabled upregulation of N-cadherin accompanied by down-regulation of E-cadherin.
Alterations in E-cadherin level can also serve as a positive regulatory factor for Wnt signaling via E-cadherin-β-catenin release. In conformity with this finding, the group that displayed enhanced migration capacity (3D) (Figure 2a) along with elevation in genes related to increased tumorigenicity (Figure 5) also demonstrated heightened expression of Wnt4 and c-Myc (Figure 6a). Up-regulation of these genes was accompanied by downregulation of the Wnt pathway inhibitors WIF-1 and AXIN-1 in 3D group (Figure 6b). These results suggest Wnt pathway involvement in the processes which led to upgrading of the tumorgenic capacity in cells grown on POR biolattice. Involvement of the Wnt pathway in the acquisition of advanced tumor features by fibrosarcoma cells is in agreement with the literature, where the Wnt pathway is characterized as a prominent force controlling cell proliferation, differentiation, and apoptosis21,25,27,29 Besides Wnt, other cancer related pathways and markers, such as the ERK/MAPK pathway and Ras, have also been shown to be regulated by calcium concentration.9 The calcium dependence of these pathways bears witness to the particular importance of this ion for malignant processes.
Based on these findings, we propose a model in which a calcium rich, bone marrow-like microenvironment activates certain processes involving Wnt signaling, which lead to an increase in the tumorigenic capacity and de-differentiation of fibrosarcoma cells.
Via the convergence effect of the Wnt-Cadherins pathways, the bone marrow-like biolattice influences decisionmaking pathways in cancer cells seeded onto the scaffold. On the one hand the three-dimensional architecture supports tissue-like cell organization with multiple cell-cell interactions, and on the other hand, the ample availability of calcium ions triggers changes in the expression of calcium dependent molecules. The combined effects of the calcium providing milieu result in a shift in the cancer cells’ differentiation state and enhanced tumorigenic abilities (Figures 6 and 9).
In light of our findings, we further suggest that when circulating tumor cells reach the bone marrow they switch to a quiescence mode, which shelters them until such time as some cues turns on proliferation and motility mechanisms. During their stay in the bone marrow the cancer cells are driven towards a more stem-like state on the stemness-differentiation continuum by the bone marrow microenvironment or/and by neighboring cells such as MSCs. We also suggest that acquisition of stem cell-like properties is an essential precondition for tumorigenicity enhancement, and that these cancer cells may have a superior capacity to invade a blood vessel and migrate towards the future site of a secondary malignancy, causing metastasis.
The POR calcium providing biolattice shows a resemblance to bone marrow pre-metastatic niches in terms of architecture, chemical composition, and a biological effect on cancer cells. Furthermore, our results suggest that the POR biolattice enhances the tumorgenic character of cultured fibrosarcomas, indicating that the BM-like microenvironment possesses the ability to interfere with cancer cell signaling pathways, mediating an enhanced tumorigenic potential and de-differentiation.
The up-regulation of cancer stemness-related genes and elevated tumorgenic potential observed on this biolattice prove enrollment of the calcium providing milieu in the acquisition of higher tumorigenic capacities by seeded fibrosarcoma cells. The POR model for cancer cell culturing brings us one step closer to understanding the complexity of the interactions occurring inside pre-metastatic niche of bone marrow and the microenvironmental influences affecting the cancer cells which it harbors. However, additional research and models are needed for better understanding the role of extra cellular calcium with conjunction of the tumor microenvironment and its role in controlling tumor development at the cellular and molecular level.
ACKNOWLEDGEMENTS
The authors would like to thank Prof. R.N. Apte of the Faculty of Health Sciences, Ben-Gurion University of the Negev, for his gift of fibrosarcoma cell-line, O. Shenkar and A. Sen for their contribution to this work.


