INTRODUCTION
According to a World Health Organization (WHO) survey, the number of obese people in the world has tripled since 1975. In 2016, over 1.9 billion adults aged 18-years or older were overweight; 650 million of those overweight people were obese. In countries with the largest part of the world’s population, more people die from being overweight or obese than from being underweight.1 Among overweight or obese men and women, the prevalence of hypertension, type II diabetes, gallbladder disease, and osteoarthritis all rise sharply with increased weight.2 Many obese people seek surgery or drug treatments, but gastric bypass surgery may lead to long-term vitamin and mineral deficiencies, post-operative complications, or even premature death.3,4 Weight-loss drugs have also been reported to lead to uncomfortable side effects in the human body: for instance, Qsymia® is a combination of phentermine and topiramate, the adverse effects of the two medications individually including headache, insomnia, depression,5 concentration; the side effects of taking orlistat include oily stools, diarrhea, stomach aches, and adverse reactions in the liver6; and Contrave® is a combination of bupropion and naltrexone, which may cause headache, vomiting, constipation, insomnia.7 To prevent obesity and ensure the dietary safety of obese people, the development of natural and safe weight-loss supplements with no side effects merits further study, in the hopes that natural ingredients can help improve fat metabolism, control body weight, and reduce fat accumulation in obese people.
Garcinia cambogia is a plant that is commonly found in Southeast Asian countries and in India. There are approximately 400 Garcinia species are distributed around the world8 and Garcinia cambogia is the species that can be legally used in Taiwan.9 Garcinia cambogia is known for lowering blood lipids, combatting diabetes, and anti-inflammation.8 Garcinia cambogia is rich in hydroxycitric acid (HCA), particularly the (−)-hydroxycitric acid isomer, which has antiobesity properties and can regulate serotonin, which is related to satiety, to reduce food intake. Furthermore, adenosine triphosphate citrate lyase (ATP citrate lyase) is a catalyst for the conversion of citric acid into acetyl-coenzyme A (Acetyl-CoA); it plays a key role in the synthesis of fatty acids, cholesterol, and triglycerides (TG). The HCA in Garcinia cambogia is an inhibitor of ATP citrate lyase and can reduce fat synthesis.10
Green coffee beans contain chlorogenic acid (CGA), which is the main polyphenol in coffee. This polyphenol can be found in various fruits and vegetables, such as grapes and strawberries.11 Raw coffee beans have a higher CGA content, with Coffee arabica containing 3.5 to 7.5% in dry mass.12 A related paper revealed that CGA can inhibit cholesterol synthesis in the liver, improve the balance of obesity hormones, and inhibit the absorption of cholesterol in the intestines.13
Wakame extract (Undaria pinnatifida) contains fucoxanthin, which can upregulate energy consumption and reduce excess lipids within white adipose tissue (WAT). These effects are partly induced by uncoupling protein 1 (UCP 1) in abdominal WAT. The body weight of mice with high energy (HE) diet–induced obesity was effectively reduced through the use of wakame extract containing fucoxanthin.14
The amount of glucose in the blood is also related to obesity. Excess glucose enters fat cells and is stored as fat, and obesity tends to lead to a decrease in insulin sensitivity, resulting in an increase in insulin resistance and blood sugar, which can cause more damage to the human body. As such, adding mulberry leaf extract (Morus alba L.) and chromium yeast, which can regulate blood sugar, in supplements can help obese people regulate their blood sugar. Mulberry leaf extract is known to contain l-deoxynojirimycin (DNJ), which is an effective inhibitor of α-glycosidases (sucrase, maltase, and glucoamylase) in the intestines.15 Chromium supplements can increase insulin metabolism and reduce the risk factors of cardiovascular diseases among obese people.16
The benefits of these ingredients to the human body are already known, but no research has investigated the effect of these ingredients in a compound supplement (hereafter GC) on fat and blood sugar. The purpose of this study was to evaluate the effects of GC in reducing body fat accumulation, using Sprague–Dawley rats who were given HE diet to induce body fat accumulation.
MATERIALS AND METHODS
Supplement Composition
Garcinia cambogia compounded supplements (GC) was provided by HealthTake Corporation (738.8 mg per tablet). The formula contains Garcinia cambogia extract, green coffee bean extract, wakame extract, mulberry leaf extract, and chromium yeast. Each tablet also contains 220 to 330 mg of HCA and 20 to 30 mg of CGA.
Study Design
This animal experiment project was approved by the Institutional Animal Care and Use Committee (approval number: CMUIACUC-2018-357) of China Medical University (CMU) and was conducted in accordance with CMU laboratory animal ethics and guidelines. Six-week-old male Sprague–Dawley rats were purchased from BioLASCO Taiwan and kept in an animal room at CMU. The animal room had a set temperature of 22 °C±2 °C and 12-hours of light starting from 8 AM and 12-hours of darkness starting from 8 PM. After allowing the animals 1 week of adaptation, the HE group was started on HE diet (formula: D12492 ; Research Diets Inc., New Brunswick, NJ, USA), which contained 5.24 Kcal/g of energy, comprising 20% protein, 60% fat, and 20% carbohydrates. The control group was given a regular maintenance diet (formula: Altromin 1320; Altromin Spezialfutter GmbH & Co. KG; Lage, Germany). Altromin 1320 contains 2.85 Kcal/g of energy, comprising 24% protein, 11% fat, and 65% carbohydrates. The drinking water was autoclaved.
The experiment animals were divided into 2 groups, with 12 rats in the control group and 36 rats in the HE group.17 The control group rats were given regular feed, and the HE group was given HE diet. During the first 4-weeks, the rats were 3 to a cage; from the fifth to ninth week, each rat was in its own cage to facilitate the measuring of its food intake and food efficiency. After 5-weeks on the HE diet, the control group continued receiving regular feed, whereas the HE group was further divided into 3 groups of 12 rats on the basis of whether they received supplements and the relevant dosage. One group was given 0.5% carboxymethyl cellulose (CMC). The oral dosage of GC for the rats was calculated according to the human-to-rat metabolism conversion rate of 6.2 and the recommended daily GC dosages for humans (4 tablets, 738.8 mg per tablet). The daily dosage for rats was 2955.2 mg/60 kg (human body weight)×6.2=305 mg/kg. Thus, 305 mg/kg was the rat equivalent of one human dose. The daily dosages in this study were 305, and 1220 mg/kg, which were equivalent to 1, and 4 times the human dosages and were denoted as GC-L, and GC-H, respectively. The samples were prepared using a 0.5% CMC solution into suspensions of 30.5, or 122.0 mg/mL concentrations. The rats were fed using gastric tubes once a day, and the cast volume was 1 mL/100 g body weight. The control group were given the same volume of CMC solution. After 4-weeks of casting, the experiment animals were euthanized; prior to being euthanized, the animals fasted for 1 night. While the rats were under anesthesia, blood samples were collected from the celiac artery for blood biochemical analysis. The epididymal, perirenal, and mesenteric adipose tissue within the peritoneal cavity was also extracted and weighed on a precision scale to determine the body fat percentage. The experiment design was showed in Figure 1.
Figure 1. Schematic Representation of the Experimental Design Timeline
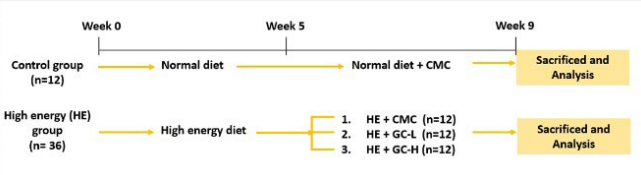
Control, normal diet with CMC; HE + CMC, high energy diet with CMC; HE + GC-L, high energy diet with 305 mg/kg/day of GC; HE + GC-H, high energy diet with 1220 mg/kg/day of GC
Body Weight and Food Intake
During the experiment period, the rats were weighed once a week to determine the test substance amount to be administered that week and for comparing the rats’ weights at the start and end of the experiment. During the fifth to ninth week, the rats’ daily food intake was also recorded to calculate the daily average food intake of each rat each week. At the end of the experiment, the rats’ food efficiency during the 4-weeks of consuming the test substance was calculated using the following formula: food efficiency(%)=(weight gain/food intake)×100.
Caloric Intake
When converting food intake into caloric intake, the conversion was 2.85 Kcal/g for the regular feed and 5.24 Kcal/g for the HE diet. For the groups that were administered the test substance, the caloric conversion for GC was 3.07 Kcal/g, and the amount that was administered was based on the rat’s body weight that week. At the end of the experiment, the caloric efficiency of the rats during the 4-weeks of consuming the test substance was calculated using the following formula : Kcal efficiency(%)=(weight gain/Kcal intake)×100.
Measurement of Liver Fat Concentrations
After blood samples were collected from the celiac artery, the livers were rinsed with saline and stored at -80 °C for later use. Following the method employed by Folch et al,18 after the lipids were extracted, the concentrations of TG and cholesterol in the liver were measured18 by taking 0.1 g of liver tissue and adding 2 mL of extraction solvent (chloroform : methanol=2 : 1) from each rat. After the samples were homogenized with a homogenizer, they rested at room temperature for 60-minutes; the samples were subsequently placed in a centrifuge at 5000 rpm for 5-minutes. The top solution was placed in clean 1.5 mL centrifuge tube, and 0.2 mL of 0.9% sodium chloride (NaCl) was mixed into the solution. At this point, the liquid became cloudy. After being centrifuged at 2000 rpm for 5-minutes, the solution was divided into 2 layers. The bottom solution was retained and placed in a dry heater, where it was blown dry at 55 °C using nitrogen. After the solution was dried, the dried substance was combined with 100 μL of a solution of tert-butyl alcohol : triton X-100 : methanol (2 : 1 : 1) and heated at 65 °C for 15-minutes until completely dissolved. The new solution was tested using commercially available cholesterol and TG reagents (Roche).
Measurement of Serum Biochemical Values
Blood samples from the rats were processed in the centrifuge at 4700 rpm for 15-minutes to extract the plasma for the biochemical tests. Alanine aminotransferase (ALT), aspartate aminotransferase, TG, uric acid (UA), and creatinine in the serum were analyzed using commercially available diagnostic reagents (Roche, Germany) and a chemistry analyzer (Cobas Mira Plus, Roche, Switzerland). Free fatty acids (FFA) were measured using a non-esterified fatty acid kit (RANDOX, County Antrim, UK). Total cholesterol (T-Cho), low-density lipoprotein cholesterol (LDL-C), and high-density lipoprotein cholesterol (HDL-C) were measured using commercially available reagent kits (Fortress Diagnostics Limited, Antrim, UK). Ketone bodies were tested using a commercially available β-Hydroxybutyrate colorimetric assay kit (Cayman Chemical, MI, USA). Concentrations of sodium (Na) and potassium (K) in the blood were measured using enzyme methods with commercially sold reagent kits (Fortress Diagnostics Limited, Antrim, UK). Blood sugar was analyzed using a glucose analyzer (model 1500: Sidekick Glucose Analyzer; YSI. Yellow Spring, OH, USA).
Tissue Section Dyeing
The fat tissue around epididymis was extracted, set with formalin, and subsequently embedded in paraffin and cut into sections. The fat tissue sections were applied with a hematoxylin and eosin (H&E) stain and placed under a light microscope for observation.
Statistical Analysis
Results are expressed as the mean±SD. All experimental data were analyzed by one-way analysis of variance using the Dunnett’s test, provided the data passed a normality test. A value of p<0.05 was used to indicate statistical significance between groups.
RESULTS
Body Weight Changes
The control group and the 3 HE groups exhibited no differences in body weight at the beginning of the experiment (Table 1). From the first to ninth-week, the rats in the HE+CMC group exhibited significantly higher body weights than the control group. After being fed an HE diet for 5-weeks, the 3 HE groups exhibited no differences in average body weight. The 2 groups who were administered GC had significantly lower average body weights than the HE+CMC group after continuing the HE diet from the seventh to ninth-week. In the ninth week, the rats in the HE+GC-L group had significantly lower average body weights than those in the HE+CMC group (p<0.05). After continuing on the HE diet from the seventh to ninth-week, the rats in the HE+GC-L group had significantly lower average body weights than rats in the HE+CMC group (p<0.05).
| Table 1. Effects of Supplements on Body Weight in Rats Fed with HE Diet |
|
Weeks
|
Body Weight (g) |
| Control |
HE+CMC |
HE+GC-L |
HE+GC-H
|
|
Week 0
|
187.7±4.1 |
188.4±4.1 |
188.3±6.9 |
190.5±4.8 |
| Week 1 |
256.6±9.9 |
272.6±10.3## |
271.9±9.5 |
271.1±10.6
|
|
Week 2
|
280.5±13.7 |
310.1±16.7## |
313.8±35.9 |
312.9±15.6 |
| Week 3 |
346.0±19.8 |
392.3±22.5### |
391.1±36.5 |
389.3±22.4
|
|
Week 4
|
376.3±20.7 |
437.7±26.8### |
433.1±38.4 |
431.8±23.8 |
| Week 5 |
399.8±21.7 |
479.7±28.7### |
472.8±41.1 |
472.2±26.7
|
|
Week 6
|
427.0±30.6 |
532.9±42.1### |
499.7±46.9 |
500.1±29.9 |
| Week 7 |
451.5±33.9 |
568.4±45.4### |
529.7±49.0 |
522.9±30.9*
|
|
Week 8
|
467.5±38.8 |
594.0±48.7### |
552.7±52.1 |
543.8±33.8* |
| Week 9 |
477.9±42.0 |
618.5±57.1### |
569.5±51.3* |
561.9±37.1*
|
| Control, normal diet with CMC; HE+CMC, high energy diet with CMC; HE+GC-L, high energy diet with 305 mg/kg/day of GC; HE+GC-H, high energy diet with 1220 mg/kg/day of GC. Values were expressed as means±SD, n=12 in each group. Data were analyzed by one-way analysis of variance using the Dunnett’s test. ##p<0.01, ###p<0.001 as compared with the control group. *p<0.05 as compared with the HE+CMC group. |
Food Efficiency and Caloric Efficiency
The HE rats were given HE diet for 9-weeks. After the first 5-weeks on the HE diet, the rats were started on 0.5% solution of CMC or GC for the remaining 4-weeks. The rats’ weight gains were calculated by subtracting their body weight at the end of the first 5-weeks from their body weight at the end of the total 9-weeks; total food intake was the sum of the food intake from the sixth to ninth-week. As presented in Table 2, the total weight gain in the HE+CMC group was significantly higher than in the control group (p<0.001). The total weight gains in the GC groups were significantly lower than in the HE+CMC group (p<0.01). From the sixth to ninth-week, the total food intake of the HE+CMC group was significantly lower than that of the control group, but the total caloric intake was significantly higher in comparison. The GC groups and the HE+CMC group demonstrated no difference in total food intake and total caloric intake. Food efficiency and caloric efficiency were calculated according to total weight gain, total food intake, and total caloric intake during the fifth to ninth-week. The HE+CMC group demonstrated significantly higher food efficiency and caloric efficiency than the control group (p<0.001), and the GC groups’ food efficiency and caloric efficiency were significantly lower than those of the HE+CMC group (p<0.01).
| Table 2. Effects of Supplements on Food Efficiency and Caloric Efficiency in Rats Fed with HE Diet |
|
Treatments
|
Weight Gain (g) |
Food Intake (g) |
Feed
Efficiency (%) |
Calorie Intake (Kcal) |
Calorie
Efficiency (%) |
| Control |
78.2±28.4 |
866.4±75.5 |
8.9±2.5 |
2469.0±214.8 |
3.1±0.9
|
|
HE+CMC
|
138.8±34.4### |
605.2±30.5### |
22.8±4.8### |
3170.7±160.9### |
4.4±0.9### |
| HE+GC-L |
96.8±20.3** |
594.1±57.0 |
16.3±3.1*** |
3125.0±296.6 |
3.1±0.6**
|
|
HE+GC-H
|
89.8±21.6*** |
584.9±47.4 |
15.3±3.6*** |
3118.3±248.8 |
2.9±0.7***
|
| Control, normal diet with CMC; HE+CMC, high energy diet with CMC; HE+GC-L, high energy diet with 305 mg/kg/day of GC; HE+GC-H, high energy diet with 1220 mg/kg/day of GC. Values were expressed as means±SD, n=12 in each group. Data were analyzed by one-way analysis of variance using the Dunnett’s test. ###p<0.001 as compared with the control group. **p<0.01, ***p<0.001 as compared with the HE+CMC group. |
Changes in Body Fat and Liver Indicators
As indicated in Table 3, the weights of perirenal and mesenteric adipose tissue and the total weight of body fat were significantly lower among the rats in the HE+GC-L group than in the HE+CMC group (p<0.05). In the HE+GC-H group, the weights of epididymal, perirenal, and mesenteric adipose tissue and the overall weight and percentage of body fat were significantly lower than those in the HE+CMC group (p<0.05). The HE+CMC group exhibited significantly higher absolute liver weight, cholesterol levels in the liver, and TG concentrations in the liver than the control group (Table 4). Absolute liver weight, cholesterol levels in the liver, and TG concentrations in the liver were lower in the GC groups than in the HE+CMC group.
| Table 3. Effects of Supplements on Body Fat Mass and Body Fat Percentages in Rats Fed with HE Diet |
|
Treatments
|
Weight of Adipose Tissue |
Body Fat (g) |
Body Fat Ratio (%) |
| Epididymal
Adipose Tissue (g) |
Perirenal Adipose
Tissue (g) |
Mesenteric
Adipose Tissue (g)
|
| Control |
4.9±1.2
|
5.4±1.4 |
2.7±0.8 |
13.0±3.0 |
2.7±0.5
|
| HE+CMC |
15.1±4.6###
|
22.5±5.6### |
8.6±2.6### |
46.3±12.2### |
7.4±1.4###
|
| HE+GC-L |
12.9±3.3
|
17.1±4.9* |
6.7±1.9* |
36.6±9.6* |
6.4±1.1
|
| HE+GC-H |
11.4±2.7*
|
17.3±5.0* |
6.1±1.7** |
34.8±8.6* |
6.2±1.2*
|
| Control, normal diet with CMC; HE+CMC, high energy diet with CMC; HE+GC-L, high energy diet with 305 mg/kg/day of GC; HE+GC-H, high energy diet with 1220 mg/kg/day of GC. Body fat defined as the sum of epididymal adipose tissue, perirenal adipose tissue, mesenteric adipose tissue. Body fat ratio (%) defined as (Body fat (g)/Body weight (g))×100. Values were expressed as means±SD, n=12 in each group. Data were analyzed by one-way analysis of variance using the Dunnett’s test. ###p<0.001 as compared with the control group. *p<0.05, **p<0.01, as compared with the HE+CMC group. |
| Table 4. Effects of Supplements on Liver Concentrations of Triglycerides and Cholesterol in Rats Fed with HE Diet |
|
Parameters
|
Control |
HE+CMC |
HE+GC-L |
HE+GC-H
|
| Liver (g) |
12.2±1.9
|
15.3±2.8## |
14.1±2.7 |
14.1±1.8
|
| Liver (%) |
2.6±0.2
|
2.5±0.3 |
2.5±0.4 |
2.5±0.3
|
| Cholesterol (mg/g tissue) |
2.4±1.9
|
13.8±2.0### |
12.2±1.9 |
11.6±2.7
|
| Triglyceride (mg/g tissue) |
14.8±7.6
|
42.7±5.7### |
41.3±5.0 |
37.8±2.6
|
| Control, normal diet with CMC; HE+CMC, high energy diet with CMC; HE+GC-L, high energy diet with 305 mg/kg/day of GC; HE+GC-H, high energy diet with 1220 mg/kg/day of GC. Values were expressed as means±SD, n=12 in each group. Data were analyzed by one-way analysis of variance using the Dunnett’s test. ##p<0.01, ###p<0.001as compared with the control group. |
Serum Biochemical Tests
According to the 13 serum biochemical indicators in Table 5, the HE+CMC group and the control group did not differ in terms of ALT, HDL-C, UA, Na, or K; the remaining 8 indicators were higher in the HE+CMC group than the control group. The GC groups exhibited significantly lower serum T-Cho concentrations; the HE+GC-H groups had significantly lower serum concentrations of LDL-C and FFA, and all 2 dosages of GC demonstrated trends of lowering blood sugar, with the HE+GC-H dosage achieving significant decreases (p<0.05). No adverse effects were observed in this experiment.
| Table 5. Effects of Supplements On Plasma Biochemical Values in Rats Fed with HE Diet |
|
Parameters
|
Control |
HE+CMC |
HE+GC-L |
HE+GC-H
|
| AST(U/L) |
138.8±32.6
|
204.3±41.8### |
177.2±32.0 |
157.3±38.6*
|
| ALT(U/L) |
40.8±7.3
|
41.1±7.0 |
38.3±4.9 |
41.2±7.3
|
| TG (mg/dL) |
39.4±14.2
|
59.7±24.0# |
50.0±7.8 |
35.5±7.9**
|
| T-Cho (mg/dL) |
42.4±8.5
|
55.1±5.7### |
47.8±6.9* |
44.0±5.1***
|
| LDL-C (mg/dL) |
8.8±2.5
|
17.0±8.2### |
13.3±3.3 |
10.6±3.7**
|
| HDL-C (mg/dL) |
25.3±5.7
|
26.8±3.9 |
24.4±4.7 |
25.4±3.9
|
| FFA (mmol/L) |
0.45±0.09
|
0.68±0.17### |
0.58±0.19 |
0.48±0.11**
|
| KB (nmol/mL) |
471.1±165.1
|
780.8±167.6### |
779.0±159.4 |
735.2±162.2
|
| Crea (mg/dL) |
0.28±0.06
|
0.37±0.05## |
0.33±0.06 |
0.33±0.05
|
| UA (mg/dL) |
1.54±0.31
|
1.86±0.50 |
1.90±0.33 |
1.75±0.29
|
| Na(mEq/L) |
143.6±1.4
|
144.2±0.7 |
143.8±1.5 |
143.3±1.1
|
| K(mEq/L) |
4.7±0.3
|
4.6±0.4 |
4.7±0.2 |
4.5±0.3
|
| Glu (mg/dL) |
124.4±15.4
|
154.7±25.3### |
140.0±14.9 |
133.5±11.5*
|
| Control, normal diet with CMC; HE+CMC, high energy diet with CMC; HE+GC-L, high energy diet with 305 mg/kg/day of GC; HE+GC-H, high energy diet with 1220 mg/kg/day of GC. Values were expressed as means±SD, n=12 in each group. Data were analyzed by one-way analysis of variance using the Dunnett’s test. #p<0.05, ##p<0.01, ###p<0.001 as compared with the control group. *p<0.05, **p<0.01, ***p<0.001 as compared with the HE+CMC group. AST, aspartate aminotransferase; ALT, alanine aminotransferase; TG, triglyceride; T-Cho, total cholesterol; LDL-C, low density lipoprotein-cholesterol; HDL-C, high density lipoprotein-cholesterol; FFA, free fatty acid; KB, ketone body; Crea, creatinine; UA, uric acid; Na, sodium; K, potassium; Glu, glucose. |
Tissue Sections
The diameters of fat cells around the epididymis in the HE+CMC group were significantly greater than those of the control group (Figure 2). The fat cell diameters of rats in the 2 GC groups were significantly smaller than those of the rats in the HE+CMC group.
Figure 2. Histological Observations of Epididymal Adipose Tissue (400x)
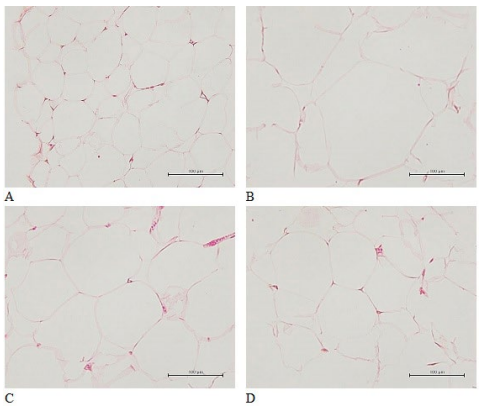
(A) Control, normal diet with CMC; (B) HE+CMC, high energy diet with CMC; (C) HE+GC-L, high energy diet with 305 mg/kg/day of GC; (D) HE+GC-H, high energy diet with 1220 mg/kg/day of GC.
DISCUSSION
The Sprague–Dawley rats used in this experiment had starting weights of approximately 188 g and were fed an HE diet (5.24 Kcal/g) for 9-weeks. The results in Tables 1 and 3 demonstrate that compared with the control group, the HE+CMC group gained 29.4% more weight and 256% more body fat (i.e., epididymal, perirenal, and mesenteric adipose tissue). The HE diet significantly increased the rats’ body fat accumulation, and after 5-weeks on the HE diet, the rats were administered GC every day for the next 4-weeks. In the HE+GC-L group, body weight decreased by 7.9%, and body fat decreased by 20.9%. In the HE+GC-H group, body weight decreased by 9.2%, and body fat decreased by 24.6%. These results indicate that GC can considerably reduce body fat accumulation in rats.
Food efficiency refers to the degree that food is digested, absorbed, and utilized after entering the body. Higher percentages indicate that the food is more fully utilized in the body. During the period that the rats were administered GC, the rats’ food and caloric efficiencies were calculated according to their total weight gain, total food intake, and total caloric intake during the fifth to ninth-week. The GC groups exhibited significantly lower food efficiency and caloric efficiency than the HE+CMC group. These results indicate that GC can lower food efficiency and caloric efficiency to reduce body weight and body fat accumulation.
An HE diet activates liver 3-hydroxy-3-methylglutaryl-coenzyme A reductase (HMG-CoA reductase) and Sterol regulatory element binding protein-1c (SREBP1c), increasing the synthesis of cholesterol and TG.19,20 Therefore, the rats in the HE+CMC group had significantly higher concentrations of liver cholesterol and liver TG than the control group rats, but the administration of GC had no effects on the synthesis of liver cholesterol and liver TG. HE feed caused the rats’ absolute liver weight to increase, and studies have indicated that rats’ liver weight and body weight are correlated21; therefore, analyzing weight gain on the basis of relative weight is more objective. No difference was observed in relative liver weights among the 2 GC groups and the HE+CMC group. The HE diet was associated with an increase in TG, T-Cho, LDL-C, and FFA in the blood, and the consumption of GC was associated with lower concentrations of TG, T-Cho, LDL-C, and FFA. The HE diet resulted in body fat accumulation in the rats and may have led to insulin resistance and increased blood sugar; the consumption of GC in the 2 treatment groups was significantly associated with lower blood sugar. Fat accumulation increases the release of FFA into the blood and reduces the clearance rate of FFA in the body.22 As such, feeding rats with HE diet will cause obesity and an increase in FFA in the blood; however, GC can reduce the accumulation of fat and the concentration of FFA in the blood. The 2 dosages of GC overall demonstrated no effect on renal indicators, namely UA, creatinine, and electrolytes (Na and K concentrations in the blood). The H&E staining of the fat cells revealed that the HE+CMC group’s fat cells were significantly larger than those of the control group. In the GC groups, the increase in the size of the fat cells was inhibited. In a meta-analysis of randomized controlled trials in humans, Garcinia cambogia supplements were found to significantly reduce body weight by 1.34 kg, body mass index (BMI) by 0.99 kg/m2, and waist circumferences by 4.16 cm compared with the placebo group.23 Moderately obese participants (aged 21-50-years, BMI>26 kg/m2) were administered a compound of 4667 mg of Garcinia cambogia extract (containing 60% HCA, which is equivalent to 2800 mg of HCA each day), 4 mg of chromium nicotinate, and 400 mg of Gymnema sylvestre extract; this compound was able to significantly lower levels of T-Cho, LDL-C, TG, and serum leptin 24 which indicates that compound Garcinia cambogia and chrome supplements are effective and do not adversely affect the human body in this test. However, in 2019, there was an adverse event related to Garcinia cambogia. A woman overdose consumed more than 1500 mg of HCA per day, which led to visual disturbance.25 In another literature review, some experiments related to Garcinia cambogia did not have a significant effect, but with exercise and divided consumption of Garcinia cambogia extract was more effective.26 Considering related cases and complying with Taiwan’s food regulations, the daily limit of Garcinia cambogia is 1500 mg HCA.9 Therefore, it is designed to be the content of GC and can be used in human experiments with diet and exercise planning in the future, and observe the overall effect and influence.
CGA in green coffee beans can improve obesity-related hormone levels, inhibit the absorption of cholesterol in the intestines, and inhibit cholesterol synthesis in the liver.13 Its mechanism of action likely involves activating AMP-activated protein kinase (AMPK) pathways to increase the transport of glucose among the muscles, which then inhibits G6Pase expression in the liver, reduces hepatic steatosis, improves glucose intake in the skeletal muscles, improves fasting tolerances of blood sugar and glucose, increases insulin sensitivity, and lowers fatty acid production.27 Some clinical studies have revealed that obese people can lower their average weight by 5.4 kg by consuming coffee enriched with 500 mg of CGA every day. Coffee rich in CGA has significant effects on the absorption and utilization of glucose.28 Animal experiments that involved rats on a high-cholesterol diet found that ingesting 1 to 10 mg/kg body weight/day of CGA can reduce T-Cho and LDL-C.29 In the current study, each GC tablet contained 20 to 30 mg of CGA; the daily dosage of 4 tablets for adults thus contains 80 to 120 mg of CGA in total, which is the equivalent of 8.3 to 12.4 mg/kg body weight/day in rats, and is expected to achieve this cholesterol-lowering effect.
In a double-blind placebo-controlled study in Japan, obese adults (BMI>25 kg/m2) were given capsules containing 1 mg or 3 mg of fucoxanthin or placebos for 4-weeks. The group that was given 3 mg of fucoxanthin exhibited significant reductions in their relative weight, BMI, and visceral fat area; total body fat, subcutaneous fat area, waist circumference, and leg circumference were also significantly lower in the group given 1 mg of fucoxanthin than in the placebo group.30 Each GC tablet contained approximately 2 mg of fucoxanthin, which is expected to lower obesity parameters in obese people with long-term use. Prior studies have indicated that fucoxanthin, through the downregulation of lipoprotein receptors and scavenger receptor class B member 1, can significantly reduce the concentrations of plasma and TG in the liver. Fucoxanthin supplements can also lower the messenger ribonucleic acid (mRNA) expression of fatty acid synthase, an enzyme that catalyzes fatty acid synthesis, and reduces the phosphorylation of insulin receptor substrate 1 to inhibit the intake of glucose by mature fat cells.31
Furthermore, among mice in which obesity was induced by a HE diet, consumption of mulberry leaf extract for 13-weeks was associated with a reduction in body weight, fat accumulation, and blood sugar as well as improved insulin sensitivity. Mulberry leaf extract can help manage obesity by activating brown adipose tissue, increasing gene expressions of UCP 1, peroxisome proliferator-activated receptor gamma coactivator 1-alpha (PGC-1α), peroxisome proliferator-activated receptor-gamma coactivator-1β (PGC-1β), peroxisome proliferator-activated receptor gamma (PPARγ), and regulating gut flora.32 In another study, diabetic mice were given DNJ (50 and 100 mg/kg b.w./day), which is found in mulberry leaf extract. The results indicated that DNJ can be absorbed through the gastrointestinal mucosa and rapidly diffused into the liver to lower postprandial blood sugar and alleviate the toxicity of supraphysiological glucose to beta cells. This significantly reduces glycated hemoglobin.15
The GC supplement also contains chromium yeast, which use Saccharomyces cerevisiae as a carrier. Minerals are added to a fermentation medium, where it is absorbed by the live yeast and converted into a natural form. Chromium, possibly by bolstering the kinase activity of insulin receptor β (IR-β), increases the activity of the downstream effectors of insulin signals phosphatidylinositol 3-kinase (PI3K) and protein kinase B (Akt) and reinforces the transport of glucose transporter type 4 (Glut4) toward the surface of the cells. Chromium can also upregulate AMPK to increase glucose intake.33
LIMITATION
The current animal experiments revealed preliminary but significant results. In the future, the long-term effects of the GC supplement in the human body can be examined. We will further discuss simple plant extracts (e.g. green coffee bean extract, wakame extract) and GC supplement, whether there is a significant difference between them. The ability of GC compounds to improve obesity in humans merits further discussion.
CONCLUSION
The use of the recommended dosage of GC for the human body in HE diet-induced obese rats can evidently lower fat accumulation and body fat (epididymal, perirenal, and mesenteric adipose tissue), food efficiency and caloric efficiency, reduce the food absorption and utilization in these rats. As such, GC has potential as a novel weight-loss dietary supplement. In the future, GC supplements can be examined in human experiments, with in-depth research on the lasting effects and possible variable improvements on the human body.
ACKNOWLEDGEMENTS
This study was sponsored by HealthTake Corporation, who provided the GC used in this study.
INSTITUTIONAL ANIMAL CARE AND USE COMMITTEE PERMISSION
Yes.
CONFLICTS OF INTEREST
The authors declare that they have no conflicts of interest.


