INTRODUCTION
Physical exhaustion is experienced after vigorous exercise due to a variety of factors, including the production of multiple exercise-induced substances such as blood lactic accumulation (La) in the blood, salivary amylase1,2 which is a marker of increased parasympathetic activity, and 8-Oxo-2’-deoxyguanosine (8-OHdG),3 which is a marker of DNA oxidative damage.
In individuals who are engaged in sporting events, such as track and field and swimming that involve multiple repetitive actions over a single day, physical recovery from fatigue before the next sporting event is an important issue. The types of recovery can be broadly classified into passive recovery, which is a cooling down period of rest, and active recovery (AR), which is achieved exercise. In general, the optimal type of AR is a low-intensity (30- 40% VO2max) aerobic exercise.4,5
La is associated with fatigue because higher levels of La in the blood cause a decline in pH. Specifically, increased production of hydrogen ions interferes with ATP-synthesis in skeletal muscles, which in turn makes it difficult to induce muscle contraction. Contrastingly, La is sometimes also considered as a source of energy. Although La is produced from the unoxidized pyruvic acid during ATP production via anaerobic metabolism by type IIb and other types of fast muscle fibers, particularly those with abundant mitochondria (e.g. myocardial cells and type I fibers), it is used as an energy source during aerobic processes.6,7 Thus, the use of different types of exercises that utilize the cardiac muscle and type I fibers (thereby utilizing La) are more likely to be effective in AR.
Occasionally, an athlete can collapse after completing an event, such as a cycle sprint or a short-or medium-distance sprint which mainly involves the utilization of leg muscles. When this type of acute passive recovery occurs after supramaximal exercise, the volume of blood returning to the heart from the lower limbs decreases, which causes the loss of consciousness.8 Abrupt cessation of exercise may lead to hyperventilation,9 maintenance of La levels,10 and persistent muscle pain.11 In cases where athletes are already exhausted after engaging in a sporting event, they may not be able to perform AR exercises. Thus, an easy method for performing AR for athletes must be investigated.
Since 2000, Nordic walking (NW) originating in Finland has gained in popularity as a healthy sports activity by northern Europeans.12 At a given walking speed, NW involves upper body muscles and induces greater exercise intensity asrising energy consumption compared with normal walking (W).13,14,15,17
The aim of our study was to clarify the effect of active recovery (AR) after supramaximal exercise in which the leg muscles was taken as the protagonist muscles. In this study, the participants performed one of the two different types of AR exercises, wherein they were required to support their body weight. These AR activities were performed after a supramaximal exercise in which the leg muscles were utilized as the protagonist muscles. The intensity of the AR tasks was the same as that of the exercise task. An anaerobic power test (AT) was then implemented, and its effect on the AR task was investigated.
METHODS
Participants
The participants were healthy adult men who habitually exercised (n=6). Their age, height, weight, body fat percentage, and blood pressure (systolic) were as follows [mean±standard deviation (SD)]: 21.8±0.8 years, 174.7±3.7 cm, 74.3±6.7 kg, 12.4%/2.4%, 120.0±8.8 mmHg, respectively (Table 1). All subjects regularly engaged in physical exercise. All participants were familiarized with the experimental procedures, and it was ensured that the attachment of the experimental device to the body did not have any effects on the physiological responses of the participants each exercise protocols. The participants were instructed not to consume large amounts of caffeinated or alcoholic beverages on the day prior to the testing and to get enough sleep on the previous night. They were also instructed to eat breakfast on the day of testing, to stop eating at least 2 h prior to the testing, and to be at rest in the testing room. As high-intensity exercises were involved in this study, the participants underwent a pretest for safety purposes, and those who could reach a VO2max of at least 50 mL/kg/min were selected. All the participants were provided with a complete oral and written explanation of the objective, contents, safety, and ethical considerations of the study, such as data management procedures prior to the start of testing, and informed consent was obtained from them. This study was approved by the institutional review board of Juntendo University Faculty of Health Science and Nursing (Approval No: 24005).
| Table 1. Physical Characteristics and VO2max, HRmax and the Main Exercise Load (120% VO2max) obtained in Maximal Exercise Test |
|
Subject
|
Age (yrs) |
height (cm) |
Weight (kg) |
%Fat (%) |
Mean of systolic blood pressure (mmhg) |
VO2max (ml/min/kg) |
HRmax bpm |
Exercise load 120% VO2max:kp
|
|
A
|
22 |
175.2 |
74.8 |
12.6 |
121 |
56.8 |
179 |
3.61 |
| B |
22 |
171.5 |
65.5 |
9.5 |
125 |
55.1
|
174
|
3.33
|
|
C
|
21 |
173.7 |
77.6 |
12.5 |
130 |
51.7 |
191 |
3.65 |
| D |
22 |
179.1 |
82.2 |
14.4 |
122 |
50.3
|
177
|
3.94
|
|
E
|
21 |
178.6 |
78.7 |
15.6 |
104 |
56.6 |
190 |
3.63 |
| F |
23 |
169.8 |
66.8 |
9.7 |
118 |
53.9
|
180
|
3.20
|
|
Mean
|
21.8 |
174.7 |
74.3 |
12.4 |
120.0 |
54.1 |
181.8 |
3.56 |
| SD |
3.7 |
3.7 |
6.7 |
2.4 |
8.8 |
2.6
|
7.0
|
0.26
|
maximum oxygen uptake; VO2max
maximum heart rate; HRmax. |
Procedures
Overview: To elucidate the AR effect of NW performed after the main exercise at an intensity of 120% VO2max, the physiological response to a performance test during and after recovery was investigated. The tests consisted of two types and were conducted as pretests at least one week before main exercise: 1) all-out test (stepped exercise load test using a cycle ergometer) and 2) walking test [treadmill walking of either the W or NW type at a speed of 60–120 m/ min]. The main tests were conducted under the conditions indicated below. To eliminate the order effect, the participants were randomly assigned to perform one of the tests, and the effect of AR was measured using the cross-over method. In consideration of the carryover effect, at least 1 week was secured during each test.
1) W test: It was performed as an AR activity after the Ex I. After 5 min of seated rest, Ex II was performed, followed by AT, involving three sets of full-speed pedaling for 10 s at 2-min intervals.
2) NW test: It was performed in a similar manner as the W test; however, it was utilized as the AR activity.
Pretest protocol: At least 1-week prior to main test, the participants performed 1) maximal exercise test for measuring the VO2max and 2) Walking (W and NW) test for calculating AR intensity.
Maximal exercise test: The participants performed a maximal exercise test on a cycle ergometer to calculate the exercise intensity of the main exercise tasks. The participants entered the testing room 30 min prior to the start of the test. After checking their overall physical condition, height, weight, and blood pressure were measured, and they were then instructed to rest. Blood pressure was measured using a digital sphygmomanometer (TERUMO). HR was measured by placing the electrocardiography (ECG) electrodes at the following locations: the manubrium of the sternum, acromion, and midaxillary line of the fifth rib. The participants remained at rest in a seated position, and an air collection mask was fixed to their faces to measure their respiratory gas concentration and ventilation volume. After measuring their resting metabolism for 5 min, the stepped exercise tolerance test was performed using a cycle ergometer (Power Max VIII, Combi Wellness Corporation, Tokyo, Japan). After 2 min of pedaling at 90-rpm revolutions and 1.0-kp load, the load was gradually increased at the rate of 0.2 kp/min until the participant was exhausted.16 The reason why the pedaling exercise employed “90 rpm” rather than the general 60 rpm is because the main exercise is performed with 120% VO2max intensity, which is suitable to be more type II fiber recruitment.17
The participant’s subjective evaluation of the exercise intensity was recorded using the Borg scale 15 s before increasing the load and speed. The VO2max criteria were as follows: leveling VO2max; achieving maximum HR; and achieving Borg scale score of 20.
Walking (W and NW) tests: Prior to the start of the test, W and NW tests were conducted to calculate the W and NW speeds, respectively, during the AR activity. The AR intensity in this study was set at 4 metabolic equivalents (METs) of the task, and the walking speed at this intensity was calculated using the interpolation method. The oxygen intake of the participants at rest was 4.3±0.9 mL/kg/min, and their VO2max was 54.1±2.6 mL/kg/min, indicating that the intensity of 4 METs ranged from 25.7% to 31.0% of VO2max The maximal exercise test was performed in a similar manner as the above mentioned preparations, except that the resting metabolism was measured. The treadmill inclination was set at 5%. The participants performed the W test for 2 min, followed by the NW test for 2 min. Thus, their walking speed was gradually increased over 4 min, with the walking time increasing from 60 m/min to 120 m/min.14 The device was set to allow walking speeds of up to 120 m/min in each case. The subjective exercise intensity assessment results of the participants were recorded immediately prior to shifting from the W to NW test and again immediately before the conclusion of the NW test using the OMNI scale.
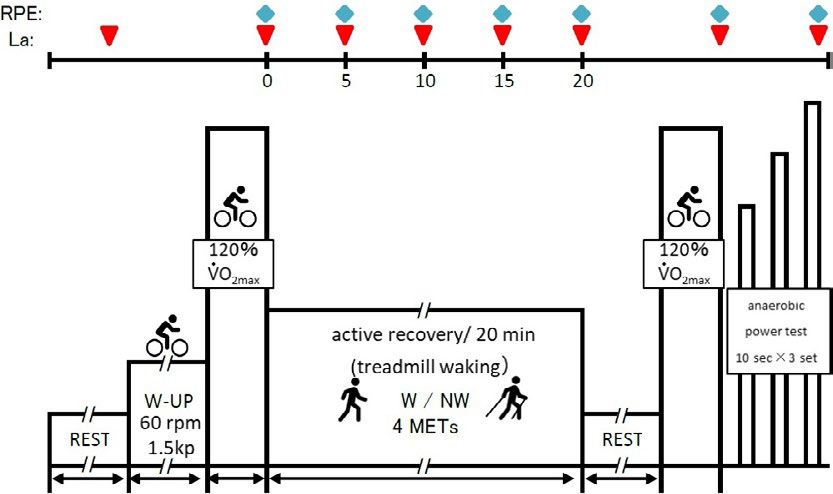
Main test protocol: The participants performed the same above mentioned preparations. Their respiratory gas and blood La levels were measured while at rest. The position of the cycle ergometer was adjusted as follows: the participants mounted and placed the device, with one foot on the pedal, to adjust the height so that the knee was at maximum extension. Immediately after the resting period, the participants mounted the cycle ergometer and performed 3 min of warm-up at 1.5 kp×60 rpm. The Ex I consisted of 90 s of pedaling at an intensity of 120% VO2max.The load equivalent to 120% VO2max when pedaling was performed at 120 rpm was recalculated from the load (kp)-%VO2max relational expression at the maximal exercise test (Table 1). This high frequency in the Ex I and II assumes the condition that recruitment of type II fibers increases and anaerobic metabolism is promoted.18 After the completion of this exercise, they immediately moved to the treadmill, where they reproduced the same VO2max as that during the walking test; then, they performed 20 min of AR at a speed equivalent to 4 METs under both conditions. The participants were instructed to walk assuming that they were pressing against the floor with their lower limbs while performing the NW test. The length of the poles used during the NW test was similar to that of the poles used in the pretest (height×0.68), which was in accordance with the International Nordic Walking Association (INWA) guidelines.12 After AR, the participants remained seated for 5 min and then performed the Ex II with the same intensity as that of Ex I. Then, they immediately performed AT. Their performance results were then compared (Figure 1).
Figure 1. Main Exercise (Ex I and Ex II) Protocol
Measurements
Physiological parameters: The respiratory gas concentrations were corrected using the concentrations of three types of gases that were measured prior to the exercises (O2 , 15.71%; CO2 , 4.47%; and N2 , 79.81%). The respiratory gas concentration and ventilation volume were measured every 15 s during both the resting and exercise periods using an automatic respiratory gas analyzer aerometer (AE-310s, Minato Medical Science Co. Ltd, Osaka, Japan).
HR was measured using a patient monitoring device (BSM-2401, Nihon Kohden Corp., Tokyo, Japan). ECG waves were continuously recordedand were subjected to A/D conversion (PowerLab 16/30, ADInstruments, Sydney, Australia) at 1 kHz. The data were then entered into a specialized computer software (LabChart 7 Japanese, ADInstruments, Sydney, Australia), and at 30-s intervals in the continuously recorded data, HR (bpm) for each minute was calculated from the number of R-peaks.
La levels were measured using a blood lactate analyzer (Lactate Scout, EKF Diagnostics, Cardiff, UK). When collecting blood samples, the participants’ fingertips were disinfected using alcohol and a cotton swab and then completely dried. Next, the fingertip was punctured using a lancet (BD Safety Lancet, BD, Japan). The initial quantity of blood from the puncture was wiped away using KimwipeTM, and 0.5 μl of blood was then collected.
We measured 8-Oxo-2’-deoxyguanosine (8-OHdG) activity, which is an index of exercise-induced stress, in the urine using a urinary oxidative stress marker monitor (ICE-001, Techno Medica Co., Ltd., Kanagawa, Japan). Prior to the pretest resting period, immediately after the test, approximately 2 mL of urine samples were collected, which were then frozen until analysis.
Localized fatigue in the upper and lower limbs: The participants underwent subjective assessments of localized fatigue of the upper and lower limbs using the visual analog scale (VAS) immediately after the start of AR, at 2 and 5 min, and thereafter at 5-min intervals up to 20-min after the test. A Likert-type scale ranging from not fatigued at all (0 mm) to fatigued (100 mm) was used by the participants who placed a check mark at the appropriate level.
Work and workload: Work was measured by recording the continuous data for power value (WATT) every 0.1 s that was output by the computer receiving the data from the cycle ergometer. To eliminate the effect of the participant’s body types when comparing the data, we calculated the value after dividing by the body weight (watt/kg). The total workload over a 90-s interval (kg×m) was calculated by dividing the workload for the 90-s interval calculated at every 0.1 s by 1.02.
Statistical analysis: All the measurement results were presented as the mean±SD. Regarding the normality of the data, we confirmed the results consistent with the Gaussian distribution, and then 2-way ANOVA was applied. In cases where a significant difference was observed, the Bonferroni test was used as a post-hoc test. Differences in the mean values of speed and work, maximal AT values, and La after Ex Iand II were analyzed using the paired student t-test. The standard of significance was set at< 5%. Statistical analysis was performed using Prism6 (GraphPad Software, USA)
RESULTS
Pretest
All-out test: VO2 and HR increased as the speed and load increased. The participants maximum oxygen intake (VO2max) and maximum HR (HRmax) were 54.1±2.6 mL/kg/min and 181.8±7.0 bpm, respectively. The main exercise load calculated using the load and %VO2 regression formula at 120 rpm was 3.56±0.26 kp (Table 2).
| Table 2. Walking speed at 4 METs, expected HR and VO2 obtained in Walk test |
|
Subject
|
Speed (m/ min) |
VO2 (ml/min/kg) |
HR (bpm) |
| W |
NW |
W |
NW
|
|
A
|
60.0 |
57.0 |
14.2 |
90.0 |
9.8 |
| B |
91.2 |
87.6 |
21.4 |
108.1 |
107.6
|
|
C
|
66.7 |
60.4 |
15.9 |
92.2 |
92.9 |
| D |
85.5 |
79.0 |
12.6 |
85.6 |
88.5
|
|
E
|
69.2 |
61.9 |
21.4 |
109.9 |
112.7 |
| F |
66.0 |
51.5 |
16.8 |
94.4 |
84.8
|
|
Mean
|
73.1 |
66.2* |
17.1 |
96.7 |
96.6 |
| SD |
12.3 |
14.0 |
3.7 |
10.0 |
11.1
|
| *p<0.05, ><0.05, compared to W |
W and NW tests: No significant differences were observed between VO2 for W and NW at 60 m/min. However, the following VO2 values were obtained for the tests: 18.7±2.1 and 20.5±3.2 mL/kg/min at 80 m/min (p<0.05); 24.6±3.5 and 26.7±4.1 mL/kg/min at 100 m/min n (p<0.05); and 32.6±3.8 and 36.3±4.3 ml/ kg/min at 120 m/min p<0.05), respectively. These results indicated that the VO2 values were speed-dependent and were higher for NW than for W (Figure 2a).
Figure 2. Changes of VO2 (a) and HR(b) in Walking Test
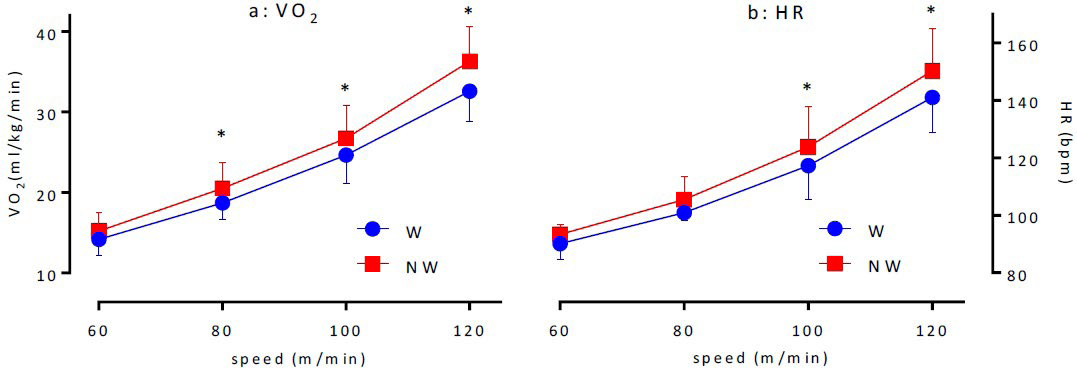
No difference was observed between the HRs in W and NW at 60 and 80 m/min. However, the following values for W and NW were obtained: 117.3±11.8 and 123.8±14.1 bpm at 100 m/mining (p<0.05) and 141.0±12.1 and 150.3±14.7 bpm at 120 m/min (p<0.05) respectively. These results indicated that HR was speed-dependent and tended to be high for NW than for W, which was similar to that observed for VO2 (Figure 2b).
The walking speeds equivalent to an intensity of 4 METs during AR activity as calculated based on the walking tests are shown in Table 1. The walking speeds for W and NW were 73.1±12.3 and 66.2±14.0 m/min, respectively, indicating that the walking speed for NW was significantly lower than that for W (p<0.01). The anticipated VO2 and HR when AR was performed at these walking speeds were 17.1±3.7 mL/kg/min (both the groups), 96.7±10.0 bpm (W), and 96.6±11.1 bpm (NW), respectively (Table 2).
Main Exercises
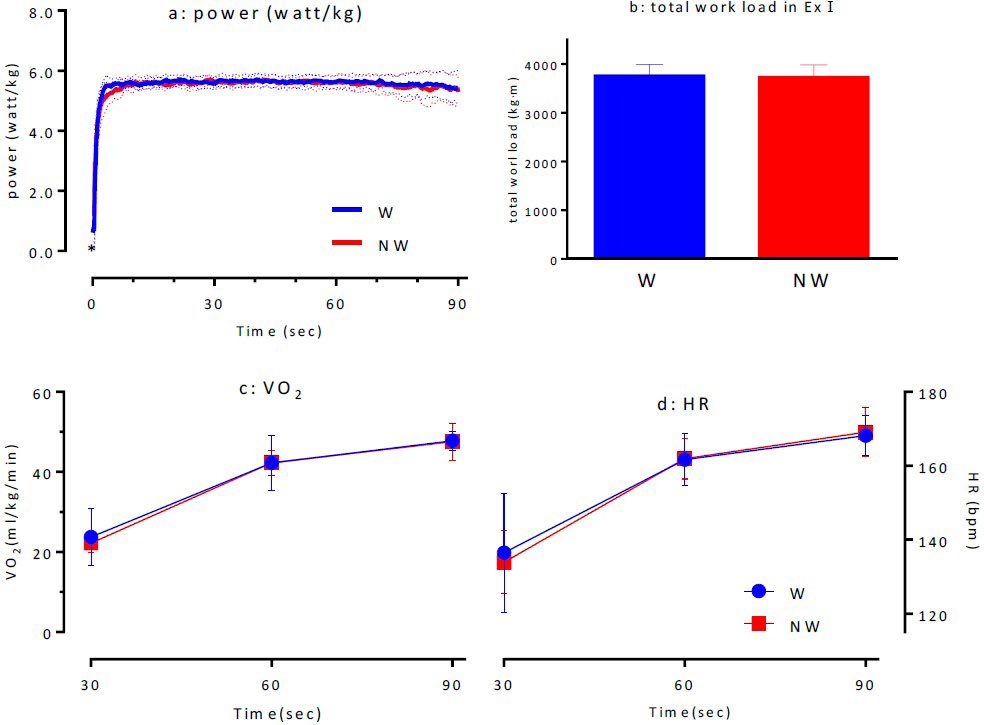
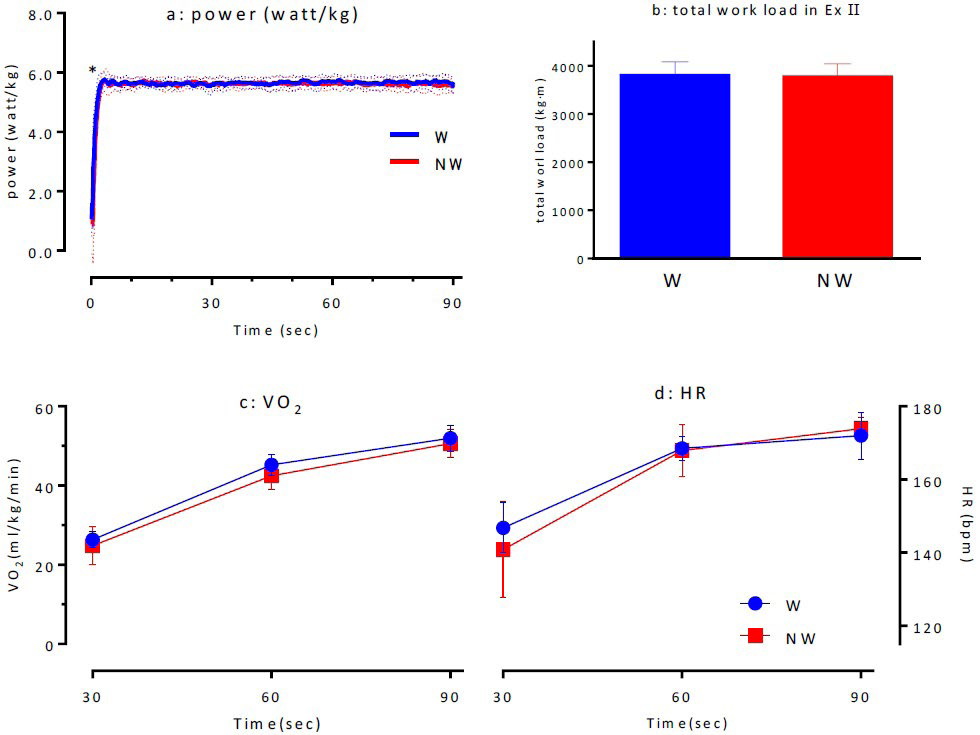
Ex I: The total values calculated from the Ex I were 3761.2±229.6 kg×m for W and 3730.6±249.1 kg×m for NW, indicating that there was no significant difference between them (Figure 3d). The comparison of the power values (WATT/kg) sampled at 0.1-s intervals during Ex I indicated that there was no significant difference between N and NW. However, within 1 s after standing, NW had a significantly lower power value than W (p<0.05; Figure 3a). The investigation of VO2 (Figure 3c) and HR (Figure 3d) for both the conditions during Ex I indicated that there were no significant differences between the two conditions, suggesting that the same exercise load was applied to both the exercise groups.
Figure 3. Time-course of Power (a), Total Work Load (b), VO2 (c) and HR (d) in Supramaximal Ex I
AR: Physiological response and subjective assessment of exercise intensity during AR The investigation of VO2 and HR while at rest, immediately after Ex I, and up to 20 min after AR indicated that although the values tended to be lower in NW than in W, the differences were not statistically significant (Figures 4a and 4b).
Figure 4. Changes of VO2 (a), HR (b), La (c) and VAS Scale (upper limb: d and lower limb: e) during AR
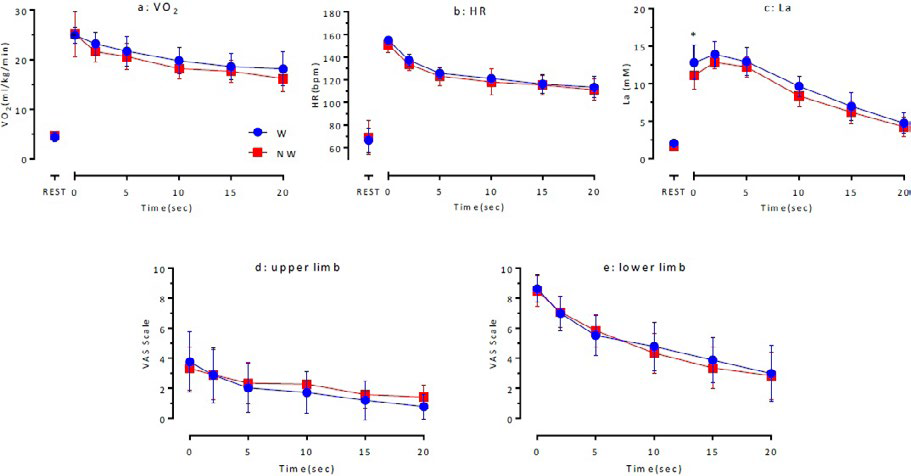
The maximum La levels for NW immediately after the main exercise until 5 min after the exercise were significantly lower than those for W (11.6±0.7 mM vs. 12.9±1.5 mM (p<0.05). La levels for W and NW after ≥10 min of exercise indicated that there were no significant differences between the values for N and NW, although the values were lower for NW than for W (Figure 4c).
No statistically significant differences were observed between the two groups in terms of VAS scores (Figures 4d and 4e), which indicated localized fatigue of the upper and lower limbs during AR activity.
Ex II: The total work values for W and NW calculated for Ex II were 3808.3±271.0 kg*m and 3779.3±258.6 kg*m, respectively, indicating that the work was similar for both the exercises (Figure 5d). The power values during Ex II were significantly lower for NW within 1s after starting the activity, as observed in main exercise I (p<0.05; Figure 5a). No statistically significant differences were observed between VO2 (Figure 5b) or HR (Figure 5c) for W and NW during Ex II.
Figure 5. Time-course of Power (a), Total Work Load (b), VO2 (c) and HR (d) in Supramaximal Ex II
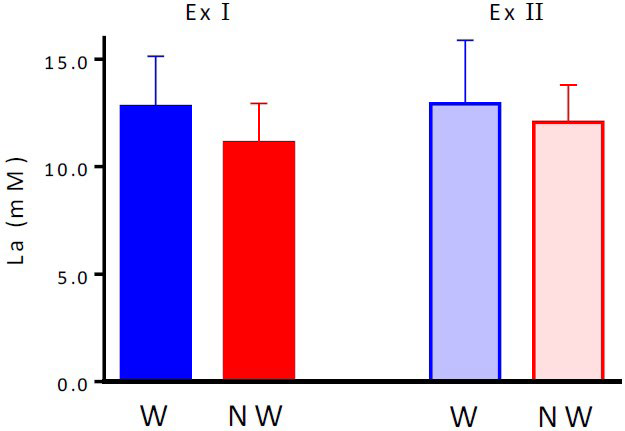
Blood LA levels after the main exercises: La levels immediately after completing Ex I for W and NW were 12.8±2.3 and 11.1±1.8 mM, respectively, which were not significantly different from La values immediately after completing Ex II. (W: 12.9±3.0 mM; NW, 12.1±1.7 mM; Figure 6).
Figure 6. La after each Supramaximal Exercise Test
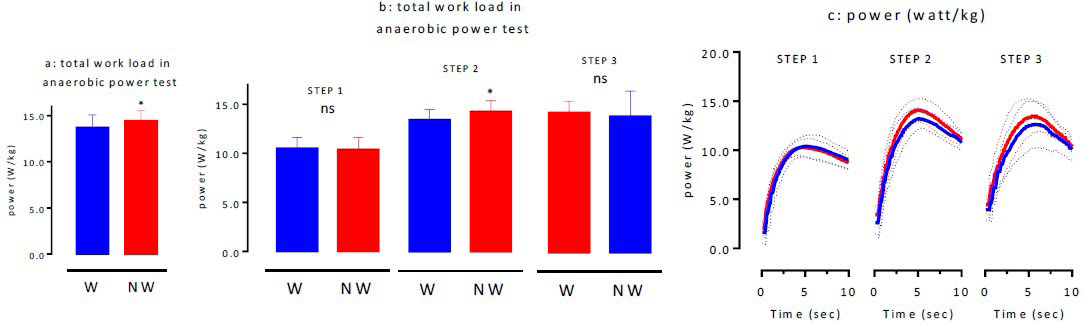
AT: After Ex II, the participants performed AT, which consisted of three sets of full-power bicycle pedaling for 10 s using the Power- Max VIII as the default program. The first attempt was designated as step 1, second as step 2, and third as step 3. The maximum anaerobic power values for W and NW as calculated based on AT were 13.70±1.1 watt/kg and 14.5±1.0 watt/kg, respectively, indicating that the values for NW were significantly higher than those for W (p<0.05; Figure 7a). The comparison of the actual measured values indicated that the maximum power for steps 1-3 during W was 10.50±0.9 watt/kg (step 1), 13.4±0.9 watt/kg (step 2), and 13.0±2.0 watt/kg (step 3), whereas during NW was 10.4±1.1 watt/ kg (step 1), 14.3±0.8 watt/kg (step 2), and 13.9±2.4 watt/kg (step 3), respectively (Figure 7b). The maximum power for step 2 was significantly higher during NW than during W (p<0.05). Figure 7c shows the variations in the power values at all the steps.
Figure 7. Total Work Load (a), Work Load in each STEPs (b) and Time-course of Power of each STEPs (c) in Anaerobic Power Test
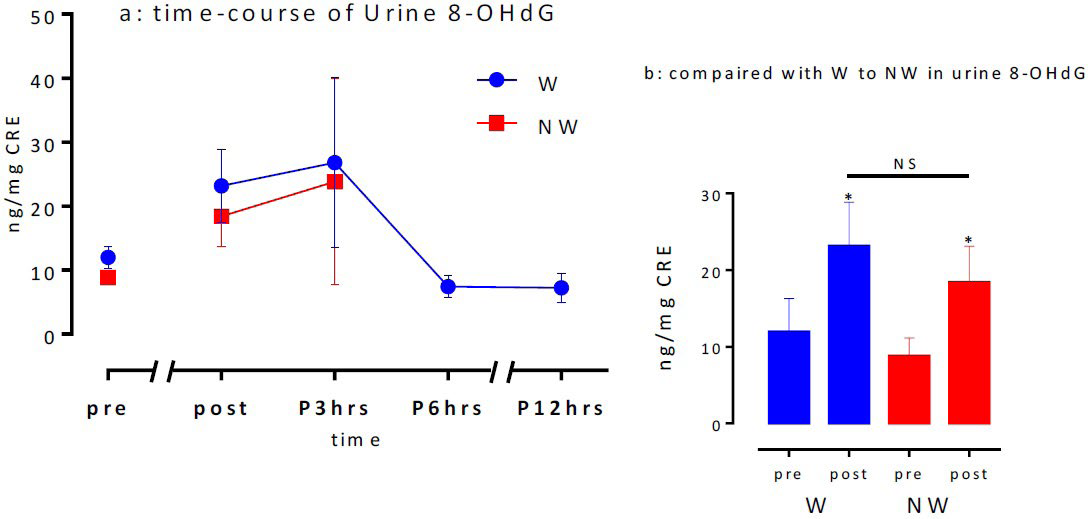
Urinary 8-OHdG activity: Figure 8a shows the changes in urinary 8-OHdG levels prior to Ex I until 12 h post-exercise (next morning). The levels were approximately two-fold higher after the main exercises than those before for both the exercises. The maximum values were obtained 3 h after the exercise, which returned to baseline levels after 6 h. The pre-exercise 8-OHdG levels for W and NW were 12.0±4.3 and 8.8±2.3 ng/mg/CRE (NS),whereas the levels immediately after the exercises were 23.2±5.7 and 18.4±4.7 ng/mg/CRE (NS), respectively, indicating a significant increase after the exercises. However, no significant differences were observed between the groups (Figure 8b). Although not shown in the data, no statistically significant differences were observed between the pre- and post-maximal exercise test urinary 8-OHdG levels for the aerobic exercise.
Figure 8. Time-course of Urine 8-OHdG (a) and compared with W to NW in Urine 8-OHdG (b)
DISCUSSION
This study aimed to investigate the physiological responses to a performance test during and after recovery to elucidate the AR effect of NW performed after supramaximal exercise.
VO2max measured for the maximal exercise test performed by the participants was 54.1±2.6 mL/kg/min, regardless of the fact that it was performed on a cycle ergometer. VO2max measured using a cycle ergometer is approximately 10% lower than that measured using a treadmill, because the cycle ergometer values measure localized exercise.13 Based on this fact, we anticipated that the value measured when using the treadmill would be approximately 60 mL/kg/min, as the participants were individuals with a high degree of physical strength. The intensity levels of Ex I and II were calculated by extrapolating the work at an intensity of 120% VO2max using relative expression (primary regression equation) of the load (kp) and %VO2max measured during the Ex test. The load value was then recalculated for pedaling at 120 rpm for 90 s. More fast muscle fibers were mobilized when the pedaling speed was increased over 90 rpm; thus, by increasing glycolysis, the exercise activity promoted lactate acid metabolism. Therefore, we set the main exercises at parameters of 120% VO2max, 120 rpm, and 90 s because we believed that these parameters would be appropriate for investigating the AR effect on exercises involving sufficient mobilization of fast muscle fibers.
We investigated whether both the conditions during Ex I had the same performance level, and the results showed that the work values for Ex I (W, 3761.2±229.6 kg*m; NW, 3730.6±249.1 kg*m) did not significantly differ between the two conditions. Moreover, VO2 and HR, which are physiological indices, increased over time under both the conditions (p<0.001), and no significant differences were observed between the conditions. Based on these findings, the effectiveness of AR and subsequent performance could be identified. Studies on W and NW tests indicated that VO2, HR, and OMNI scores for both W and NW were consistent between the present and previous studies.13 Moreover, these values significantly increased with increasing speed p<0.001), and the speed maintained at 4 METs during NW (66.2±14.0 m/min) was significantly slower than that during W (73.1±12.3 m/min; p<0.05). With the use of an exercise that involves different body weight support for AR activity, we selected conditions with different AR intensities for the main exercises. The major difference between the two conditions was the fact that W was mainly a lower limb exercise, whereas NW was a more systematic exercise which mobilized both the trunk and upper limbs. NW has a larger stride than W, and therefore, it can be performed at a lower speed even at the same intensity as that of W. Furthermore, it can be assumed that in NW, there is less load on the lower limbs.14,15,17 Because NW mobilizes the muscles of the trunk and upper limbs, which are less utilized when performing the main exercise of pedaling with lower limbs at rest, there may be differences in AR effects for W and NW despite being performed at the same intensity.
No significant differences were found between the two conditions in terms of VO2 and HR. The investigation of all the parameters, regardless of the fact that the exercises were performed at the same intensity, indicated that La levels peaked immediately after completing the main exercise until 5 min after the exercise and significantly declined under both the conditions p<0.05). However, although the performance was similar during both the exercises, during Ex I, the La peak during W was significantly higher than that during NW (p<0.05), and it later reached the same level. These differences in La peaks may be attributed to the speed at which La was released into the bloodstream and its reuse (the lactate shuttle) in the protagonist muscles.6,7 The lactate produced by fast muscle fibers is released into the bloodstream and then circulates throughout the body. However, as the protagonist muscles worked at a relatively low intensity during NW, there may be an increased substrate utilization of lactate by slow muscle fibers when the muscles of the upper limbs and trunk were simultaneously utilized.19 The actual HR during AR was slower in NW than in W; However, both the rates were approximately similar. When vigorous arm movements are added to leg exercises, both the blood flow in the upper limbs and oxidation in the muscles decline,19 therefore, individuals with weak upper limb muscles experience overload during NW.20 Further studies on the appropriate setting of load intensity must be conducted.
The comparisons of post-AR performance tests indicated that total work, VO2, HR, and power fluctuations over time did not significantly differ between the two conditions during Ex II. The results of subsequent performance tests indicated that there were significantly higher maximum AT values for NW than for W (p<0.05). Moreover, significant differences were observed between steps 1 and 3, and the maximum power value at step 2 was significantly higher for NW than for W. This indicated that the amount of La energy exerted with respect to the anaerobic energy supplied plays a major role during NW. Specifically, our findings suggested that AR in the form of NW contributes to energy recovery in the La system. During NW, a better blood supply was maintained in the upper limbs and trunk than during W. Thus, La reuse was effective, and as the load was distributed to the upper limbs and trunk, the total load on the lower limbs decreased. This was the major reason for the improvement in performance. Moreover, during exercise, the blood flow is redistributed to the protagonist muscles3; therefore, during supramaximal exercise, hepatic blood flow volume and La glyconeogenesis via the Cori cycle decrease.21 Nevertheless, because systemic blood flow increases during NW, slow muscle fibers are utilized, and the myocardium allows a more effective energy recovery during W, which is then used for subsequent performance.
The results of our urinary 8-OHdG activity measurements, which were used as an index of stress induced by anaerobic exercise, indicated that there were no significant differences between the two conditions during W and NW. However, the activity significantly increased after the exercise. Increased 8-OHdG activity was maintained at a high-level until 3 h after the exercise. However, after 6 h, it returned to the resting level. Urinary 8-OHdG activity is affected by the type of exercise, and it does not significantly increase during aerobic exercises.22,23 Finally, the use of NW as an AR exercise led to high maximum power values in step 2 during AT. This suggested that NW contributed to energy recovery in the La system. Future studies on the association between increased intensity of the main exercise, conditions that increase La metabolism, upper limb muscle strength, and body composition must be conducted to elucidate the efficacy of NW as a form of AR exercise.
Although the number of cases in this study is small, it is a new finding that sufficient direction can be shown in the effectiveness of active recovery by Nordic walking.
However, as an experimental limitation, there is a need to conduct a more practical examination and there is a need for examining by increasing the number of subjects under practical measurement conditions.
CONCLUSION
By mobilizing the upper limb and trunk muscles, which are utilized sparingly when the protagonist muscles of the lower limbs are resting after performing Ex I (lower limb exercise), we investigated the speed of recovery. The results indicated that although there were no significant differences between the two conditions during Ex II, which was a similar exercise performed after Ex I, same amount of work was performed in both the exercises. However, the maximum anaerobic power of the performance test performed after the pretest was significantly higher for NW. The maximum power value for step 2 was high, which suggested that it played a role in the energy recovery of the La system.
ACKNOWLEDGEMENT
This work was supported by JSPS KAKENH Grant Number 17K13123.
CONFLICT OF INTEREST
There are no specific companies and or organizations in conflict of interests to be disclosed in present research.


