INTRODUCTION
The optimal training recipe for improvement in performance in each of the modes of swimming, cycling or running is one of the most important elements of competitive triathlon. Therefore the search for new training methods to achieve improved triathlon performance is of paramount significance for coaches and scientists. The running component of elite triathlon largely dictates overall race performance.1,2,3,4 Thus, improving running performance is viewed as the most important triathlon modality to achieve a satisfactory final race outcome especially in elite athletes.1 Therefore, training for many athletes should focus on optimizing running performance.
Maximal oxygen uptake (VO2max) and other submaximal physiological parameters are often viewed as key performance indicators in triathletes and other endurance athletes.5 Recently the effects of high-intensity interval training (HIIT) on VO2max, anaerobic threshold (AT), running and cycling performances in endurance running and triathlon have been investigated, concluding that interval training consisting of multiple 5 min bouts at high intensity (85% of maximum heart rate (HRmax) was more likely to benefit 5 km running performance.6,7 Short and long intervals at supramaximal and submaximal exercise intensities respectively, improved cycling physiology and performance.6,7 Lindsay et al8 concluded that, in competitive cyclists, a 4-week program of HIIT increased peak sustained power output and fatigue resistance by ~5% and significantly improved 40 km time trial performance. In contrast, Acevedo and Goldfarb found no improvement in VO2max in competitive long distance runners after 8 weeks of HIIT.9 However, 10 km race performance and time to fatigue did improve indicating that improvements in performance can be dependent of other variables in elite athletes.9
Some authors have defined cross-training as a) the participation in an alternative training mode exclusive to the one normally used in competition b) combining an alternative training mode with task-specific training c) cross transfer of training effects from one sport to the other one.1,10 Several investigations have focused on cross-training transfer between swimming and running.11,12,13,14,15 Millet et al1 found that swimming training did not provide additional beneficial adaptations for the other disciplines in triathlon. They concluded that swimming training was highly specific, there were no significant relationships between training amounts in cycling or running and performance in swimming. Hence, performance improvement in swimming would be due specifically to improved swim technique and propulsive efficiency in swimming.1 However, they were able to show that improvement in running performance may be as a result of training in cycling, which had a significant effect on running performance (τ1 =42: r=0.56: p<0.001) Additionally, performance in triathlon was related to the running training amounts (τ1 =52; fatigue function: τ2 =4: r=0.52; p<0.001).1 Others have shown that training in cycling may help reduce over-use injuries, maintain aerobic condition and/or minimize stress during high training periods.1,16,17 But few investigations have examined the impact of HIIT training on cycling or running performance in triathletes.7 Similarly, there is limited evidence of the impact of HIIT in cycling and it is effects on running performance.
For these reasons, the purpose of this study was to observe the performance and physiological outcomes in incremental running and cycle time trial performance in triathletes during 4 weeks of HIIT of either cycling or running. It was hypothesized that cycling HIIT would enhance running performance in well trained triathletes.1
MATERIALS AND METHODS
Participants
Twelve male well-trained triathletes with a minimum of 2 years triathlon experience were invited to participate in the study. Their physical characteristics were (mean±SD); age, 34.0±5 yr; height, 178.8±3.2 cm; mass, 74.1±5.3 kg, body mass index (BMI) 23.3±1.6 kg·cm-2,, VO2max 60.6±4.7 mL·kg-1·min-1 (Table 1). The inclusion criteria was that they were training between 6-10 h a week to compete in a half ironman. Prior to commencement of the study the subjects completed a pre-questionnaire in order to establish background information on training patterns and medical history. The participants were divided into 2 HIIT groups: bike HIIT completed 2 sessions of HIIT cycling per week and run HIIT completed 2 sessions of HIIT running per week.
Table 1: Anthropometric measures of study participants.
BMI: Body mass index; VO2max: Maximum rate of oxygen consumption
|
Variables
|
Mean±SD |
| Age (years) |
34±5
|
|
Body height (cm)
|
178.8±3.21 |
| Body mass (kg) |
74.1±5.3
|
|
BMI (kg·cm-2)
|
23.29±1.55 |
| VO2max (mL·kg-1·min-1) |
60.55±4.72
|
The Institutional Ethics Committee (IEC) Comité De Ética en la Investigación con Seres Humanos (CEISH) de la Universidad del País Vasco (UPV/EHU) approved on February 11th 2015, the study following the guidelines of the World Medical Association (WMA) declaration of Helsinki-Ethical principles for medical research involving human subjects. Participants were informed about the study protocols and experimental procedures, and provided written informed consent.
Testing Protocol
The participants were familiarized to the laboratory procedures before any testing. They were tested on 2 occasions (1) before the HIIT period and (2) following 4 weeks of HIIT. The subjects completed a maximal incremental treadmill test for determination of the lactate threshold, VO2max and a 20 min cycle time trial at each testing period.
Anthropometric measurements were also taken including: height (cm) and body mass (kg), using International Society for the Advancement of Kinanthropometry (ISAK) criteria. After a 10 min warm-up on the treadmill (Trackmaster, USA), a maximal test was performed. This consisted of 3 min stages with 30 seconds recovery. The 1st stage started at 8 km/h and the velocity increased 2 km/h until exhaustion. The time in the stage and the speed at exhaustion was recorded. To simulate the energetic cost of outdoor running conditions, the treadmill was set at 1% gradient.7,18
Heart rate (HR) was measured with a thoracic belt and wrist receiver (Polar RS400, Finland) during the test.
After each 3 min stage and during the 30 s recovery, blood Lactate concentration (BLa) was measured (Lactate Pro Analyser, Arkray, Japan). Two measures of the lactate threshold (LT) were calculated using the D-max method graph to observe the performance outcomes.19,20 In this study, LTs were classified by 2 mM zone as lactate threshold 1 (LT1) low intensity and>4 mM lactate threshold 2 (LT2) as high intensity. Seiler identified the first low-intensity training zone (LITz) as a stable BLa at ~2 mM. The high-intensity training zone (HIITz) was above maximum lactate steady-state intensity, greater than or equal to 4 mM.21 Finally, the zone between 2 and 4 mM was the threshold training (ThT). In this research, LITz was used as the training intensity area on traditional training weeks and HIITz and LITz on HIIT training weeks.
Therefore, the speed and the HR at LT2, the velocity peak (maximum) and HR maximum achieved were observed to determine the changes on running performance.
During recovery, participants provided a value for rating of perceived exertion (RPE) using the Borg Scale 6-20.22
Additionally, 48 h after the VO2max test the participants completed a 20 min cycling time trial (TT). Each athlete used their competition cycle mounted on a cycle roller training device (Bkool, model Bkool one; Madrid, Spain). The subject’s bike was fitted with a power meter in the hub of the rear wheel (Powertap, model Powertap G3 Alloy Wheels; Madison, WI, USA) for recording average power (W). HR was recorded with a HR and power monitor (Garmin Forerunner 910XT). Average HR, velocity and cadence were measured during the TT.23
Training Intervention
Before the 1st laboratory test session, participants completed 4 low intensity training weeks (control) in which they trained 9 sessions per week (3 swimming, 3 cycling and 3 running). The subjects performed during 4 control weeks 26.28 km (~12 h) swimming, 19.83 h cycling and 10.42 h running. Participants exercised at less than 70% of the maximum heart rate (MHR), and trained below LT1 (<2mM) measured during the pre-test, accumulating 7.5 h of training per week. The 4 week control sessions were designed in order to familiarize and obtain a similar start point for all subjects before the pre-test.
After the pre-test, participants were randomly assigned into one of 2 HIIT groups. Both groups completed the same swimming sessions, however, the HIIT cycle group completed 2 HIIT cycling sessions per week and the HIIT run group performed 2 sessions of HIIT running per week. Each HIIT session was 7×5 min at 85% of MHR and HIITz (>4 mM). Running intensities were extrapolated using D-max graph and cycling intensities using 20 minutes TT test as published by Allen and Coggan.23 All intensities were corroborated using exercise intensity categories (subjective and objective measures) Norton et al.24 Besides the 2 HIIT sessions every week, another seven (3 swim, 1 or 2 run and 1 or 2 cycle) training sessions in each group were aerobic extensive, lower than 70% of MHR and LITz(<2 mM), identical intensity than control weeks. During HIIT training weeks, all subjects performed ~12 h swimming (25.95 km). Additionally, the bike HIIT group completed 4.2 h bike HIIT, 13.4 h cycling and 18.2 h running and the run HIIT group completed 10.8 h cycling, 4.2 h run HIIT and 6.1 h running.
During 8 training weeks (4 control weeks and 4 HIIT weeks), each triathlete recorded their total HR data for all their training sessions (less swimming sessions), using a range of HR monitors (Polar Electro, models RCX5 and RC3, Finland and Garmin Forerunner, models 910XT and 920XT, Olathe, Kansas, USA) and the RPE for each session.
Statistical Analysis
The statistical analysis was performed with SPSS Statistics 20. To evaluate whether data were normally distributed the ShapiroWilk was used. In the case of normal distribution, for a pre- and post-test group comparison the student’s t-test for paired samples was applied.
To determine possible interaction effects between groups a 2 factor analysis of variance (ANOVA) with repeated measures on the 2nd factor was calculated. Independent post-hoc t-test was applied for an inter-group comparison. The level of significance was set at p≤0.05.
RESULTS
HR and Velocity at LT1 on a Maximal Treadmill Test
For each group, the velocity at 2 mM on the treadmill increased while HR at this point decreased in both groups, however, no significant differences were observed between pre- and post-test for these variables at 2 mM (LT1).
Running velocity at LT1 improved (11.9±1.7 vs. 12.7±1.5 km/h) in the cycle group and in the run group (11.56±1.0 vs. 11.8±1.5 km/h). Additionally, HR at LT1 was reduced (157±18 vs.147±11 bpm) in the cycle group and the run groups (154±9 vs. 141±16 bpm) (Table 2).
Velocity and HR at LT2 on a Maximal Treadmill Test
At the post-test, velocity (F=6.93, p=0.025) and HR (F=9.01, p=0.013) at 4 mM, on treadmill showed significant differences between groups, being lower in run group than cycle group at post-test. However, no significant differences were found between tests (Figure 1, graphs B and C). Cycle group showed a greater improvement on velocity and HR at LT2 compared with the run group which diminished both variables (Table 2) (Velocity: 14.4±1.47 to 14.13±0.94; HR: 166±10 to 163±8) at this point on post-test than pre-test in run group, without significance differences.
Table 2: Mean±SD aerobic capacity, aerobic power and heart rate during the incremental exercise test in the Bike HIT and Run HIT groups pre- and post- the intervention program.
V: Velocity; HR: Heart rate.
|
HIT BIKE
|
p-value
(intra-group)
|
HIT RUN
|
p-value
(intra-group)
|
|
Pre
|
Post
|
Pre
|
Post
|
|
V 2 mM
|
11.9±1.72 |
12.7±1.54 |
0.46 |
11.56±1.01 |
11.8±1.49 |
0.69 |
| V 4 mM |
14.85±1.48 |
15.62±1.01 |
0.28 |
14.4±1.47 |
14.13±0.94
|
0.50
|
|
HR 2 mM
|
157±18 |
147±11 |
0.77 |
154±9 |
141±16
|
0.66 |
| HR 4 mM |
173±13 |
175±5 |
0.77 |
166±10 |
163±8
|
0.29
|
|
V peak
|
19.00±1.09 |
18.67±1.03 |
0.36 |
18.00±1.26 |
17.33±1.03 |
0.36 |
| HR peak |
187±5 |
187±8 |
0.70 |
180±9 |
177±11
|
0.26
|
However, no significant differences were observed between pre- and post-test for either group, in variables such as, velocity and HR at 4 mM.
Velocity and HRpeak (Maximal) on a Maximal Treadmill Test
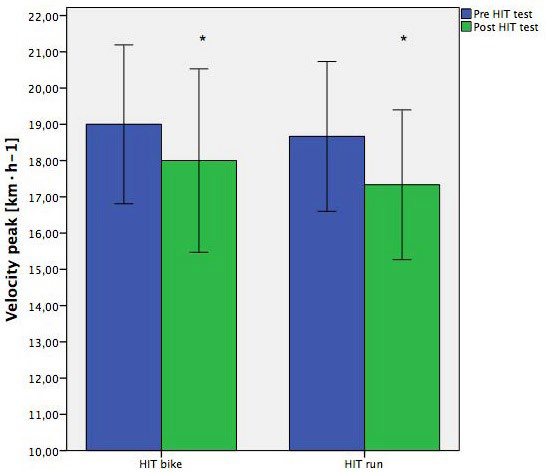
Velocity peak in running tended to be lower in both groups, presenting significant differences at the post-test (F=5.0, p=0.049), from 19.0±1.1 to 18.7±1.0; 18.0±1.3 to 17.3±1.0 for bike and run group, respectively (Figure 1, graph D).
However, no significant differences were recorded for velocity or HR peak during the incremental running test between pre- and post-tests for each group (Table 2). The HRpeak was similar in the bike HIIT group but was slightly lower in the run group after 4 weeks of HIIT (Table 2).
HR, Velocity and Cadence Average on 20 Minutes Cycling Time Trial
The HR average during the 20 min TT cycle showed significant differences between groups at post-test (F=5.42, p=0.042). In both groups HR average decreased, but in the run group this was greater (Figure 1, graph A). No significant differences between tests were found for velocity, cadence or HR averages during the cycle TT (Table 3).
Table 3: Mean±SD for velocity, cadence and heart rate during the cycle time trial in the HIT Bike and Run groups pre and post the intervention program.
av.: Average; V: Velocity; HR: Heart rate; Cad: Cadence; TT: Time trial.
|
HIT BIKE
|
p-value
|
HIT RUN
|
p-value
|
|
Pre
|
Post |
Pre |
Post
|
|
V av. TT
|
42.0±2.14 |
48.97±1.62 |
0.72 |
41.80±0.94 |
41.05±0.94
|
–
|
|
HR av. TT
|
164±6 |
162±7 |
0.48 |
156±8 |
148±12 |
0.15 |
| Cad av. TT |
95.5±4.93 |
98.8±8.70 |
0.37 |
90.33±9.02 |
98.3±0.58
|
0.53
|
During the time trial cycle, the bike group demonstrated an improvement in average velocity, whereas, velocity was slightly lower in the run HIIT training group. The mean cadence during the cycle time trial was higher in both groups from 95.5- 90.3 during bike and run pre-HIIT test to 98.8-98.3 on post-HIIT test (Table 3).
DISCUSSION
The purpose of this study was to examine the effects of a short period (4 weeks) of HIIT in either cycling or running on incremental running and cycle time trial performance in well-trained triathletes. The results of the study demonstrated that 4 weeks of HIIT cycling (7×5 min at 85% HRmax) induced a slight to moderate improvement in velocity and HR at 2 and 4 mM, and in HRpeak during an incremental treadmill test, however, these changes were not significantly different. These results are in line with previous studies, showing that cycling can result in a cross training effect on running and can be used as an alternative to increasing performance in running.6,7,17
Both groups enhanced velocity at the 2 mM LT or LT1 (6.72% for bike group and 2.08% for run group) and decreased HR at LT1 (Table 2) associated with a cardiovascular adaptation to endurance training.25 These results were in agreement with several authors who observed that HR after endurance training was also significantly lower during submaximal exercise.7,12,17 Therefore, it is highly likely that the use of 8×5 min at 85% HRmax HIIT training might improve running performance at submaximal intensities.
The cycle group participants showed a greater physiological efficiency during post-test to generate more energy, improving HR, and they were more psychologically efficient, enhancing the velocity at high intensities such as LT2. Nevertheless, we observed that in the run HIIT group, velocity and HR at 4 mM were lower on the post-test compared with pretest. These findings contrasted with other research results which showed an improvement for velocity at lactate threshold from 14.6±1.0 km/h on the pre-test to 15.2±0.8 km/h on the post-test after 10-weeks of high intensity-low volume training program on well-trained male middle-distance runners.26
In the case of the HR for the run group, the average HR during the cycle time trial was considerably lower (8.4%) potentially due to residual fatigue from the intensified training. In accordance with this suggestion we hypothesise that the HIIT approach induced significant residual and accumulated fatigue which lead to the inferior post training responses. Some authors investigated the manifestation and mechanism of fatigue and overreach after an intensified training weeks using neural, metabolic, immune function, mechanical and cognitive parameters.27,28,29 Le Meur et al27 observed a 4.4±1.1% decrease in velocity average on performance of highly trained triathletes due to overreach after an intensified training protocol. Additionally, they demonstrated a decrease in HR at submaximal and maximal intensities. In this study, the run group subjects presented a considerable HR decrease in cycle TT test. Furthermore, Hanson et al28 reported a 5.4% decrement in overreached cyclists and Lehmann et al29 showed an 8% decrease during an incremental exercise test in middle and long distance runners. Therefore, in some athletes, elevated training intensity in running may be counter-productive.30 However, this requires further investigation. Also the velocity average during the cycle TT were lower (5.1%), HRpeak, during maximal test in the treadmill, also decreased for the run group while Bike group maintained it. Whereas, the decrease of peak running velocity during the incremental test in the running group (-1.7%) was impressive, there was a significant difference between groups in the posttest for this variable (Figure 1, graph D). It is proposed that the subjects who completed the HIIT running sustained a residual and accumulated fatigue resulting from glycogen depletion or other neurological related fatigue. Some authors explained similar occurrences (HRmax and performance decreases) when they investigated fatigue, overreaching and overtraining.31,32
Figure 1: Mean±SD for Effects of 4 HIT weeks on HR average cycle
*=p<0.05 group interaction.
(Panel A), HR at 4 Mmol
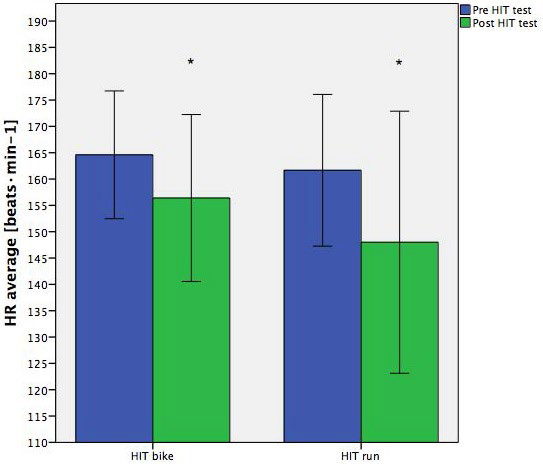
(Panel B), Velocity at 4 Mmol
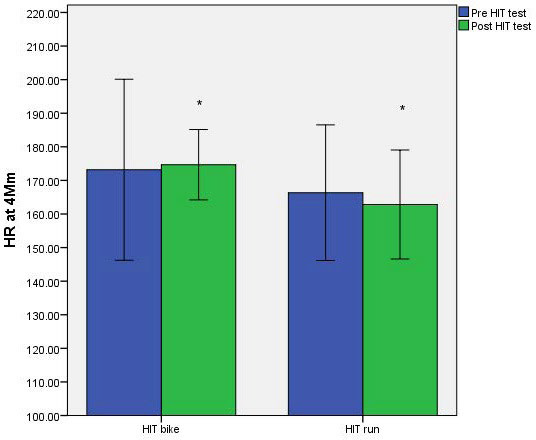
(Panel C) and run velocity peak
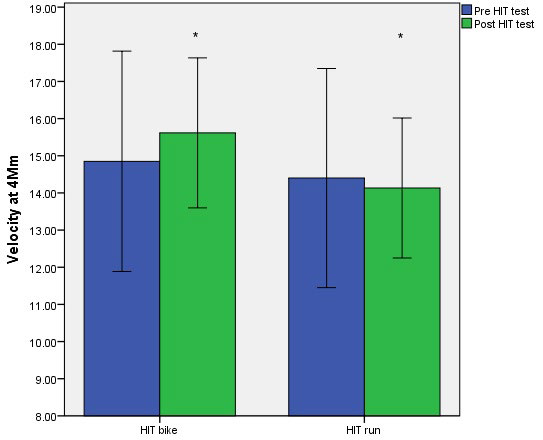
(Panel D) on treadmill running in moderate-well trained triathletes.
The subjects who completed the HIIT cycling enhanced 16.6% for velocity, 3.5% for cadence but showed a reduction -1.2% for HR average. The change in velocity with Bike HIIT was similar to Lindsay et al8 research that showed during a 40 km time trial the velocity average augmented 3.5% after 2 HIIT weeks. However, in the same study, absolute HR values during time trial were higher on post-HIIT test than pre-test (from 89.5±3.2% HRpeak on pre-test to 91.6±3.1% on post-test).8 In our study, average HR in the Bike group showed a decrease of 6.4% at post-test. In the Lindsay et al8 study, subjects were competitive cyclists but our study participants were triathletes with different sports backgrounds and level of performance. This may explain some of the conflicting adaptations. Nevertheless, our results were in agreement with several authors mentioned above, who observed that HR after running training was also significantly lower during submaximal exercise.7,12,17 Future studies should look to examine further the relative benefits of HIIT cycle training on performance in triathletes when running training loads are manipulated.
The run HIIT group presented a decrease of 1.8% for average velocity and 5.1% for average HR. Average cadence was higher post-test (8.8%). These outcomes were dissimilar to Millet et al1 who concluded that running was the discipline which provides the largest transfer to the other triathlon disciplines. It was highly likely that there was no transfer between running training to cycling performance due to the fatigued state and lack of experience of the run triathlete group.
CONCLUSION
Implementing intensified training using individual HIIT sessions in running and cycling improves running performance at low intensities in moderate to well-trained triathletes. Whereas, training using a similar HIIT training method in cycling enhances running performance at high intensities (4 mM) in moderate to well trained triathletes. Additionally, 4 weeks of cycling HIIT training improved cycling performance, whereas, a similar period of running HIIT training did not improve cycling performance due to a possible fatigue accumulation. However, an important factor influencing adaptation to HIIT is prior aerobic conditioning and training experience of the triathletes. It is possible that using HIIT may evoke inferior performance responses due to cumulative fatigue, for this reason, it is necessary to investigate further cross training transfer using the HIIT approach in athletes of different experience and training status.
CONFLICTS OF INTEREST
The authors declare that they have no conflicts of interest.


